
Abstract
In this article, a unified joint detection framework for pedestrian and cyclist is established to realize the joint detection of pedestrian and cyclist targets. Based on the target detection of fast regional convolution neural network, a deep neural network model suitable for pedestrian and cyclist detection is established. Experiments for poor detection results for small-sized targets and complex and changeable background environment; various network improvement schemes such as difficult case extraction, multilayer feature fusion, and multitarget candidate region input were designed to improve detection and to solve the problems of frequent false detections and missed detections in pedestrian and cyclist target detection. Results of experimental verification of the pedestrian and cyclist database established in Beijing’s urban traffic environment showed that the proposed joint detection method for pedestrians and cyclists can realize the stable tracking of joint detection and clearly distinguish different target categories. Therefore, an important basis for the behavior decision of intelligent vehicles is provided.
Introduction
The rapid development of intelligent driving technology has improved road traffic safety and urban traffic congestion. In particular, the protection of pedestrians and cyclists has attracted attention from governments, research institutes, and automobile companies. Effective detection and identification of pedestrians and cyclists is the prerequisite for their protection.
Pedestrian detection usually uses the sliding window method, which scales the image into different sizes and traverses the pedestrian area using a fixed-size window template. Dalal and Triggs used windows of different sizes to slide over the original image. 1 Felzenszwalb et al. scanned and correspond the low-resolution feature image through the root model and then matched the feature image twice the resolution of the root model through the component model. 2 Sermanet et al. combined the output of ConvNet multilayer convolution layer, global shape information, and local detail information to train the convolutional neural network model of pedestrian detection. 3 Similar to pedestrian detection, cyclist detection also uses the sliding window method. Cho et al. established a multi-view cyclist detection model based on the deformable part model. 4 Li et al. designed a cyclist detection method based on improved histograms of oriented gradients (HOG) features and support vector machine (SVM) classifier. 5 Yang et al. and Huang et al. proposed a multilayer cyclist detection method. 6,7 Tian and Lauer established the geometric relationship between the target size and image position based on the geometric constraints of the on-board camera; the scanning range of the image is restricted by cyclist size; and the cascade classifier of multi-view model is used to achieve cyclist target detection. 8 The difference between cyclist and pedestrian detection is that cyclists have different aspect ratios under different visual angles. A single fixed aspect ratio model is difficult to adapt to all cyclists. The use of multiple models will increase the amount of calculation and directly affect the practical application of detection algorithms.
The effect of target detection and classification increases when the target detection and classification model become complex. Some scholars have proposed common target detection and classification methods, including segmentation clustering and window scoring. 9 Segmentation clustering records the areas where detection targets may exist through image segmentation methods, including super pixel clustering, graph cut algorithm, and edge contours. Superpixel clustering generates target candidate regions by merging superpixel points, including the Selective Search, 10 Random Prime, 11 and Rankalankila. 12 Graph cutting solves the image segmentation problem through graph cutting algorithms, 13 including CPMC, 14 Endres, 15 and Rigor. 16 Edge contour combines the segmentation results by edge strength to generate target candidate regions. 17 –19 Window scoring evaluates each candidate window to select a target candidate area. Among these methods, objectness 20 selects the initial candidate region by the prominent position in the image and then scores each candidate region by color, edge, position, and size. Rahtu et al. improved the scoring strategy and features based on the objectness method by generating a large number of initial candidate regions through independent/combined superpixels and multiple random sampling regions. 21,22 Bing identified the target candidate region through simple edge features and linear classifiers and consequently achieved rapid scoring, but the positioning accuracy needs to be improved. 23 Edge boxes select the target candidate region by fast sliding window method and use target edge estimation and individual tuning steps to improve positioning accuracy. 24 Feng et al. proposed a significance measurement method to generate candidate regions. 25 Zhang et al. and Li and Gao proposed a simple gradient feature concatenation SVM method to generate target candidate regions. 26,27 Among these methods, selective search, edge boxes, and region proposal network (RPN) methods provide good results but are only suitable for general object detection. The candidate region selection effect is not ideal for cyclist detection.
Challenges due to pedestrian posture, lighting, occlusion, and scale changes still exist in a real road environment. Compared with pedestrian detection, cyclist detection faces more challenges. Bicycle type and cyclist’s clothes majorly change the appearance of the target, cyclist’s posture changes the overall appearance of the target, and different observation angles change the aspect ratio of the target. Traditional pedestrian or cyclist detection methods usually treat these two targets separately, resulting in confusion of the detection results. The resolution of the traditional target detection model is limited, and effectively solving the above problems faced by pedestrians and cyclists is difficult.
A joint detection framework for pedestrians and cyclists based on deep neural network method is established in this study to solve the challenges faced by intelligent vehicles in the detection and identification of pedestrians and cyclists in complex driving environments. To solve frequent false detections and missed detections of pedestrians and cyclists, poor detection results of small-sized targets, and the complex and changeable background environment, this article presents the following main contributions: (1) a difficult case extraction method is designed based on the fast regional convolutional neural network, (2) a multilayer feature fusion method is designed, (3) an improved algorithm of depth network model is designed for multitarget candidate region input, and (4) a unified method of pedestrian and cyclist joint superscript detection and classification is constructed.
The remainder of this article is organized as follows. The second section introduces the target detection system architecture. Third section presents the pedestrian and cyclist detection methods. Fourth section describes the experiments of the algorithm and analysis results. Finally, fifth section presents some conclusive remarks.
Target detection system architecture
Target detection architecture
The target detection method based on fast region convolutional neural network is the most commonly used target detection framework and is characterized by excellent feature learning and classification ability of the deep convolution neural network model. The target candidate region is classified as the target and background to be detected, and the target recognition field has achieved a remarkable effect.
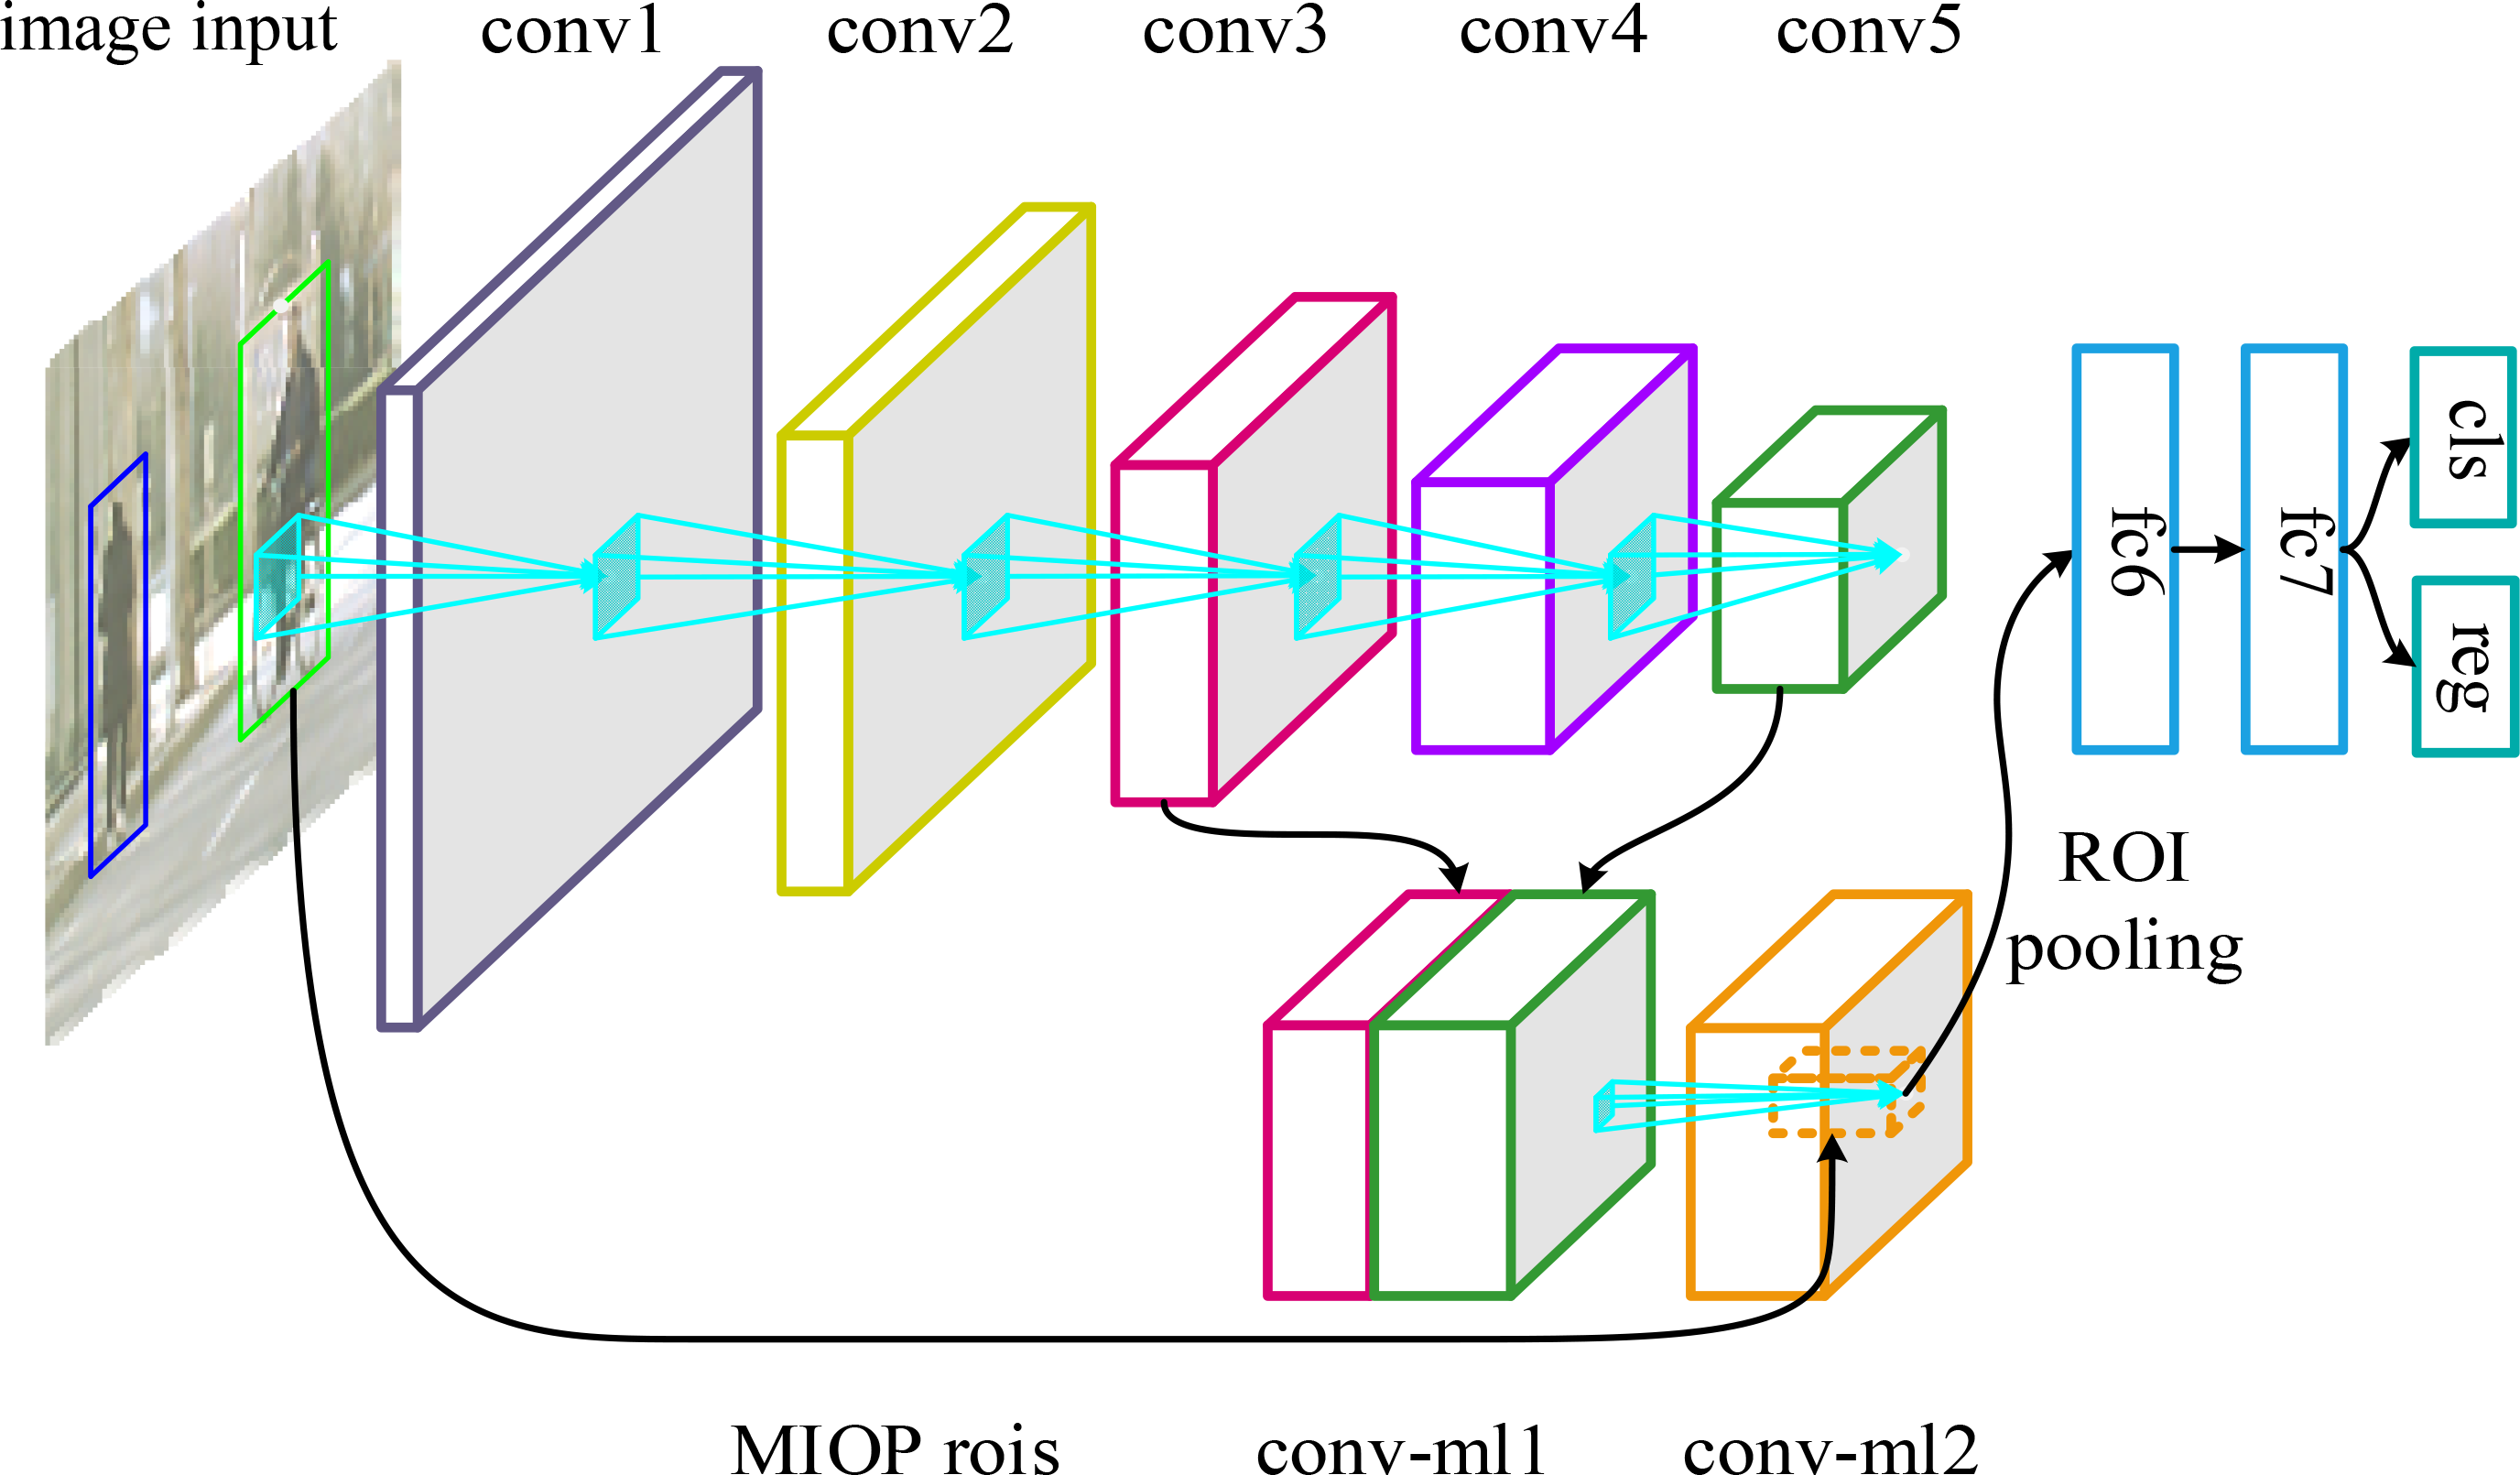
Fast region-based convolutional neural networks (R-CNN) proposes a multi-task simultaneous training model. The method also inputs candidate regions and the whole image extracted by the selective search method, obtains convolution feature maps through the multi-convolution layer and pooling layer, and extracts the feature vectors of fixed length using the pooling layer and the full connection layer of the region of interest (ROI). The feature vectors are encoded to two symbiotic output layers: one for estimating the target category and the other for predicting the target position. Unified training of the classification and positioning models is achieved without occupying large hard disk space, and fast training and detection are realized. The target detection framework of fast R-CNN is shown in Figure 1.

Target detection framework of fast R-CNN.
The fast R-CNN region of interest pooling layer maps any ROI in the feature map (corresponding to the target candidate region in the original image) to a small feature map of fixed size
Fast R-CNN uses two symbiotic output layer networks, one of which is the estimated probability of each category

Among them, the classification loss function is a logarithmic loss function, as shown in the following equation

The second loss function is valid only when the real target category corresponding to the candidate region is not the background. The second loss function is shown in the following equation
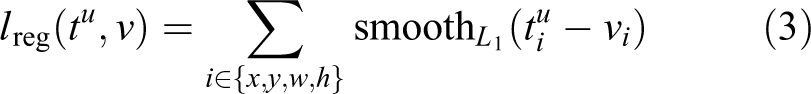
where

In equation (1), λ can adjust the weights of the classification and location loss functions. When tu
and v are normalized,
Deep neural network architecture
The target categories to be detected are pedestrians and cyclists. The probability estimate of the corresponding fast R-CNN output layer includes the three categories (dimension 3) of pedestrians, cyclists, and background, and the bounding-box regression offset includes these three categories (dimension 12, where the background regression offset is zero). Fast R-CNN uses the target candidate region as the multi-example target candidate region selection method (MIOP), and the underlying network model used includes VGG models of different depths: VGG8, VGG11, and VGG16. 28 The VGG network structure diagram of different depths is shown in Figure 2, where the color filled squares represent the convolutional layers or fully connected layers with learning parameters.
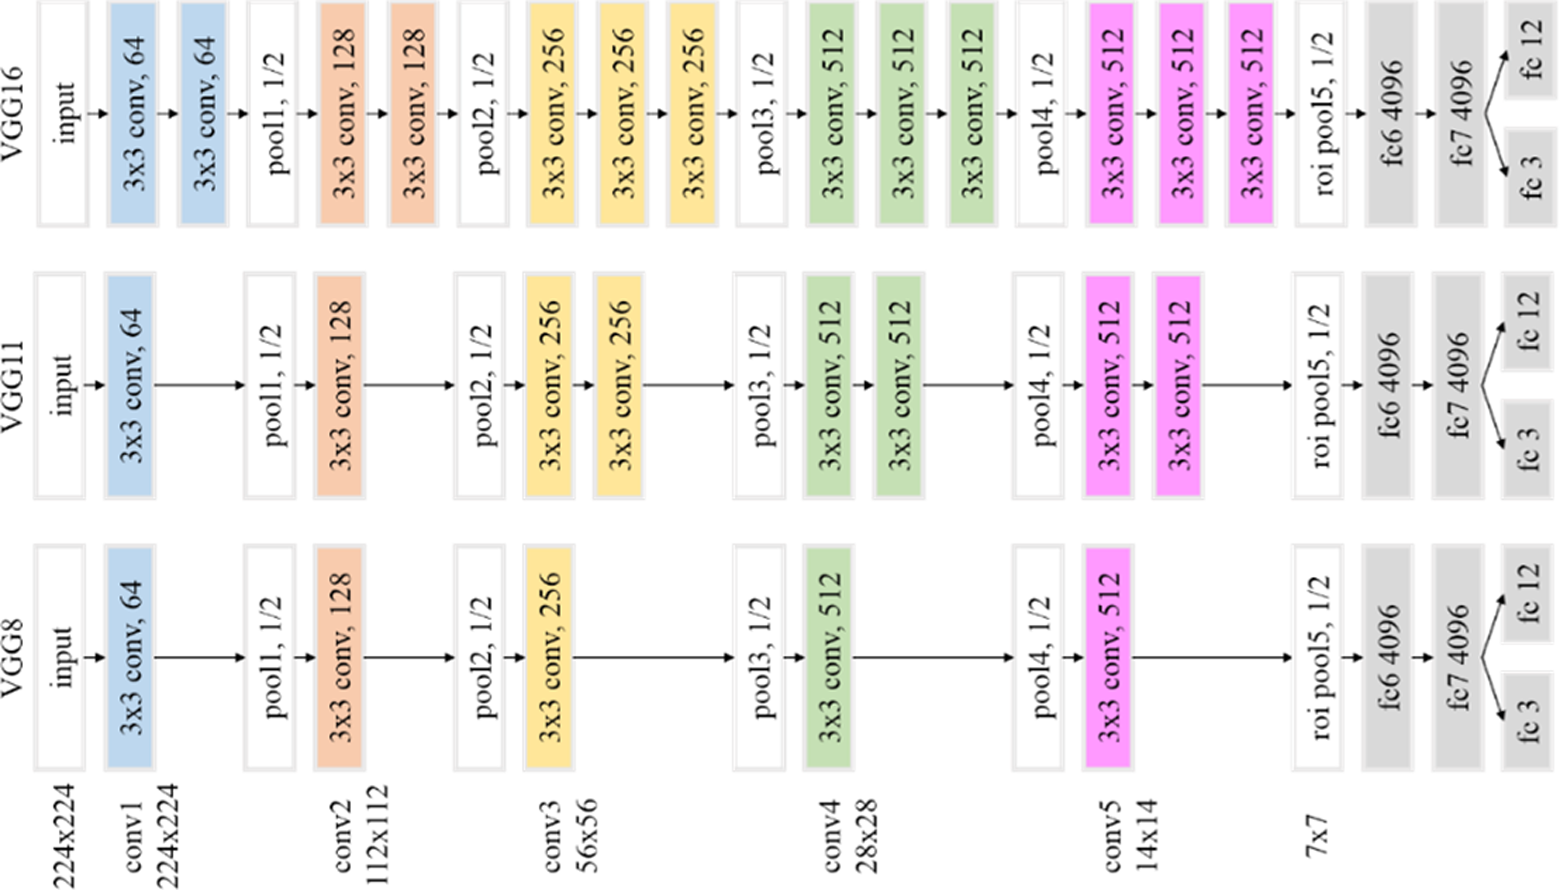
VGG network structure diagram of different depths.
Pedestrian and cyclist detection methods
Difficult case extraction network structure
Ren et al. 29 proposed an online difficult case extraction method to solve the problem of difficult case extraction in fast R-CNN target detection. This technique extracts difficult cases from many samples contained in each batch of training images instead of simply randomly selecting training samples. The selected difficult cases are immediately used for iterative network training, thereby changing the negative sample extraction conditions and random extraction methods in fast R-CNN to ensure that the final classification probability of samples can be used as the extraction basis. The results of this method are better than those of the traditional fast R-CNN method with a small increase in training time. Drawing on this idea, this study designs a corresponding difficult case extraction network structure for fast R-CNN target detection by replacing the two shared full connection layers and output layers with an original full connection layer and output layer. The structure diagram of the proposed training network for difficult case extraction is shown in Figure 3.

Structure diagram of the proposed training network for difficult case extraction.
The network connection related to the difficult case extraction layer is shown in Figure 4. As shown in Figure 4, the input of the difficult case extraction layer consists of three parts, namely, the sample classification score (CLS_score), the real labels, and the outer weights (out _ weights) of the bounding-box regression. The sample classification score is the classification output result of the deep network to the sample, and the latter two are the input quantities of the network. The weight of the outer layer of the sample label is outputted, and bounding-box regression is conducted after the correction of the difficult sample extraction layer.
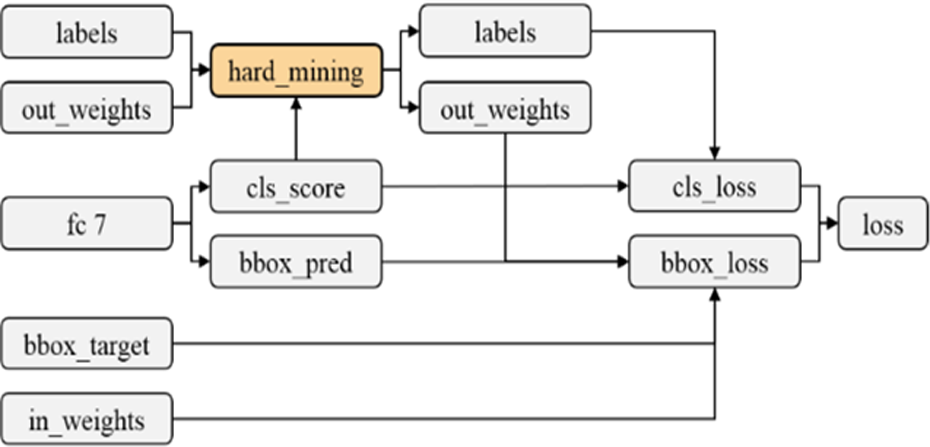
Network connection related to the difficult case extraction layer.
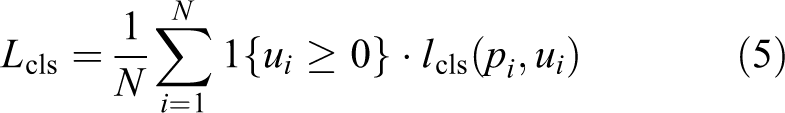
The difficult case extraction layer selects a certain proportion of samples as difficult cases based on the sample-classification scores. These selected difficult cases participate in the calculation of subsequent loss functions and updating of network parameters, and the remaining samples are ignored. Initially, a large number of samples (up to 2000) are randomly selected from each batch of training samples (minibatch) to be inputted into the network. Then, 10% of the samples (up to 200) are extracted from the difficult case extraction layer as the network loss function for the difficult case calculation to correct the network parameters. When selecting difficult samples, at most one-third of positive samples are selected, and the remaining ones are selected based on the sample scores. The label of unselected samples is set to one, the outer weight of bounding-box regression is set to zero, and the ignored samples are not included in calculating the classification loss function (CLS_LOSS) and bounding-box-regression loss function (BBOX_LOSS). The calculation of the classification loss function is shown in the following equation
The calculation of the bounding-box regression loss function is shown in the following equation
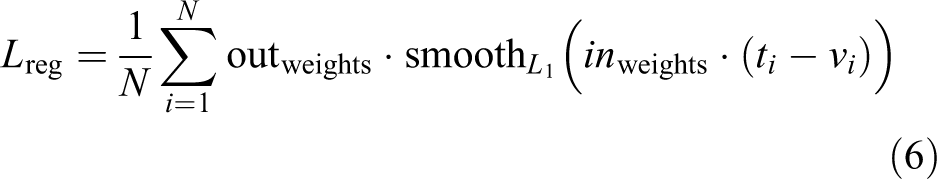
where N represents the number of samples inputted into the network per batch of training samples (minibatch) and is set to 2000;
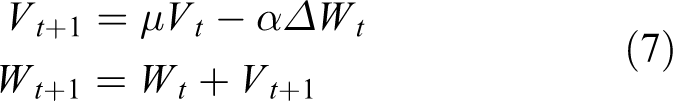
where Wt
and
Multilayer feature fusion network structure
The structure of the multilayer feature fusion network is shown in Figure 5.
Structure of the multilayer feature fusion network.
For VGG 16 networks, we assume that the input image size of the network is 224 × 224, the feature size of the third convolution layer (CONV3-3) is 56 × 56, and the feature size of the fifth convolution layer (CONV5-3) is 14 × 14. To fuse two feature maps of different sizes, the third convolution layer is downsampled to 28 × 28 and the fifth convolution layer is upsampled to 28 × 28 so that the fusion of different feature maps can be realized. The third convolution layer is downsampled by the maximum pooling layer. Conversely, the fifth convolution layer is upsampled.
Considering the different amplitudes of activation values of convolution layers at different depths, linking up the feature maps sampled or reduced in dimensions at different layers results in information suppression or enhancement. Accordingly, the local response normalization operation proposed by Krizhevsky et al. 30 and Gao et al. 31 is used to smooth the activation values between different feature maps. The normalized activation value is shown in the following equation

where
Candidate area selection network structure
To solve the selection of candidate regions, the RPN network structure is designed, as shown in Figure 6. The classification result and regression offset of each target candidate region are used to obtain the candidate regions that may contain targets. The design of the reference bounding box relies on the image input of a single size to extract target candidate regions with different aspect ratios and sizes. Based on the characteristics of pedestrian and cyclist targets, this article designs a reference bounding box with three aspect ratios (1: 1, 2: 1, and 3: 1) and five dimensions (32 × 32, 64 × 64, 128 × 128, 256 × 256, and 512 × 512). According to the set reference bounding-box parameters, 15 reference bounding boxes can be generated for each position in the feature map.

RPN network structure.
The RPN training network includes two symbiotic output layers, one representing the estimated probability pi
of positive samples and the other representing the bounding-box-regression offset ti
. The ith real target category is marked as
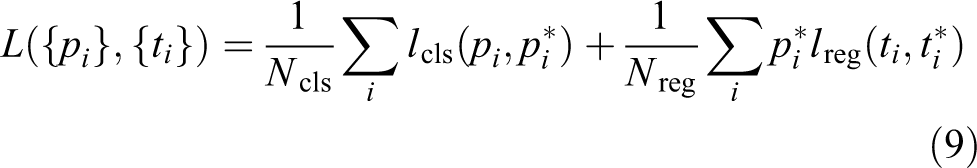
where
Overall network structure
Considering difficult case extraction, multilayer feature fusion, multicandidate region input, RPN, and fast R-CNN convolution layer sharing, we design the overall network architecture for pedestrian and cyclist detection, as shown in Figure 7.

Overall network architecture for pedestrian and cyclist detection.
As shown in Figure 7, the overall network model is obtained through training to achieve effective detection of pedestrian and cyclist targets. The method comprises the following steps: (1) a group of target candidate regions is extracted according to the MIOP, (2) another group of target candidate regions is extracted through RPN, and (3) the two groups of target candidate regions are classified and optimally positioned through fast R-CNN, thereby realizing target detection. The last two steps realize the network parameter sharing of the convolution layer, and the network structure diagram is shown in Figure 8.

Network structure of parameter sharing of the last two steps of the convolution layer.
Experiment and result analysis
Model training
To verify the effect of pedestrian and cyclist target detection network, a large number of network models are trained, and their training network models are shown in Figure 9. “bl” represents the basic network and does not consider any improvement methods, “hm” means considering difficult case extraction, “ml” means considering multilayer feature fusion, “ml-hm” means that both multilayer feature fusion and difficult case extraction are considered, “faster” means faster R-CNN, “final” means the final overall network, “iter” indicates the training period of the network, and “lr” indicates the learning rate of the network. The interconnected upper- and lower-layer network model in Figure 9 shows that the upper-layer network model is trained based on the lower-layer network model.

Training network models.
Experimental results and analysis
To verify the effect of the deep neural network model for pedestrian and cyclist detection, the VRU database was used for experimental verification, and PR curve representation and average accuracy were used for evaluation. As shown in Figures 10 and 11, when counting the test results of pedestrians and cyclists, they are evaluated and verified in the verification sets of different difficulty levels. The influence of interference categories is ignored.

Pedestrian detection results: (a) simple difficulty-level verification set, (b) medium difficulty-level verification set, and (c) high difficulty-level verification set.

Cyclist detection results: (a) simple difficulty-level verification set, (b) medium difficulty-level verification set, and (c) high difficulty-level verification set.
We compare the detection results of pedestrians and cyclists in different basic network models. As shown in Figures 10 and 11, VGG8-bl has better detection effect and shorter average detection time than VGG11-bl and VGG16-bl, but the cyclist’s detection effect is slightly poorer and the average detection time is slightly longer. Thus, VGG8 is selected as the basic network model for verifying the network improvement scheme to clearly and intuitively compare the detection results of different network models on different difficulty-level verification sets, as shown in Figures 10 and 11.
As shown in Figures 10 and 11, the average accuracy of VGG8-final on VGG8-ml-hm, VGG8-final in different difficulty-level verification sets is slightly high, whereas the average accuracy of cyclist detection is basically flat, although the relative VGG8-faster, VGG8-final advantage is obvious. The average accuracies of pedestrian detection for simple, medium, and high difficulty levels were 2.4%, 2.2%, and 4.7%, respectively, and the average accuracies of cyclists were 0.2%, 4.8%, and 5.8%, respectively. Compared with VGG16-ml-hm, VGG16-final, the average accuracy of pedestrian detection in different difficulty-level verification sets, is 1.7%, 4.1%, and 6.6%, and the average accuracy of cyclist detection is basically flat. Experimental results indicate that the VGG8/16-final detection effect is better than using a method alone to achieve the advantages of pedestrian and cyclist detection.
As shown in Figures 10 and 11, the VGG8-final detection effect significantly affects the basic network model VGG8-BL. The average accuracies of pedestrian detection for simple, medium, and high difficulty levels are 7.4%, 8.2%, and 9.7%, respectively, and the average accuracies of cyclist detection are 1.3%, 5.2%, and 6.9%, respectively. The VGG16-final detection effect is significantly improved compared with the basic network model VGG16-BL, especially the pedestrian detection effect, in different difficulty-level verification sets. On the average, the pedestrian detection accuracies were 3.9%, 6.1%, and 6.1%, respectively, and the average rider detection accuracies were 0.1%, 0.7%, and 4%, respectively, for simple, medium, and high difficulty levels. The validity of the proposed network model is further verified. Compared with the overall network model VGG16-final and VGG8-final, the detection effect of VGG16-final is better than VGG8-final, and the average accuracies of pedestrian detection on different difficulty-level verification sets are 1.5%, 2.7%, and 4.3%, respectively. The average accuracies of cyclist detection are 0.2%, 1.5%, and 5.6%, respectively, indicating that a deeper network helps improve the results of final target detection.
Conclusion and future work
In view of the existing deep-learning methods used for pedestrians and cyclists to detect deficiencies, based on the fast R-CNN target detection framework, we focus on the following to design a comprehensive difficult sample extraction method and multilayer feature fusion: pedestrian and cyclist target error detection; frequent, small-size targets; and difficult to detect, changeable, and complex environment background. Many improved network structure models such as multitarget candidate region input greatly improve the detection effect of pedestrian and cyclist targets. In the course of network training, the use of difficult sample extraction instead of random sampling to select negative samples effectively enhances the pedestrian and cyclist target detection effect, thereby reducing the complex driving road environment that causes false detection of pedestrian and cyclist targets. A convolution feature map with different depths can synthesize local and global features, obtain stronger feature information, improve pedestrian and rider target detection effect, and enhance the effect of small-size pedestrian and cyclist targets. By combining the inputs of two target candidate regions to compensate for the defect of the single target candidate region, the complementary advantages of the MIOP and RPN methods are realized. Thus, the detection effects of pedestrian and cyclist targets are further improved, thereby leading to a reduction in missing pedestrians and cyclist targets.
In future work, the pedestrian and cyclist target detection method based on deep learning proposed in this article will be applied to the real environment test of intelligent driven vehicles to improve the target detection rate of pedestrians and cyclists. The utility of the proposed method will be verified.
Footnotes
Declaration of conflicting interests
The author(s) declared no potential conflicts of interest with respect to the research, authorship, and/or publication of this article.
Funding
The author(s) disclosed receipt of the following financial support for the research, authorship, and/or publication of this article: National Key Research and Development Program of China, (Grant / Award Number: ‘2017YFB0102603’).