
Abstract
This article introduces a visual–tactile multimodal grasp data set, aiming to further the research on robotic manipulation. The data set was built by the novel designed dexterous robot hand, the Intel’s Eagle Shoal robot hand (Intel Labs China, Beijing, China). The data set contains 2550 sets data, including tactile, joint, time label, image, and RGB and depth video. With the integration of visual and tactile data, researchers could be able to better understand the grasping process and analyze the deeper grasping issues. In this article, the building process of the data set was introduced, as well as the data set composition. In order to evaluate the quality of data set, the tactile data were analyzed by short-time Fourier transform. The tactile data–based slip detection was realized by long short-term memory and contrasted with visual data. The experiments compared the long short-term memory with the traditional classifiers, and generalization ability on different grasp directions and different objects is implemented. The results have proved that the data set’s value in promoting research on robotic manipulation area showed the effective slip detection and generalization ability of long short-term memory. Further work on visual and tactile data will be devoted to in the future.
Introduction
In recent years, dexterous robotic grasping increasingly attracts worldwide attention. However, realizing a stable grasping is still a big challenge for robots, since it depends on many factors, such as the planner, actuator, sensor, object, environment, and so on.
With the booming of data-driven methods, 1 data are becoming more and more critical. For example, Levine et al. used 14 robots to randomly grasp over 800,000 times and collected grasping data to train convolutional neural network (CNN) that teach robots to grasp. 2 Guo et al. trained a deep neural network with 12,000 labeled images to make robots learn end-to-end image-based grasp planning. 3 Mahler et al. built a data set including millions of point cloud data to train grasp quality CNN (GQ-CNN) with analytic metric and used GQ-CNN to select the best grasp plan which achieves 93% success rate with eight types of known objects. 4 –6 Zhang et al. trained robots to manipulate objects with demonstration videos which are inputted through virtual reality. They have explored the sample complexity of learning a specific manipulation task in their system. The results show that the success rate is significantly influenced by the number of samples. For grasping and placing tasks, the success rate increases from 20% to 80% when the number of samples increases from 11 to 109. 7 Therefore, sufficient high-quality data are the key to unlock the door of dexterous robotic manipulation.
Based on the idea to promote robot manipulation with more data, many data sets have been developed to teach robots how to grasp and understand objects. Playpen data set collects 60 h grasping data of robot PR2 with Kinect cameras (Microsoft). 8 Columbia data set obtains nearly 22,000 grasping samples via the GraspIt! Simulator (Columbia University Robotics Group). 9 Pinto and Gupta instructed robot to automatically generate 50,000 labeled images for grasp planning by self-supervision. 10,11 Besides experiments with robots and numerical simulations, human manipulation videos are also helpful. Robots can learn from videos through self-supervision, which make training samples easier to acquire.
Visual data play a really important role in a grasp task, without sufficient reliable visual input, and robot needs to complete the task with other model data such as tactile. Especially in the case of maintaining a grasp with no slip, only tactile can provide the useful data. Since the tactile data need the contact between the object and the hand, it takes more effort to acquire. There are some data sets that focus on the tactile data which are used for robotic manipulation.
Massachusetts Institute of Technology (MIT) detects the slip with GelSight (a tactile sensor using vision camera) and built a grasp data set with GelSight and external vision data. 12 Compared to some former experiments in which slip was produced with extra force or fix objects, 13,14 there are researchers recording the actual random grasping process with 46% failure results in 1000 times grasp. 15,16 These natural slip data can be of great help to the analysis part, and these real data could contribute to works focusing on precision grasping. 17,18,19
Before building a grasp data set, over-abundance of object types in daily life poses problems to the versatility of data set. Some researchers select some common objects and build 3-D object set models such as Karlsruhe Institute of Technology (KIT) object set 20 and Yale University, Carnegie Mellon University and University of California Berkeley (YCB) object set. 21 These sets help researchers around the world to develop their research with common objects and models.
As mentioned earlier, there are already many grasp data sets in different focus areas, such as grasp planning, robot learning, visual processing, and tactile sensing. However, very few data sets can provide complete data of the whole grasping process, especially with both visual and tactile data. In fact, grasping is a very complex task that needs many different sensor data. Completing and maintaining a stable grasping without visual or tactile sensing is a difficult task, even to human. Sufficient recorded visual, tactile, and position data can assist researchers to understand the grasping process to help the robots to achieve a better grasp. Based on such data set, we can analyze the whole robot grasping process, including the learning grasp from video data, the slip detection with tactile data, and more work based on the combination of visual and tactile data. With the data-driven methods, we can also extract the feature of data and generalize to the similar case with the same data feature, and the model built based on this data set can also be used in more robotic manipulation cases.
According to the previous work, it is necessary to make a trail to build a comprehensive data set for the robot grasping research. We built this new grasp data set with Intel’s Eagle Shoal robot hand. Experiment platform and experiment design are introduced in “Methodology” section. The basic structure of the data set is described in “Data set” section. Data set analysis and testing with short-time Fourier transform (STFT) and long short-term memory (LSTM) are explained in “Data set analysis” section. Conclusion and expectation are shown in “Conclusion” section.
Methodology
In order to build a comprehensive data set, the setup and definition of experiment is critical. The final experiment is defined based on hardware property and requirement of visual–tactile data.
Experiment platform
The experiment platform consists of the Eagle Shoal robot hand, two RealSense SR300 cameras (Intel Corpotation), and the UR5 robot arm (Universal Robots). As shown in Figure 1, all these components are arranged around a table of 600 mm length and 600 mm width. There is a layer of sponge on the top of the table to reduce the effects of the reacting force from the table’s surface. A soft flannel sheet covers the table to avoid the interference of light reflection. The UR5 robot arm stands at the backside of the table and the Eagle Shoal robot hand assembled on it. One RealSense camera is on the opposite side of the UR5 to record the front view of grasping. The other RealSense camera locates in the left of the table to record the lateral view.
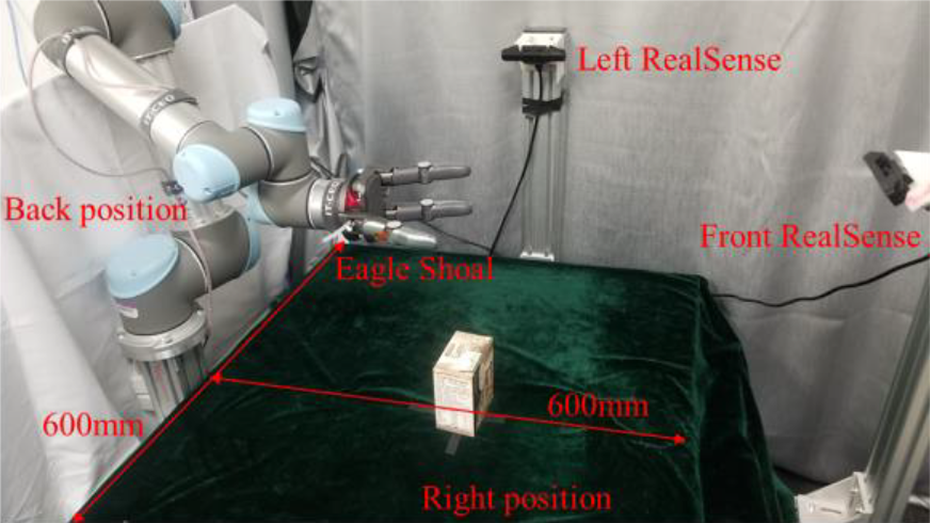
Visual–tactile data set collection platform.
The Eagle Shoal robot hand consists of three fully actuated fingers and one fully actuated palm, totaling eight degrees of freedom. There are four tactile sensors embedded in each finger and palm, and the total number is 16. The position of tactile sensors (red number) and position sensor (same as the motor number) are shown in Figure 2. The tactile sensor is based on piezoresistive mechanism; it can sense the normal force added on sensor. The tactile value unit sets with mN. The hand can send sensor data through controller area network (CAN) bus with the rate of 40 Hz. The main parameters of the robot hand are shown in Table 1.

The Eagle Shoal robot hand structure.
Parameters of robot hand.
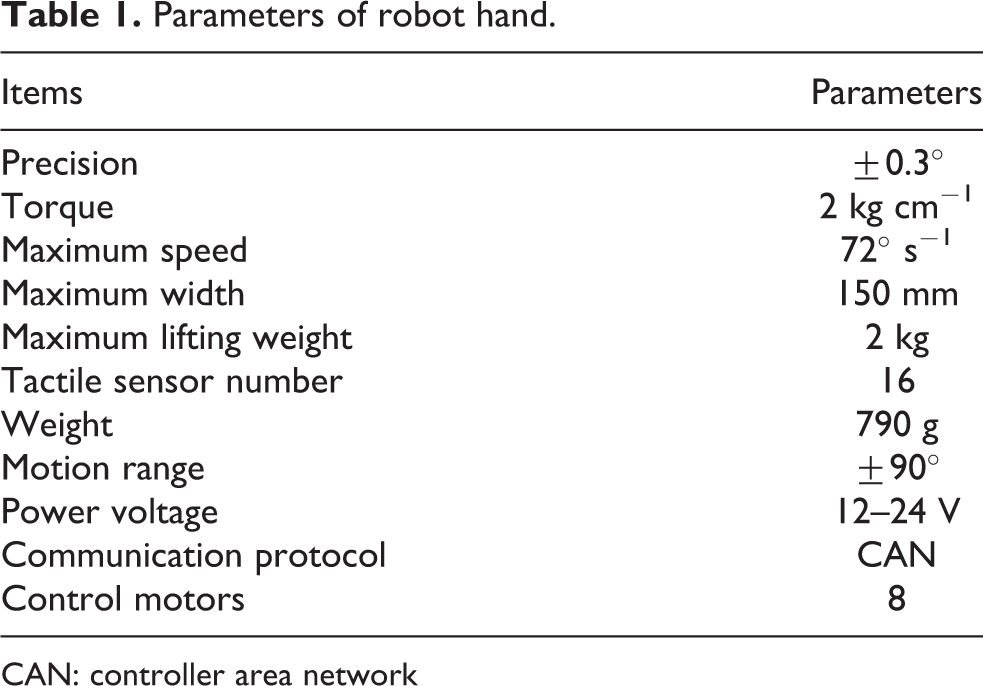
CAN: controller area network
Two RGBD cameras were used to record from two vertical directions. However, the RGBD cameras use structure light to get depth data, and there is interference between two cameras. We block lateral camera’s structure light projector with opaque material and record front camera’s depth video and two camera’s RGB video. The software environment is Ubuntu 14.04 and ROS indigo, which consists of three parts including vision, data recording, and task schedule.
The transformation matrix between the coordinates of RealSense and UR5 base is calculated by least squares algorithm. The RGB and depth video resolution and frequency have been set to 640 × 480 and 18 Hz. During the experiment, the point cloud was used to segment the target object and calculate the plane position and object height for grasping task.
The recording part automatically records data from camera and robot hand. The main program controls the experiment procedure and sends the control command. The UR5 arm is controlled via the socket.
Experiment design
With the aim of promoting more diversities robotic manipulation research, we built the comprehensive data set with many factors, including shape, size, weight, grasp gesture, and so on. The objects in the data set contain different sizes of cuboid, cylinder, and special shapes, with the ability to change the weights by adding granules or water. Different grasping methods defined by grasping from three directions, including back, right, and top. We generate slip data with adding weight, changing grasp force, and adjusting grasp position.
Upon the abovementioned conditions, the process of the experiment is described in Figure 3. Put the object in the table center and use the front camera to get the point cloud data. Filter, segment, and calculate target object position with point cloud. Add a random error of ±5 mm to object’s half height center position to generate a random grasp point and control the robot arm to approach the grasp point. Based on the object size, control the robot hand to a pre grasp gesture with position loop mode, and then change to the current loop mode to grasp with certain current. Wait 1 s to guarantee the state that is stable; then, the arm lifts the object with speed of 20 mm s−1. After the robot arm lifted to a certain position, judge the grasp state based on each finger’s position change. If the finger joint angle difference exceeds threshold during lifting, it means object dropped during this process, label this grasp as failure, otherwise label as success. If the label is failure, open the hand directly and prepare next grasp. If the label is success, for a light object, put down the object and open hand; for heavy or easy slip object, open the hand and drop it directly. Place the object back to the table center, control the robot arm return to the initial place, and wait for the next loop.

Grasping experiment pipeline.
During the experiment, we found that sometimes the fingers touch the object but can’t get obvious sensor values. It is caused by object’s soft surface and tactile sensor’s structure. In order to observe obvious value change during the grasp process, we set the grasping gesture to guarantee that the grasp is completed by the tip of three fingers (position of sensor 3, 7, and 11). Besides, for those objects with easy accessible sensor feedback with grip gesture like the cylinder, we didn’t use the fingertip to grasp.
Data set
We chose 10 different objects to build the grasp data set, which can be seen in Figure 4. With nearly 3000 rounds test flow, we finally get a data set consisting of 2550 sets valid data which includes visual and tactile data. The data set can be checked in https://github.com/bravebin/Visual-Tactile_Dataset.

Objects in data set.
Data set structure
The composition of data set in Table 2 shows two parts data of empty and non-empty cases, respectively. Success and failure data are both important for learning grasp, and we built this data set with both data. The number of the success and failure test number in different objects is shown in Figure 5. The total success rate of 2550 sets data is 66.27%.
Data set statistics.


Success and failure data in data set.
In the empty data set, there are text (T1) and image (I) data. The T1 data include two different types: tactile sequence and label document. The tactile data contain 16 channel tactile sensors for 400 steps within 24 s. The label document records time labels of different grasp statues and the final label for each grasp, success or failure. The image data contain four images for each grasp, which includes two time steps recorded from each of the two cameras.
The non-empty set contains position sequence (T2) data and video (V) data in addition to similar data in the empty set. The position sequence data consist of the eight motor position for 400 steps within 24 s; the video data include two RGB videos and one depth video for one-time grasp.
Raw data
Due to different gestures have big influence on tactile data, we plotted two sets of tactile data with relevant time labels in Figures 6 and 7. The horizontal axis is time(s); the vertical axis is tactile value (mN); the acquiring rate of tactile data is 16.7 Hz.

Visualization of raw tactile data (Cola 150-26 right-8 tactile).

Visualization of raw tactile data (Scrub 150-866 top-5 tactile).
As shown in Figure 6, there is one set of the 900 tests without video, and all of these data are success data; three time steps are labeled to represent the time sent position loop, current loop, and lifting command. There have obvious changes around each labeled step. After several steps of green position loop line, the hand gradually touches the object and the tactile value starts to increase. The object may have some position changing and causing the tactile value to have a corresponding change as sensor 10. After the yellow current loop line, the hand changes into current loop mode, where tactile value increases and then turns stable. After the red lifting line, the tactile value starts to change again, some rapid such as sensor 9. After several seconds, the arm moves down and the hand opens, resulting in the sudden drop of tactile value. If part of object has touched plane earlier during object moving down, there may be some tactile data change as sensor 2. For some heavy objects that have unstable state, we open hand directly in the highest position.
Figure 7 shows one example of the 1650 sets with video, a failure case in which an object was dropped during the lifting process. Compared with Figure 6, the labeled time step has a difference that the red line representing the object has been lifted to the highest position. The obvious change in sensor 3 around 7 s between the yellow line and red line represents the time start to lifting the object.
As a comparison between these two figures indicates, the tactile data show obvious changes in each key time step and it means that the tactile data are helpful for the analysis of grasping.
During the grasping process, the joint position of the robot hand helps to analyze the grasp status. Figure 8 shows the position change within 24 s, the position sensor of eight channels is shown in Figure 2, and the data are extracted from the same test in Figure 7. After the position loop line, each joint changes its angle rapidly and reaches stable after several steps; with the current loop line, joints 1 and 3 have little position change before new force balance; during the time between the current loop and highest position, the object dropped around 7 s, the hand gradually closed with current loop, and this situation can correspond to the force change in Figure 7. Contrasting with the joint position data, we can easily find the status of the robot hand in each time step, and it can do a great help to check the status of grasping.

Visualization of the position data (Scrub 150-866 top-5 tactile).
The image data contain two different directions and two different time steps, one is the time start test and the other one is the time send the current loop command. The images show the relative positional relationship of robot hand and object, and the sample image is shown in Figure 9.

Image captured by two cameras (Scrub 150-866 top-5 tactile).
The video includes two RGB and one depth video, and the depth video can help to reconstruct the scenery with the model of the target object, robot arm, and robot hand; part of video data can be seen in Figure 10. From the first row to the third row are the video screenshots of left, front, and front depth video. The video recording starts since the test begins. Because the depth image format is CV 16UC1 and the video format is 8 bit and three channels, we saved the high 8-bit data in the red channel and low 8-bit data in the blue channel. To make the video clearer, we also added middle 8 bit into the green channel.

Several frames in video (Scrub 150-866 top-5 tactile).
With the combination of tactile, label, position, image, and video data, these data can be of great help to analyzing the grasping process: The tactile data can be used in the analysis of slip detection or object classification; the visual data can be used to teach the robot learn to grasp; the combination of tactile and position data can be used to analyze the micro movement during grasp; the combination of visual and tactile data can be used to learn and maintain a stable grasp; and so on. These data set have provided comprehensive data that during a grasp process, researchers can combine the advantages of different data to finish the task related to the robotic manipulation.
Data set analysis
With the multimodal data we have collected, we also need to test and verify the quality of these data. For the visual data part, we fixed the view of camera to guarantee the quality and content of video, and it is easy to judge whether the video data are completed and useful. For the tactile data, it is not easy to judge whether it can be used in the manipulation-related analysis. It is necessary to analyze tactile data and show more details.
Fourier analysis
Vibration is part of the main features of slip and we check in our data set to confirm the data quality. We used STFT 22 to analyze the frequency and choose the following two set results to show. The frequency spectrum of the fingertip’s tactile data is shown in Figure 11. The left and right are two different grasp tests. Three rows represent three tactile sensor data of channels 3, 7, and 11, respectively.

Process tactile data with STFT (Scrub 150-866 top-5 tactile and Latte 150-325 right-0 tactile). STFT: short-time Fourier transform.
The basic frequency is strong when grasping is stable, while energy is transferred to higher harmonics when grasping is unstable. Additionally, we can find the main frequency of vibration lower than 5 Hz when the slip occurs. However, the spectral distribution varies across specific objects, so it is difficult to make an accurate detection based on vibration.
Slide detection with LSTM
Slip detection is a main usage of grasp data and we also tested with our data set. In consideration of time sequence characteristic of tactile data and the feature of slip, we chose the LSTM 23 algorithm based on its eminent generalization ability.
LSTM is a special kind of recurrent neural network 24 which have the capable of learning long-term dependencies. 25 The LSTM output result with the combination of current and previous inputs and the data input LSTM can have long-term influence on the output. In the slip detection case, we take time sequence as the input to predict the future state of grasp. The structure of LSTM is shown in Figure 12. We built the LSTM model with Tensorflow, 27 selected the basic LSTM cell, and set 128 as the unit number.
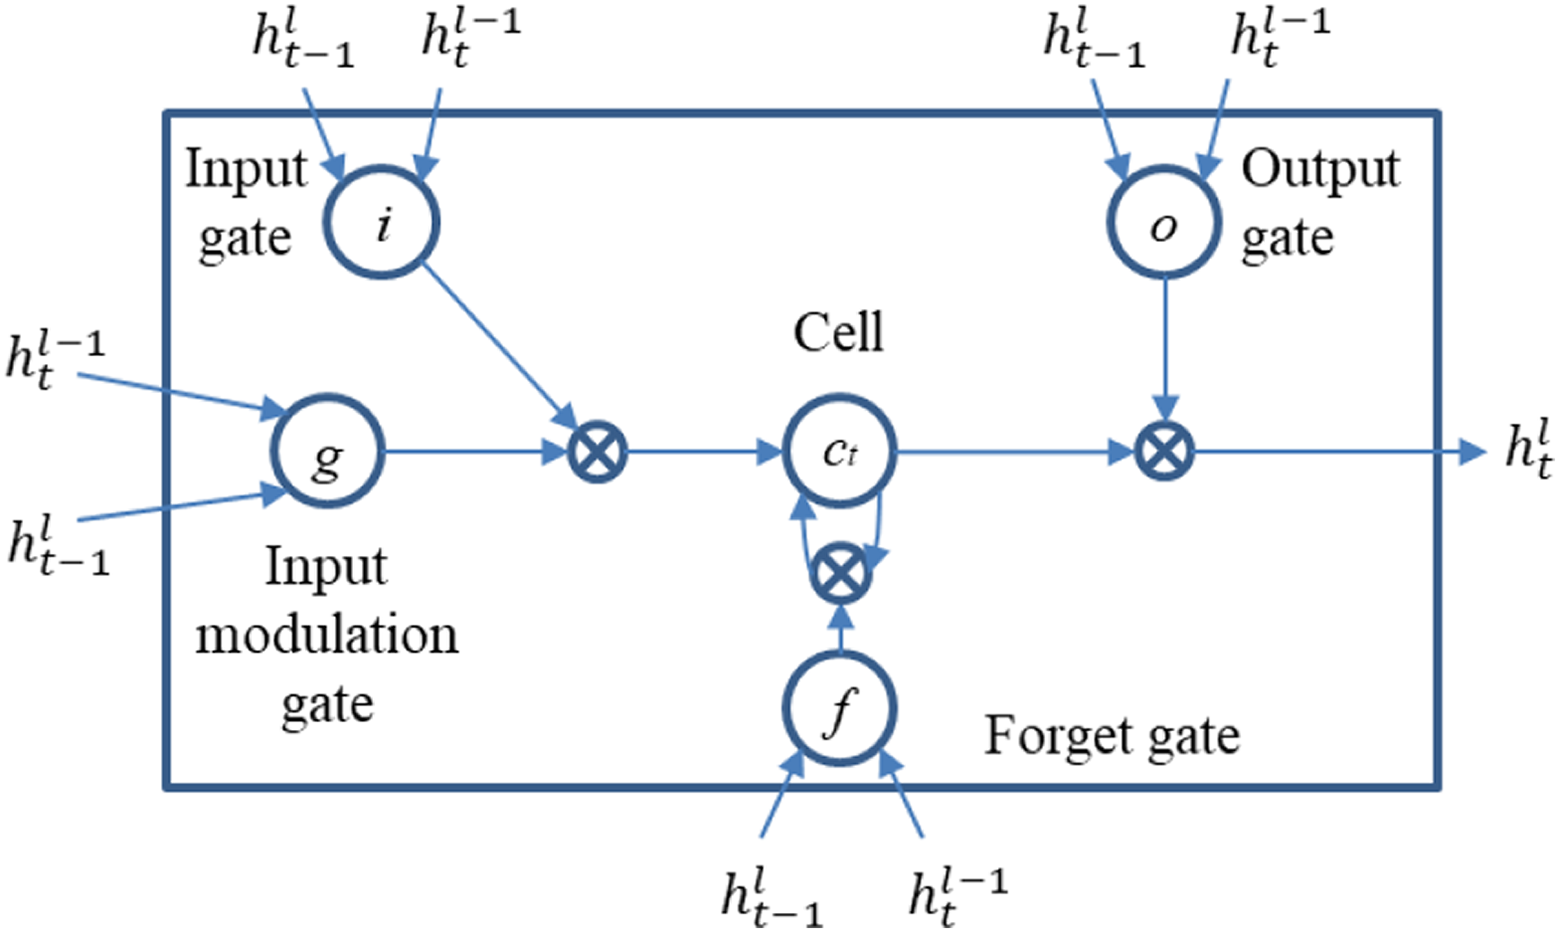
Structure of the LSTM model. 26 LSTM: long short-term memory.
We treated slip detection as a two-type classification problem, produced output with softmax, initialized the model with zeros, used cross-entropy as the loss function, and set Adam optimizer 28 with a learning rate of 0.0006 during the training.
Since the tactile sensors can only sense force in the normal direction, the tactile value in each sensor may show significant differences even when the grasp state is stable. Normalize the tactile data in each tactile sensor channel individually is a better method which can help to converge faster. In order to detect the slip when the tactile changes in short period of 1 s, we input 20 steps (1.2 s) data to get prediction result.
Because the slip time is difficult to figure out even with reference to the video data, we made use of an easier label method of time step: labeling the drop time. The drop label can be easily judged by the state with no force input. Due to the noise of each tactile sensor, we set a limitation of 100 mN to filter the noise and got a result that can label the data at the position when the object drops. Although drop label is different with slip label, the slip must occur before the drop. We assume the slip occurred during the time between drop and 1.2 s early and set the label with 20 steps earlier than drop label in the input data.
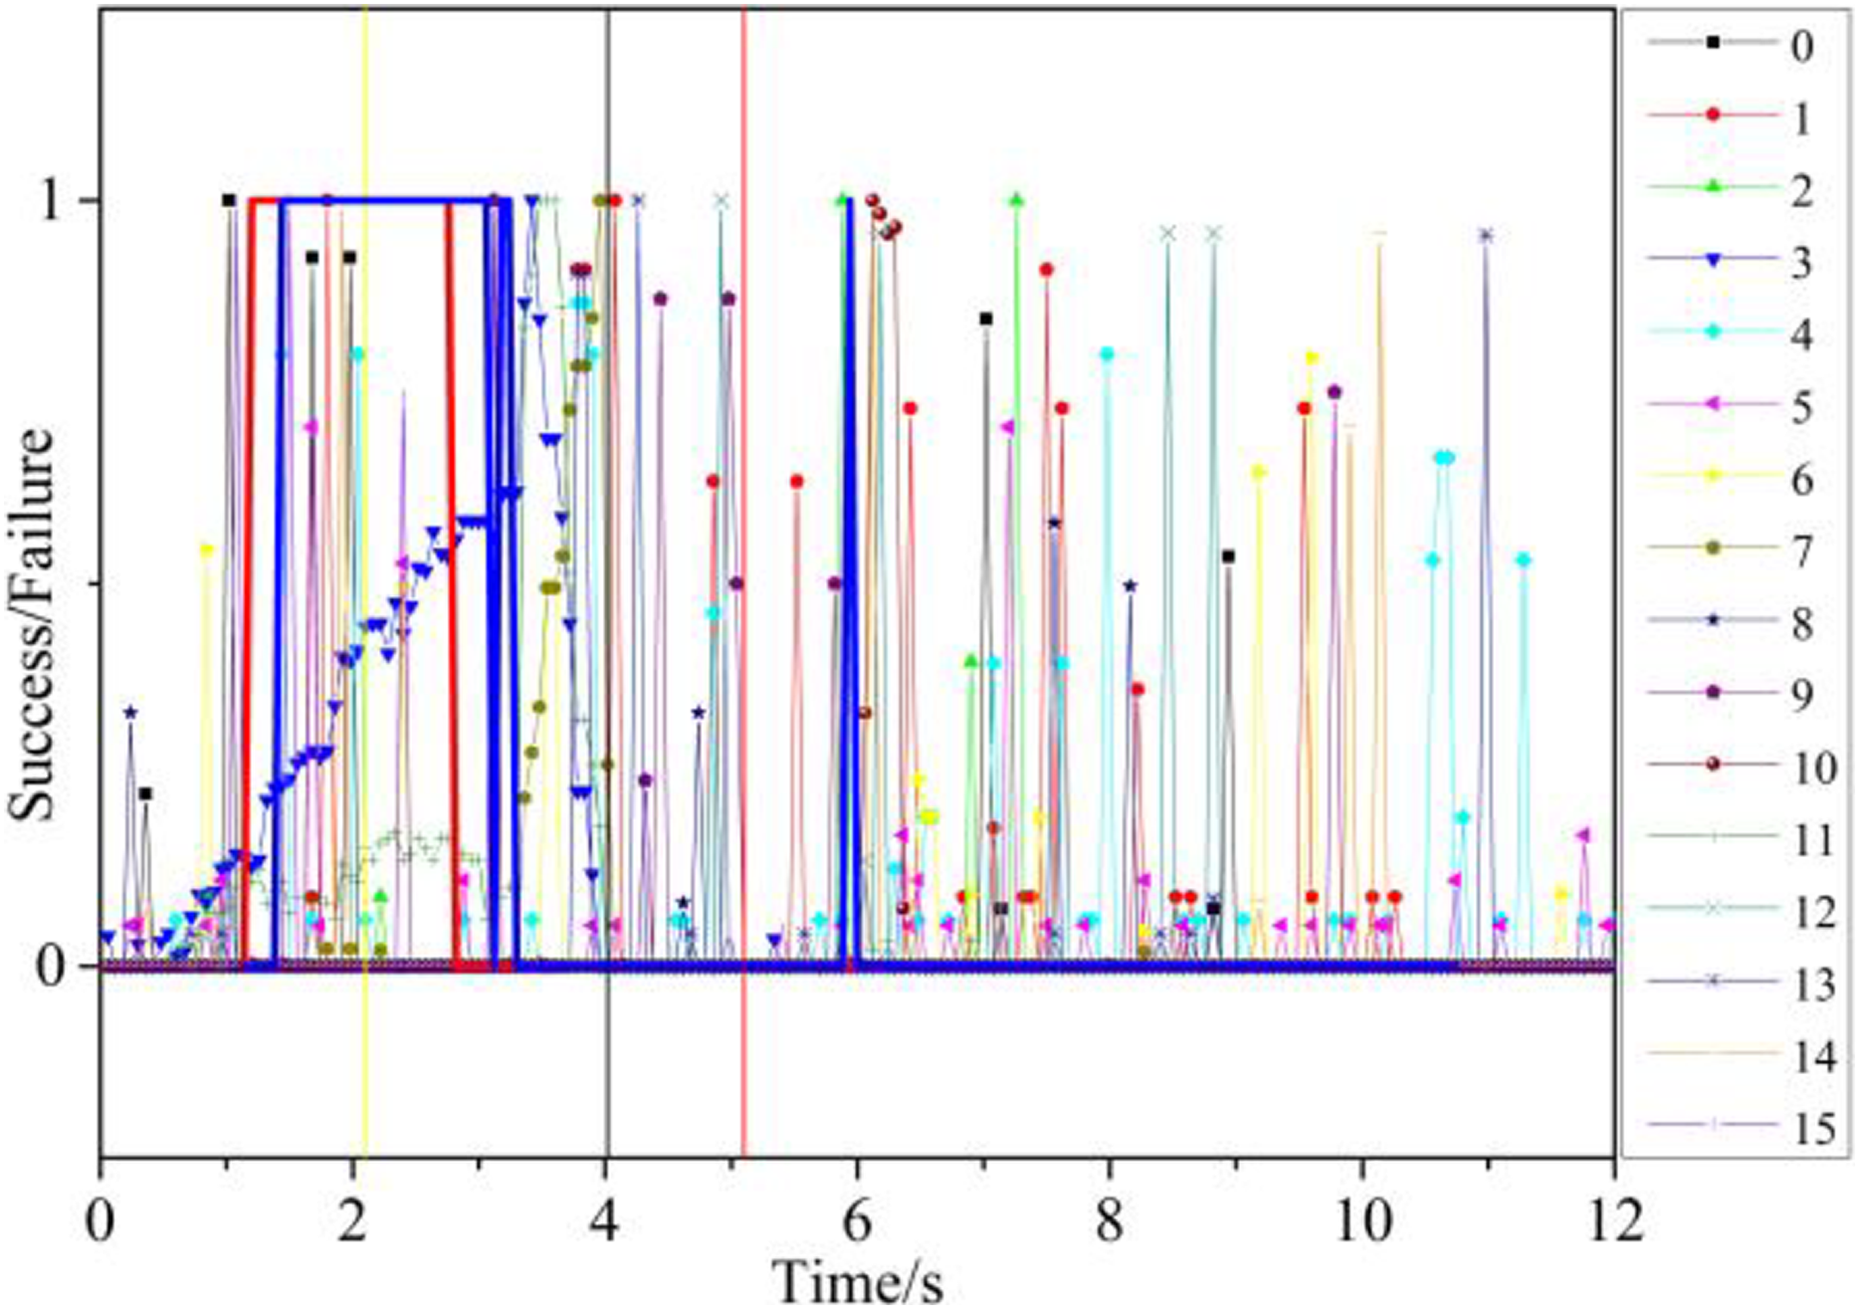
Due to a significant influence of direction on the grasping gesture, we divided the data with three directions, trained with 80% of data in each group, and tested the model in the rest 20%. One result of right direction data is shown in Figure 13: The blue line represents the predicted result, the red line represents the label data, the yellow time label represents the current loop, the red time label represents stop on the highest position, and the black time label represents drop from hand. The blue line drops at three periods, including the vibration between 3.3 s and 4.3 s, one time between 7.6 s and 8.5 s, and one time at 9.0 s nearby the hand open time.

LSTM predicts result and corresponding frames of the video (Latte 150-325 right-0 tactile). LSTM: long short-term memory.
Contrast with the video data, it is easily observable that there really have a slip occurred during the time lifting the object to the highest position, a slip when the hand put down the object, and a slip when the hand open. The position change is shown in the video screenshot in Figure 13, the video screenshots start from the position loop and end with open hand, and we add several time steps around two slip time steps.
According to the test result from the right direction data, we can detect the slip from an apparent position change. LSTM exhibits an excellent ability in the detection of slip; it finds the feature of slip and can detect the slip motion during the grasping process, especially it gives the detection result ahead of the drop label.
On the other hand, because this problem was treated as a classification problem, we contrasted the result with traditional classifier that includes k-nearest neighbor (KNN), 29 support vector machine (SVM), 30 and Naïve Bayes (NB) 31 ; 2550 sets data have been divided into 80% train set and 20% test set. We set the KNN classifier with k = 3 and choose the SVM kernel with radial basis function. Using success rate as a criterion to contrast different algorithms, we counted the number n that detect and label data have the same result and combine with the number of label data m, and the success rate was calculated by n/m.
As the contrast result given in Table 3, LSTM and SVM both perform well with success rate. However, upon detail examination, we found that many results of SVM label on the falling edge, which means the SVM model gets a good classification result by learning the falling edge feature. However, the falling edge means the object drops already and can’t help to realize a stable grasp. SVM proves unsuitable for this test and also raises a question on the judging criterion. Besides the success rate, another criterion is necessary to evaluate the slip detecting result.
Classification results of different classifiers.
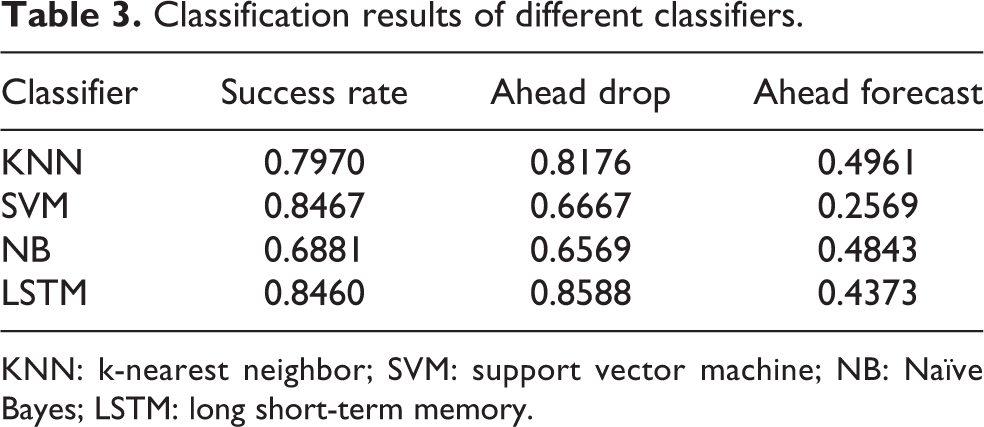
KNN: k-nearest neighbor; SVM: support vector machine; NB: Naïve Bayes; LSTM: long short-term memory.
We propose the ahead rate criterion. If the predict result turns from 1 to 0 is ahead of the time in label data, set it as ahead sample and counted number n ahead, calculated the ahead rate by n ahead/m and set it as the criterion. Ahead drop time and ahead forecast (20 steps early than drop time) results are presented in Table 3. With these two criteria, we can have a clearer understanding of these algorithms, in which LSTM shows the best result: a higher success rate and higher ahead rate.
Besides the basic detection ability, the generalization ability of LSTM is also required to test. Therefore, we divided the generalization ability into two sides, that is, different directions and different objects. The contrast of success rate is given in Tables 4 and 5. Two typical detection results are shown in Figures 14 and 15.
Results of different directions.

Results of different objects.


Result of LSTM generalization in different directions (Cola 100-657 right-9 tactile). LSTM: long short-term memory.
Result of LSTM generalization in different objects (Latte 50-620 right-3 tactile). LSTM: long short-term memory.
For the generalization in different directions, set one or two directions’ set as self-set, take 80% of self-set as the train set, and test the trained model on other direction sets and the rest 20% self-set separately. From Table 4, there was a light decrease when tested on different test set, especially for the top set, where the success rate decreased considerably when it was tested on the right set. In the top set, the robot hand only grasps the object with three fingertips. In cases that the hand grasps the object with more fingers, the model only learnt to detect based on three tip channels and failed to detect slip based on other channels’ input. The result shown in Figure 14 is the worst case where the output is always 0, mainly because the channels 3, 7, and 11 used in top grasp do not have an obvious value in the right grasp case.
In order to test the generalization ability in different objects, we removed target object set and called it self-set, set 80% of self-set as the train set, test the result with target object set and the rest 20% self-set separately. Table 5 gives a good result of the generalization, displaying only a bit decrease on the success rate. The reason is that there are some similar objects in the train set, which assisted in the generalization to similar objects. The result in Figure 15 shows the detection result change to 0 several steps before the object drop.
Based on our contrast of different directions and objects, it is easy to find that the deciding factor in the generalization ability is not the value. Instead, it is the tactile channel influenced by grasp gesture; it means that the positions of finger touched with object have a significant influence. We can improve the generalization ability with a more complex data set including enough grasp gesture and training model excluding position difference which can be used in all cases with tactile input.
Conclusion
This article aims to build and introduce the grasp data set built by Intel’s Eagle Shoal robot hand. With these data, a user can understand the whole process of grasping objects. In order to evaluate the quality of data set, we analyzed the tactile data with STFT and detected slip with LSTM. Contrasting detection result with video data, LSTM finds the corresponding slip during lifting and lowering processes. The LSTM also shows better detection ability in the contrast of KNN, SVM, and NB with the criteria of success rate and ahead rate. The detection result ahead of dropping time means that the trained model can be used in the grasping process. We also study the generalization ability of the LSTM model: Grasp gestures that influence the position of finger touched with object have a significant influence on the judgment of slip. Thus, better generalization ability needs to be improved with enough data and decreased influence of the position difference. Based on this data set, researchers can test the algorithm based on tactile and visual data and generalize to more manipulation cases.
Based on the analysis, the data set proves effective in furthering the research on robotic manipulation. We will continue to focus on the data set, including several directions: analyze the tactile data with more details, focusing on algorithms with good generalization ability of slip detection in the real-time grasping task; make better use of video data and combine the video data with tactile data to predict the slip process; and learn from this data set and prepare to build a more comprehensive data set.
Footnotes
Declaration of conflicting interests
The author(s) declared no potential conflicts of interest with respect to the research, authorship, and/or publication of this article.
Funding
The author(s) disclosed receipt of the following financial support for the research, authorship, and/or publication of this article: This work was supported by Intel Corporation (10.13039/100002418), the National Science Foundation of China (NSFC) and the German Research Foundation (DFG) in project Cross Modal Learning, NSFC 61621136008/DFG TRR-169, and in part funded by the Beijing Science and Technology program under Grant No. Z171100000817007 and the National Natural Science Foundation of U1613212.