
Abstract
This article proposes a motion detection method for real-time video analysis. It is the fundamental principle that the parts of the moving objects and the local changes of the images captured by static cameras are strongly correlated. Peak signal-to-noise ratio calculated in a block can characterize the significance of the changes in this area. Moving objects can therefore be detected by thresholding the peak signal-to-noise ratio of the blocks between two adjacent frames. The block-wise scheme used in this frame difference method can explore the local correlation of the movement in both space and time domains. This approach is robust to analyze the video images with noise and high variance caused by environmental changes, such as illuminations changes. Compared with other methods, the proposed method can achieve relatively high detection accuracy with less computation time, where real-time motion detection is available. Experimental results show that the proposed method cost averagely 50% of the running time of ViBe with 3.5% increase of the F-score on detection accuracy.
Introduction
Detection of moving objects from video sequences is a widely studied topic in computer vision. Motion detection is crucial for video surveillance and monitoring (VSAM) systems which involve complex tasks such as object detection, recognition, tracking, and behavior analysis. The detected motion areas reduce the searching space for object detection and tracking.
Motion detection extracts motion areas by analyzing video sequences in spatial and/or temporal domain. In the past few decades, various motion detection methods have been proposed. The most popular detection methods can be divided into three groups. 1 One is based on optical flow analysis, one is based on background subtraction, and the other is based on frame difference.
Optical flow method 2,3 extracts moving objects by identifying motion flow fields. Even in scenes with camera jitters, moving objects can be detected by the optical flow method. It is, however, too computationally expensive that moving objects can hardly be detected in real time. And this method is sensitive to noise. Background subtraction method (referred as BGS) 4 –7 detects moving objects as pixels which do not follow the background model. The background model is initialized using frames only containing static background and updated using statistic learning algorithms. Compared with the optical flow method, BGS consumes less time. However, BGS is still time inefficient due to the maintenance of the background model. When an object initially treated as a part of the background starts to move, this object may be detected by the background subtraction algorithms making a hole left behind in the background (which is referred as ghost effect). 8 False alerts will increase until the model adapted to the new background. BGS is also strongly affected by the background changes in dynamic environments (such as waving trees and illumination changes). 6,7 Frame difference method 1,9 identifies moving objects by thresholding the difference between two adjacent frames. It is not sensitive to illumination changes and can work in real time without maintaining complex models. Traditional frame difference method designed in pixel-wise can only extract the contours of the moving objects leaving the internal area unidentified. Pixel-wise method (such as the abovementioned optical flow, BGS, and traditional frame difference) is sensitive to noise. On the other hand, the block-wise method proposed by Heikkila and Pietikainen 10 improves the robustness of motion detection under noise.
To achieve real-time motion detection in video sequence, we propose a block-wise frame difference method. As a frame difference approach, the proposed method can be time efficient. With block-wise scheme, the internal area missing problem in traditional frame difference method can be properly fixed. It was found in the experiments that the peak signal-to-noise ratio (PSNR) in a block (referred as PSNRblock) calculated between two adjacent frames has strong correlation with the movement of the objects within the block. Whether there is a moving object in a block can be determined by its PSNRblock level. The proposed block-wise frame difference method advances the state-of-the-art in three aspects. It provides a simple yet effective way using PSNRblock to detect moving objects in real-time with static cameras. It can effectively handle the internal area missing problem which frequently occurs in the traditional frame difference method. The implementation of the proposed method is not complex, which can be easily transferred to hardware and integrated in real-time VSAM system.
Related work
Optical flow
With a constant brightness assumption, Horn and Schunck derived the famous optical flow equation. 2 Given the optical flow equation an ill-posed one, prior knowledge about other constraints is needed for the solution. 11 Assuming a global smoothness, Horn and Schunck 2 proposed a dense optical flow method. These global methods yield flow fields with 100% density, but are sensitive to noise. 12 On the contrary, with local smoothness assumptions, Lucas and Kanade 3 proposed a sparse optical flow method. These local methods are relatively high robustness under noise but cannot give dense flow fields. 12 In scenes with small (may be within one pixel) camera jitters, the optical flow can still detect moving objects. Optical flow estimation in large displacement domain is recently widely discussed. 13 Due to high computation cost, it is hard to apply the optical flow method to the VSAM applications with high demands in real-time performance. A surveillance system based on motion vector estimation is proposed by Hossen and Tuli. 14 Optical flow method and Horn Schunck algorithm are used for its reasonable performance and simplicity. In addition, some fusion frameworks and algorithms can provide effective acceleration for object detection. 15,16
Background subtraction
The moving objects can be extracted by image subtraction between the current video frame and a reference image known as background. Background model is the key to BGS.
Background model can be estimated through parametric or nonparametric approach. For parametric approach, Wren et al. 4 proposed a person finder (Pfinder) with single Gaussian model (SGM). Pfinder reports good results in indoor scenes with an initialization period when the room is empty. The performance of SGM is improved by Koller et al. 17 For the modeling of the outdoor scenes with high variance, such as fluctuations in the lake, leaves shaking, and the illumination changes, SGM is not suitable. As an improvement, Gaussian mixture model (GMM, proposed by Friedman and Russell 5 ) has been used to describe the complex background with enhanced detection performance. 18 –20 However, GMM is usually assumed to have a fixed number of components. The number of components varies in different scenes. Moreover, it is not easy to be estimated. For that purpose, Zivkovic and Heijden 21 proposed an iterative algorithm which can estimate both the model parameters and the number of the mixture components. Improvement of motion detection accuracy was observed by the modified GMM. 6 However, its time and space cost are considerable, as shown in Table 1. Nevertheless, the distributions of objects are still hard for parametric model to describe, even with proper assumption. On the other hand, nonparametric approaches have been found more suitable to handle the detection task in complex environments. Elgammal et al. 7 proposed a method based on the kernel density (KDE) method. The performance of KDE is further improved by Elgammal et al. 22 KDE is able to model a distribution exactly, but suffers from high computation cost and memory storage. Piccardi and Jan 23 used MeanShift algorithm to find the distribution mode. Equivalent accuracy can be achieved by the MeanShift-based method with lower computation cost. More advanced method has been proposed by Han et al. 8 known as sequential kernel density approximation (SKDE), which updates the parameters and the number of the model modes. For estimating the distributions of the background, BGS mentioned above uses the previous frames in a first-in-first-out (FIFO) way. In such an FIFO-like sampling updating way, BGS suffers from ghosts effects resulting in the increase of false alerts. Barnich and Droogenbroeck 24 proposed a random scheme to update the background model, achieving relatively high motion detection accuracy. 25 Background modeling method was systematically summarized by Piccardi 26 and Hofelin and Heidemann. 27 In order to reduce dependence on stable background, Dewan and Kumar 28 first compute the color difference histogram (CDH) in a locally existing small neighborhood and then employ fuzzy c-means clustering to obtain fuzzy CDH. It works robustly in complex environments.
The complexity of various motion detection algorithms.a

PSNR: peak signal-to-noise ratio; BGS: background subtraction; SGM: single Gaussian model; GMM: Gaussian mixture model; KDE: kernel density; SKDE: sequential kernel density approximation.
a M and N are the height and width of the image, respectively, K is the number of components, L is the number of samples, W is the size of the time window, and H is the number of histogram bin.
*The time complexity of the proposed method without any optimizations is O(M × N × (B/STEP)2). Using the integral image to calculate the PSNR, the time complexity of the proposed method is O(M × N). B and STEP are defined in “PSNR calculation and thresholding” section.
In comparison with optical flow, BGS is relatively computational efficient. However, it is still time inefficient due to the maintaining of the background model. Most of the BGS are sensitive to dynamic scene changes. 29 Frame difference method as described in the following using only two adjacent video frames can properly settle this problem.
Frame difference
Frame difference detects moving objects by examining the difference of two adjacent frames. After thresholding the difference image, the motion areas are extracted. 9 Unfortunately, pixels within the overlapping area of the moving object between the two frames are usually not to be extracted, which leads to results with discontinuous contours of the objects. To get connected motion components, postprocess (such as morphological filtering) is usually followed, which may decrease the real-time performance. To mitigate these problems, Dubuisson and Jain 1 used a scheme considering the complement of two difference images generated by three adjacent frames.
However, most of the abovementioned motion detection methods including optical flow, BGS, and frame difference are pixel-wise approach which is sensitive to noise. On the other hand, the block-wise method proposed by Heikkila and Pietikainen 10 can improve the robustness of motion detection with certain level of noise. To achieve both accurate and robust detection results, Shi et al. 30 use an improved Canny edge detection and adaptive frame difference method.
Methodology
Our method is based on the PSNR calculated in blocks (PSNRblock). In this section, the relationship of PSNRblock and movement will be introduced first. General description of the proposed method (referred as PSNRDet) will be given in the following subsection. In rest of this section, each component of PSNRDet will be presented in detail.
The relationship of PSNR and movement
According to the concept of frame difference method, the movement in video sequences can be “seen” by the difference between the values of pixels at the same position from two adjacent images captured in time t − 1 and time t. If the object moves, it is most likely that, in time t, the values of the pixels belonging to the same object in time t − 1 would change simultaneously. It is natural to consider the movement of an object in a block-wise way instead of a pixel-wise way. To measure the difference between two adjacent images in a block, the mean square error (MSE) comes out to be a good indicator. For the same purpose, PSNR is also widely used to indicate the image difference in applications like image compression 31 and the image/video stabilization field. 32 –34
By using the PSNR calculated from two adjacent images in a block, the difference between the image blocks with moving objects and static background could be told for a video sequence captured by stable cameras, as shown in Figure 1. The formula of PSNRblock calculated in block(u, v) in time t can be given as follows

where block(u, v) is a block whose left-up coordinates are (u, v), u is the coordinate in the x-axis, v is the coordinate in the y-axis. I MAX is the maximum intensity value. I MAX = 2bit − 1, where bit is the number of binary bits representing the value of a pixel in digital images. For 8-bit digital image, I MAX =24 − 1 = 255. MSEblock(u, v)(t) is defined as follows

where I block(u, v)(i, j, c, t − 1) and I block(u, v)(i, j, c, t) are the values of pixel (i, j) in color channel c in block(u, v). They are captured at time t and time t − 1 respectively. B is the size of block(u, v). C is the number of the color channels. For gray scale images, C = 1. For color images, C = 3.

PSNR for the homemade video StableCameraDemo (frames 2 to 201) in the block(546, 315) with the size of 20 × 20. The red circle indicates that there are moving objects in this block, while the blue triangle indicates that there is no moving object. The contents in this block at frames #26, #35, #155, and #165 are demonstrated. PSNR: peak signal-to-noise ratio.
The larger the difference between the image It and It − 1, the higher MSE is and the lower PSNR is, and vice versa. When there is no moving object, the PSNRblock is relatively high, as shown in Figure 1, approximately 40. The PSNRblock will keep fluctuating around this value until moving objects appear in this block, and the PSNRblock goes down sharply. When moving objects run out of this block, the PSNRblock goes up and floats around a specific value such as 40, as shown in Figure 1.
Empirical distribution of PSNR in blocks
In order to explain the distribution properties of PSNR in image blocks, some definitions are given first as follows. An image patch captured in block(u, v) in time t is marked as I block(u, v)(t). A block sequence SeqI block(u, v) is defined by a series of I block(u, v)s. PSNRs calculated from SeqI block(u, v) constitute a PSNR sequence SeqPSNRblock(u, v). The distributions of SeqPSNRblock(u, v) vary mainly due to the illumination variation and object motion in SeqI block(u, v). There are mainly two types of SeqI block(u, v): (i) the static sequence (which only contains illumination variation) marked as SeqBGI and (ii) the dynamic sequence (which is with moving objects) marked as SeqMOI. To identify the moving objects from the video sequences by thresholding SeqPSNRblock(u, v), studies of the PSNR distribution of these two sequence types in different video surveillance scenarios are required.
For this purpose, an experiment was conducted on a selection of blocks with 12 × 12 pixels in a frame subset. The frame subset was consisted of the first 100 frames of each scenario in baseline category. Totally, 460,000 blocks noted as SeqI were captured from this frame subset. The number of blocks in SeqMOI is 378,000, while that in SeqBGI is 82,000. The PSNR level for each block in the SeqI was calculated. The frequency of each PSNR level was analyzed and was demonstrated in Figure 2.

The distribution of PSNR in SeqMOI and SeqBGI. PSNR: peak signal-to-noise ratio.
In Figure 2, it is denoted that the distribution of the PSNR level in SeqBGI ranges from 35 to 55, and mainly within the interval [45, 50]. It is also demonstrated that the distribution of the PSNR in SeqMOI is within the interval [30, 46], and mainly within the interval [30, 42].
From this experiment, it was found most of SeqMOI can be distinguished from SeqBGI by PSNR thresholding, or to say the moving objects can be safely identified from the frame images using a specific PSNR threshold.
General description of the proposed method
In the proposed method PSNRDet, motion detection is done in three steps. First, the frame image is divided into blocks, and then the PSNR in blocks is calculated. Second, binary motion detection results are produced by thresholding the PSNRblock. Finally, the results of motion detection are obtained by re-projecting the binary motion detection results to the original scale by a neighboring voting scheme. The flowchart of the proposed method is shown in Figure 3. Each step of PSNRDet will be presented in the rest of this chapter.

The flowchart of PSNRDet. In this example, the size of the frame image is 5 × 5, and is divided into 16 blocks with B = 2 and STEP = 1. The yellow rectangle represents the data. The dark circle stands for 0, the white circle stands for 1, and the blue circles are operations. The transparent rectangle containing the data and the operation stands for each operation step in PSNRDet. PSNR: peak signal-to-noise ratio.
PSNR calculation and thresholding
The frame image can be divided into blocks either in nonoverlapping way or in overlapping way. The size of each block is B× B. In the overlapping scheme, the step-size of a block is STEP. STEP of the overlapping scheme is within [1, B). The nonoverlapping scheme can be treated as a special case of an overlapping scheme with STEP = B.
The PSNRblock is calculated according to formula (1). It is demonstrated in “The relationship of PSNR and movement” section that the motion detection can be done by thresholding the PSNRblock level. Such thresholding scheme in this experiment was defined as follows

where T is the threshold. The thresholding result of PSNRblock(u, v) is marked as BinMASKblock(u, v), which is short for the binary motion detection results. If PSNRblock(u, v) is larger than T, then BinMASKblock(u, v) is 0, which means there is no moving object in block(u, v); otherwise BinMASKblock(u, v) is 1, which means there are moving objects in block(u, v). The size of BinMASK is ((M − B)/STEP + 1) × ((N − B)/STEP + 1). Another example is shown in Figure 4.

The flowchart of PSNR thresholding in PSNRDet. In It and It − 1, the object is marked within the red rectangle. The image is divided into four blocks with B = 2, STEP = 2, namely, block(0, 0), block(0, 1), block(1, 0), and block(1, 1). By thresholding the PSNR, we get a 2 × 2 BinMASK. PSNR: peak signal-to-noise ratio.
Re-projection of BinMASK
In the nonoverlapping scheme, some internal areas of the moving objects cannot be detected like that by pixel-wise frame difference methods. When the moving object is larger than the size of the block, and the change of values of the pixels is small, consequently large PSNR in the internal areas, the internal areas may be identified as static background. This problem can be effectively fixed by employing the overlapping scheme.
In the overlapping scheme, one pixel at (x, y) is covered by many blocks which form a block set, marked as BLOCK(x, y). The size of BLOCK(x, y) is marked as #(x, y) which is equivalent to (B/STEP)2. The element of BLOCK(x, y), block(uk , vk ) is marked as block(k), k = 1, 2,…, #(x, y). A counter s(x, y) is defined as follows
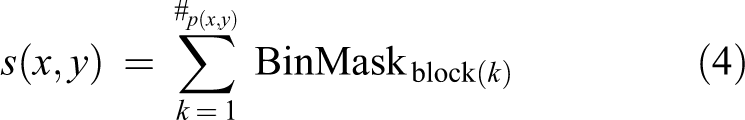
which counts the binary motion detection results of the blocks in BLOCK(x, y). It is obvious that s(x, y) ranges from 1 to (B/STEP)2. A normalized s(x, y) can be further defined as

MASK(x, y) can be also taken as the frequency of that the pixel at (x, y) is marked as a part of a moving object. In the nonoverlapping scheme, #(x, y) = 1, BinMask(x, y) is either 1 or 0, therefore MASK(x, y) = s(x, y) = BinMask(x, y); in the overlapping scheme, MASK(x, y) ranges from 0 to 1. The size of the MASK is M × N. And the final motion detection result can be obtained by thresholding the MASK. In this experiment, the threshold T MASK in thresholding the MASK was set to 0.5. If one wants to get an accurate detection results, large T MASK is suggested. If one wants to get more detected areas, small T MASK is suggested. And 0.5 is a moderate choice for T MASK.
The motion detection accuracy can be increased by this overlapping scheme in twofolds. On the one hand, the internal areas of moving objects can be properly detected. In such an overlapping scheme, the internal areas of the moving object may be detected when the detection frequency MASK(x, y) is large enough. On the other hand, detection error due to the noise or other problems can be greatly reduced. When smaller STEP is applied, a pixel can be covered by more blocks. Therefore, more information can be used for judging whether a pixel belongs to the moving object or not. Since the surrounding blocks are all involved in the voting of the final result, the incorrect mark with a low probability is not likely to happen on most of the surrounding blocks.
Data and experiments
In the experiments, we first selected the optimal parameters for PSNRDet. With the optimal parameters, PSNRDet was compared with other four popular methods: one frame difference method using three frames (DiffDet) 1 and three BGS methods, namely, GMM_Zivk, 6 GMM_Kaew, 20 and ViBe. 25
Data set
We built our database using a subset of change detection challenge (CDC) 35 data, namely, baseline category (including scenarios: highway, office, pedestrians, and PETS2006) and dynamicBackground category (including scenarios: boats and overpass). The scenarios in the baseline category contain moving objects and static background. In parameter selection, for each scenario in baseline category, 21 frames all beginning at frame #600 were selected. They formed the subset_S. In method comparison, for all scenarios of the two categories, 201 frames were selected. They constituted the subset_C. The details of subset_C are shown in Table 2. Frames from dynamicBackground category are relatively challenging where the background is not static but changing.
The information of subset_C.

The ground-truth images prepared for CDC are with five classes, as shown in Table 3. The shadow cancellation as a postprocess of motion detection has been widely studied. 36 –38 In the evaluation of the detection performance, the moving shadows were also noted as moving objects. And most of the unknown parts in ground-truth images belong to the motion areas, so the unknown was classified as moving objects as well. In the ground-truth images, pixels labeled with shadow, unknown, and motion were considered as motion pixels, the static as non-motion pixels. Pixels out of region of interest (ROI) were not in statistics.
The labeling in ground-truth image.

ROI: region of interest.
Evaluation metrics
The performance of the motion detection methods was evaluated based on pixel-level. Many metrics can be used to assess the output of a detection method given a series of ground-truth images. In the evaluation of the performance, F-score was employed. F-score was often used to evaluate the performance in the field of information retrieval (search, document classification, and query classification). 39 It was also widely used in computer vision. 25,27 The F-score is defined as follows

F-score considers both the precision P (defined in formula (7)) and the recall R (defined in formula (8)). True positives (TPs), false positives (FPs), true negatives (TNs), and false negatives (FNs) are involved in the statistics


where #tp is the number of TPs, #fp is the number of FPs, #tn is the number of TNs, #fn is the number of FNs.
In the motion detection domain, TP represents the correctly detected motion pixels. FP is the non-motion pixels incorrectly detected as motion pixels. TN is corresponding to the correctly detected non-motion pixels. FN stands for the motion pixels incorrectly detected as non-motion pixels. The bigger F-score is, the better one method performs; vice versa.
Effects of the parameters
PSNRDet includes three parameters, namely, block size B, step-size STEP, and binary threshold T. With three parameters, a PSNRDet configuration can be named as PSNRDet(B, STEP, T).
To demonstrate the effects of the parameters on PSNRDet, a homemade video captured at a busy straight two-way road was employed. Results given by PSNRDet with different parameter configurations were analyzed and discussed in this section.
The parameter ranges are shown in Table 4. The ranges of B and STEP can properly handle most demands of motion detection in subset_S and subset_C. The range of T was set according to the experiment of the PSNR distribution shown in Figure 2. The step of B, STEP, and T in Table 4 was set to efficiently draw the trend of the parameter effects by reducing the number of the experiments.
The parameter ranges of PSNRDet.

PSNR: peak signal-to-noise ratio.
Parameter B and STEP
With fixed T and STEP, as B increases, the detected motion areas and internal areas of moving objects increase. The incorrectly detected areas increase as well, especially at edges of moving objects, as shown in Figure 5. With fixed T and B, as STEP increases, the contours of the detected motion areas become less smooth, as shown in Figure 6.

With fixed T(=55) and STEP(=1), the influence of B on the motion detection(partial enlarged image). (a) B = 1, (b) B = 3, (c) B = 6, (d) B = 12, (e) B = 18, (f) B = 24, and (g) B = 36.

With fixed T(=55) and B(=12), the influence of STEP on the motion detection(partial enlarged image). (a) STEP = 1, (b) STEP = 6, and (c) STEP = 12.
Parameter T
With fixed B and STEP, as T increases, the detected motion areas and internal areas of moving objects increase, the incorrectly detected areas increase as well, as shown in Figure 7. It is demonstrated that the increase of parameter T has the similar effects as the increase of parameter B.

With fixed B(=12) and STEP(=4), the influence of T on the motion detection. (a) T = 10, (b) T = 25, (c) T = 30, (d) T = 40, and (e) T = 60. The zoomed-in-view areas with red rectangle in images (a) to (e) are shown in (f) to (j), respectively.
Selection of the parameters
To assess the effects of the combination of parameters on PSNRDet, various detection configurations formed by parameters in Table 4 were compared in subset_S. The parameter configuration (B, STEP, T) together with its average F-score formed a vector (B, STEP, T, F-score). Using these vectors, the effects of each parameter configurations on PSNRDet were analyzed quantitatively, as shown in boxplotted 40 Figure 8. On each box, the central mark is the median, the edges of the box are the 25th and 75th percentiles, and the solid rectangle is the mean. The cross marks outside the box are the 1st and 99th percentiles. The solid lines outside the box are the maximum and the minimum.
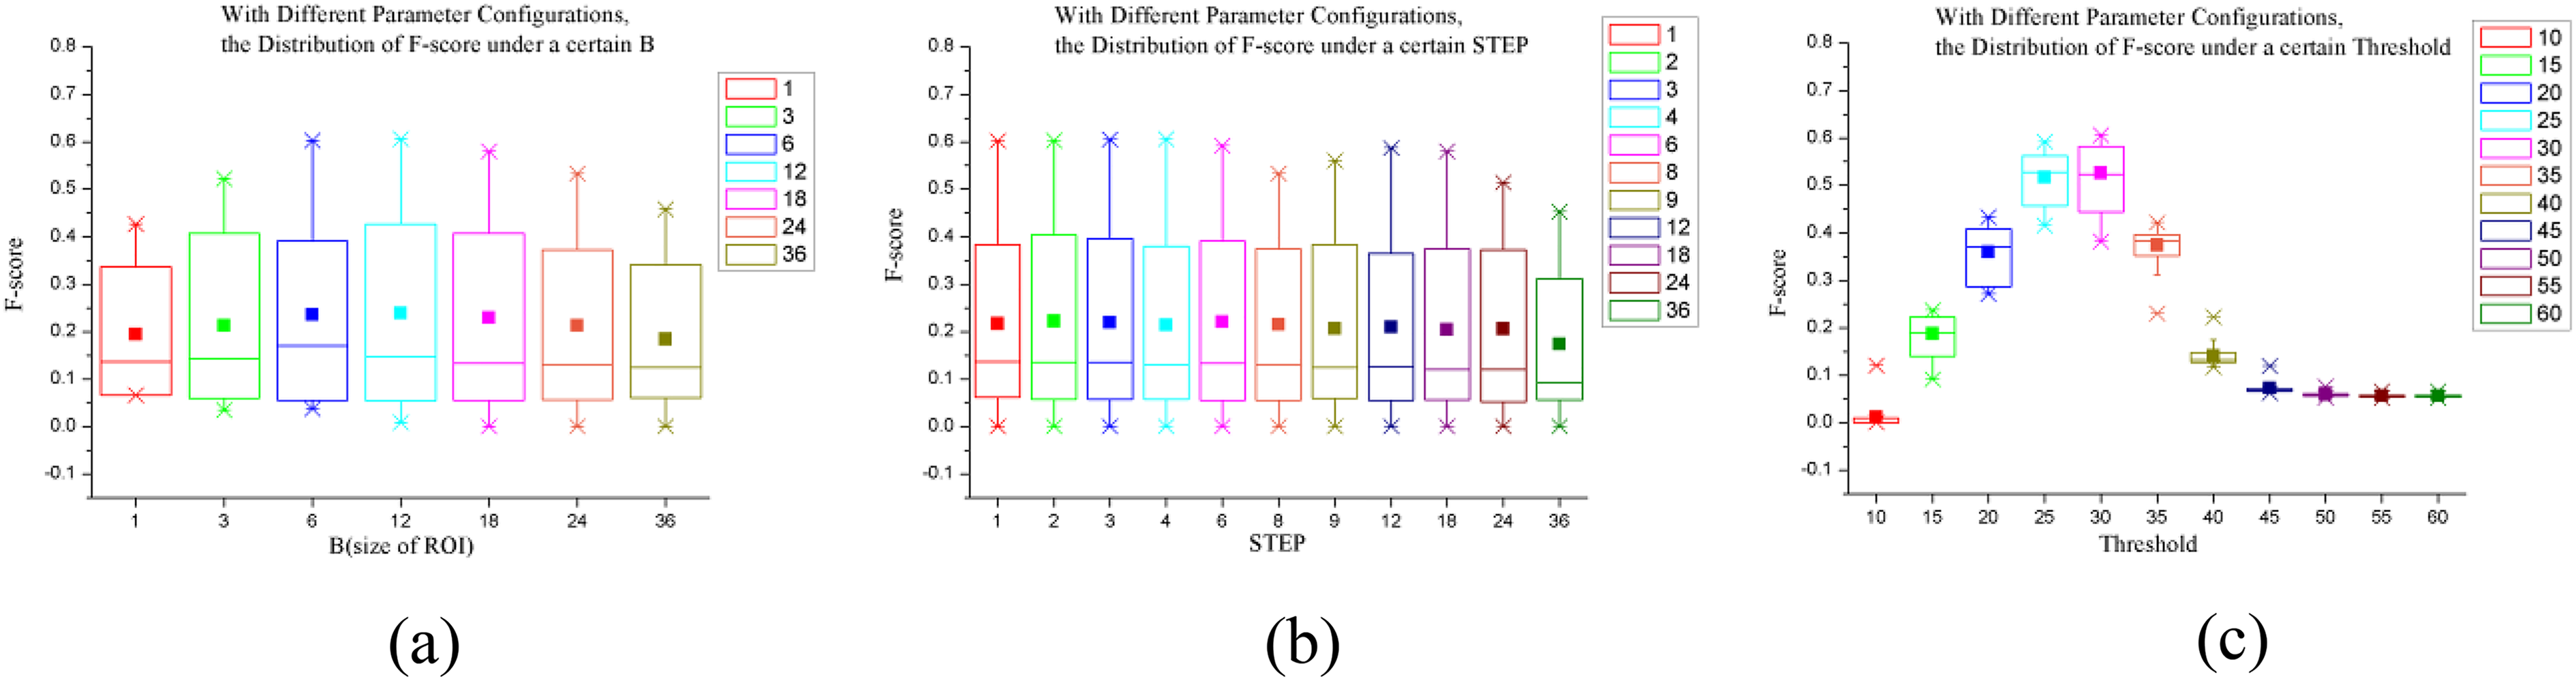
The influence of parameter (a) B, (b) STEP, and (c) T on PSNRDet in subset_S. PSNR: peak signal-to-noise ratio.
For parameter B, it is shown in Figure 8(a) that PSNRDet achieved the best average F-score when B = 12. Similar F-score could also be achieved when B = 6 and 18. For parameter STEP, it is shown in Figure 8(b) that all the average F-score were almost the same. Nevertheless, the differences of maximum F-score for each STEP were notable. For parameter T, it is shown in Figure 8(c) the best average F-scores were achieved for PSNRDet when T = 25 and T = 30.
Based on this comparison, an optimal configuration with the parameters which produced the best average F-score could be set as (B, STEP, T) = (12, 4, 30). PSNRDet with such configuration was named as PSNRDet_a. In the similar way, we also prepared the optimal parameter configurations with the best average F-score for each scenario in subset_S. These configurations were (6, 2, 30) for the scenario highway, (12, 3, 30) for the scenario office, (12, 4, 20) for the scenario pedestrians, and (12, 3, 35) for the scenario PETS2006. These four configurations were named as PSNRDet_a1, PSNRDeta2, PSNRDet_a3, and PSNRDet_a4, respectively.
To achieve real-time performance with acceptable detection outcomes, there should be a trade-off between the computation complexity and accuracy. It can be inferred from “PSNR calculation and thresholding” section that the computation complexity of PSNR calculation with different B and STEP is O(((M − B)/STEP + 1) × ((N − B)/STEP + 1)). The smaller STEP is, the more accurate the motion detection results are. However, more time it will cost. It is suggested that bigger STEP is a better choice when similar F-scores (the difference between F-scores is within 10%) are obtained with other parameter configurations. Taking real-time performance into account, we set another optimal parameter configuration for PSNRDet (B, STEP, T) = (6, 6, 30). PSNRDet with such configuration was named as PSNRDet_b.
Comparison with other methods
To find the position of our method in the current motion detection study field, the proposed PSNRDet has been compared with one frame difference method (DiffDet) and three state-of-the-art BGS (GMM_Zivk, GMM_Kaew, and ViBe). For GMM_Zivk and GMM_Kaew, default parameter configurations provided by OpenCV library were used. Optimal parameter configurations were set for ViBe. No bootstrap process was applied for GMM_Kaew, GMM_Zivk, and ViBe. They used the first frame to initialize the model. The threshold for binary thresholding in DiffDet was set by the recommended value of 30. 9 PSNRDet_a and PSNRDet_b were used to compare with these methods.
Figure 9 illustrates some selected samples of the detection results of different scenarios in subset_C. The motion and non-motion areas are drawn in white and black, respectively. The average F-scores for all scenarios in subset_C are compared in Table 5 and Figure 10. The F-scores of the results given by DiffDet are not plotted in Figure 10, since they are below 0.1. Computation times of these six methods were also compared in terms of processed frames per second (referred as fps) on our platform (2.50-GHz Dual-Core E5200 CPU, 4-GB RAM, Visual Studio 2010 with OpenCV2.3). The fps for all scenarios in subset_C is shown in Table 8 and Figure 11.

Selected motion detection results of the six methods for different scenarios in subset_C. (a) ground truth, (b) PSNRDet_a, (c) PSNRDet_b, (d) ViBe, (e) GMM_Kaew, (f) GMM_Zivk, and (g) DiffDet. Each row is corresponding to a scenario in subset_C at frames #790, #650, #660, #670, #680, and #690. PSNR: peak signal-to-noise ratio.
The average F-score of the motion detection methods in subset_C.

PSNR: peak signal-to-noise ratio; GMM: Gaussian mixture model.

The F-score of the motion detection results given by the comparison methods for all scenarios in subset_C.

The fps of the comparison methods for all scenarios in subset_C. fps: frames per second.
The detection accuracy
It is shown in Table 5 that PSNRDet is equivalent to ViBe in terms of detection accuracy. Table 5 shows that the average F-score of PSNRDet_a is about 3.5% higher than ViBe, about 23.4% and 30.2% higher than the GMM_Zivk and GMM_Kaew, respectively. The average F-score of PSNRDet_b is about 6.7% lower than ViBe, about 11.1% and 17.3% higher than GMM_Zivk and GMM_Kaew, respectively.
In scenario pedestrians and boats, as shown in Table 5, the average F-scores by different methods are relatively low, less than 0.5.
In scenario pedestrians, the first 100 frames contains a person moving from right to left horizontally, and the last 100 frames contains no moving objects. Therefore, the TPs in the last 100 frames are nearly 0, and the F-scores are close to 0 according to formula (6). Then, the F-scores of the results are lower than 0.5. To demonstrate the performance of different methods for the video sequence with moving objects, the average F-scores for the first 100 frames are also shown in Table 6.
The F-score of the detection methods using frames #601–#700 in scenario pedestrians.

PSNR: peak signal-to-noise ratio; GMM: Gaussian mixture model.
In scenario boats, the upper half image is out of ROI, and the detection results in this area are not in statistics, while the bottom half image constitutes a lake with high dynamics and the lower part of the boat which is the moving object to be detected. In such a scene with high dynamic in the background (the lake), it is challenging to identify the moving objects (the lower part of the boat). And the F-scores of the results given by the detection methods are commonly lower than 0.5.
It is notable that the average F-scores of different methods in this experiment are relatively lower than the ones reported in some other relative articles. The reason could be explained in twofolds. First, ViBe, GMM_Zivk, and GMM_Kaew were initialized using some well selected background which strongly depends on the experience of the algorithm designers, while in this experiment, the initialization was done uniformly with the first frame for fair comparison. Second, the postprocess (such as shadow cancellation) after primary detection results was not involved in this comparison, so the isolated false alerts were not eliminated.
The F-scores of PSNRDet_a1–PSNRDet_a4 are shown in Table 7. In the application where the preprocess of parameter selection is available, the performance of the proposed method would be more promising.
The F-score of PSNRDet_a1–PSNRDet_a4 in its corresponding scenario.
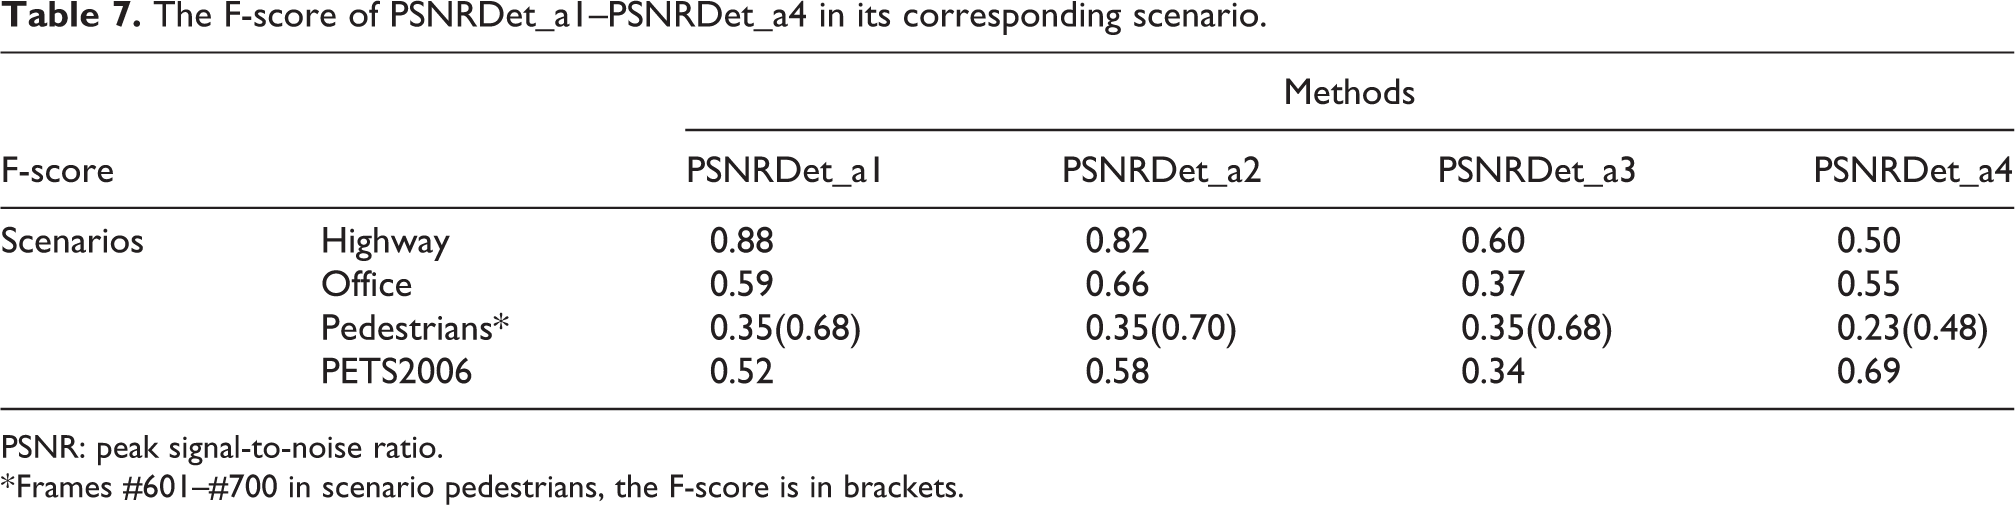
PSNR: peak signal-to-noise ratio.
* Frames #601–#700 in scenario pedestrians, the F-score is in brackets.
The real-time performance
It is shown in Table 8 that the average fps of the compared methods is capable to detect moving objects over 40 fps except the PETS2006 scenario in which the frame size is 720 × 576. Table 8 demonstrates that the average fps of PSNRDet_a is about 55%, 56%, and 52% higher than ViBe, GMM_Kaew, and GMM_Zivk, respectively, while the average fps of PSNRDet_b is about 67%, 69%, and 64% higher than ViBe, GMM_Kaew, and GMM_Zivk, respectively. It is promising that even in surveillance scene with high-resolution cameras the proposed method may be still capable to work in real time.
The average fps of the motion detection methods in subset_C.

PSNR: peak signal-to-noise ratio; fps: frames per second; GMM: Gaussian mixture model.
By the comparison, it was found that the proposed method PSNRDet performed better than the compared methods considering both the detection accuracy and time efficiency.
Conclusion
A novel block-wise frame difference method PSNRDet for real-time motion detection was proposed.
Relationship between the existence of the moving objects and PSNRblock has been explored. In comparison with the pixel-wise frame difference method, the proposed method takes the advantages of block-wise methods which are noise insensitive. The proposed method is simple but effective without modeling the complex background. An overlapping scheme has also been put forward to overcome the internal area missing problem which usually happens to traditional frame difference methods.
Effects of the parameters for the proposed method have been discussed. The proposed method has been compared with four other motion detection methods in both detection accuracy and time efficiency, where PSNRDet showed about 50% decrease on time cost than ViBe with 3.5% increase of the F-score on detection accuracy.
Footnotes
Declaration of conflicting interests
The author(s) declared no potential conflicts of interest with respect to the research, authorship, and/or publication of this article.
Funding
The author(s) received no financial support for the research, authorship, and/or publication of this article.