
Abstract
Tactile sensors are commonly a coordinated group of receptors forming a matrix array meant to measure force or pressure similar to the human skin. Optic-based tactile sensors are flexible, sensitive, and fast; however, the human fingertip’s spatial resolution, which can be regarded as the desired spatial resolution, still could not be reached because of their bulky nature. This article proposes a novel and patented optic-based tactile sensor design, in which fiber optic cables are used to increase the number of sensory receptors per square centimeter. The proposed human-like high-resolution tactile sensor design is based on simple optics and image processing techniques, and it enables high spatial resolution and easy data acquisition at low cost. This design proposes using the change in the intesity of the light occured due to the deformation on contact/measurement surface. The main idea is using fiber optic cables as the afferents of the human physiology which can have 9 µm diameters for both delivering and receiving light beams. The variation of the light intensity enters sequent mathematical models as the input, then, the displacement, the force, and the pressure data are evaluated as the outputs. A prototype tactile sensor is manufactured with 1-mm spatial and 0.61-kPa pressure measurement resolution with 0–15.6 N/cm2 at 30 Hz sampling frequency. Experimental studies with different scenarios are conducted to demonstrate how this state-of-the-art design worked and to evaluate its performance. The overall accuracy of the first prototype, based on different scenarios, is calculated as 93%. This performance is regarded as promising for further developments and applications such as grasp control or haptics.
Keywords
Introduction
The somatosensory system and the mechanoreceptors located in the skin of the human body form the largest sensory system of human beings. 1 The analogues of this system are the tactile sensors in the industry and they are used when interactions between two surfaces are needed to be measured.
The main objective of any industrial or biological tactile system is to measure and locate the contact forces. 2 It is estimated that an average human finger tip has 1-mm spatial resolution in measuring tactile data with high accuracy, at 20–50 Hz sampling frequency with 10-kPa (approximately 1 grf/mm2) resolution. 3
High precision motion control and safety issues led the researchers to consider tactile sensors mostly in the fields of automation, robotics, 4 medical assistance, and space technology. 5
There are some on-going cutting-edge studies on tactile sensors. For instance, a group of researchers developed a flexible membrane with high touch sensitivity using a precisely molded pressure-sensitive rubber sandwiched between electrodes. 6 This novel design of the thin rubber layer allowed them to detect the weight of a fly resting on its surface. Recent studies also introduced 3-D and skin-like magnetic-type tactile sensors. 7
The tactile sensors are usually in a matrix form with distributed receptors. The main categorizing criteria is the method of how these receptors acquire the tactile data. The most common techniques use electric resistance, 8 capacitance, 9 or piezoelectrical charge 10 to measure the force that is applied to the contact surface.
Optic-based tactile sensors
The optical method is one of the major ones and it is based on optics and image processing. There are mainly two ways to use optics in order to obtain the force and pressure map on the contact/measurement surface. The first way is to use the change of the intensity of the reflected light due to the deformation that is caused by the external stimuli. 11,12 The second way is to use the change of the geometry of the markers due to the external stimuli that are observed by the camera. 13,14
A new tactile sensor consists of a transparent semispherical gel and an embedded small camera is designed to perform the proposed control method by the NAIST-Hand. 15 Ohka et al. developed an optical three-axis tactile sensor based on the principle of optical waveguide which is capable of acquiring normal and shear forces. 16
Some other studies use light sensors and light source couples in order to monitor the pressure distribution at the surface. 17,18 They developed a sensor technology for the measurement of distributed pressures, named pressure sensor pads. The spatial resolution depends on the number of light receivers on the silicone bulk. For instance, one version includes eight light sensors where the overall size is 60 × 20 mm2. 19
Note that the number of sensing units/elements per measurement area directly depends on the sizes of the optocouplers. This is very important, because the size of light sources and/or light sensors is where our design makes a difference. Optic-based tactile sensing systems are frequently limited to sense excitations with very low (spatial) resolution when compared with the human fingertip’s dexterity. 20 –23
Considering the commercial products and the problems mentioned in the literature, the defects of optic-based tactile sensing systems can be summarized as small number of tactile sensing unit/element per measurement area, low spatial resolution, high costs for data acquisition of excessive analogue inputs, computational burden, and bulky structure. 24 –26 The design of the proposed tactile sensor system helps to solve or ease most of the aforementioned problems.
Motivation
Tactile sensors can be used in different applications such as robotics, medical/surgical devices, haptics, space suits, and so on. Higher spatial resolution enables a better control performance. Dahiya et al. 23 state in his review article that optic-based taxels are immune to electromagnetic interference, flexible, sensitive, and fast but at times they are bulky. Consequently, the desired level for tactile sensing when compared to the human’s tactile sensing ability still could not be reached in terms of receptors per measurement area in especially optic-based tactile sensors. Even if the number of receptors per square centimeter can be satisfied, a new challenge occurs. For example, a 10-cm2 tactile sensor with 100 units/cm2 means 1000 data points which is practically not easy to deliver to a computer in real time.
There are some similar works in the literature using the change of the intensity of light 27 –31 alike ours, with fiber optic cables, a camera, and a silicone substance. Even so, the proposed design has two unique contributions. First, to increase the quantity of the sensing points (receptors) per square centimeter up to one million or more. Second, to measure/acquire millions of receptors’ tactile data individually and deliver them to the control unit while avoiding high costs. Moreover, with a single amplifier, which is a simple camcorder, all the data can be acquired and processed simultaneously within every sampling cycle.
The design proposes to use fiber optic cables and a low-cost complementary metal–oxide semiconductor or CCD image sensor (which can be found in a conventional webcam, camcorder, digital camera, etc.) by pairing each pixel of the image sensor with a corresponding fiber optic cable. This design enables to transfer all of the light data to the computation unit on a single photo frame where the coordinates and the level of displacements can be evaluated precisely by the aid of the image processing techniques. 32 –37 The proposed method has the following advantages. (i) Increased number of sensing units/elements per area; (ii) very high spatial resolution; (iii) being multi touch (each sensing element acquires data individually); (iv) being low cost especially for data acquisition of excessive analogue inputs; (v) petite and yet stable structure; (vi) being bendable and flexible; and (vii) sheltered from magnetic or any other perturbations.
This is already an internationally patented design published in 2014. The earlier publications only describe the guidelines of this new approach without any details on materials, modeling, optics dynamics, the prototype, and most importantly, the performance metrics of the sensor. 32,35 –37 A new prototype and test beds are built in order to investigate the sensor, its limitations, and performance. The quantification of the prototype is performed in this article. One of the main objectives of this study is to obtain a repeatable manufacturing procedure by forming guidelines for the selection and the usage of the materials. Additionally, the limitations of the system regarding the material selection have been carried out through experimental studies and mathematical evaluations. The effect of light disturbance and optics dynamics is also investigated, and the optimal intensity of light source level due to the thickness of the silicone rubber pad and light absorption coefficient was carried out.
The prototype has been subjected to different tests including step, ramp, and sine inputs with various frequencies and magnitudes. Overall, an evaluation has been performed with simple statistical methods and the success rate of the sensor is demonstrated.
The remainder of this article is organized as follows: The second section describes the proposed tactile sensor system and the prototype; the third section discusses the mathematical approaches and tools for this novel concept; the fourth section demonstrates the results; and the conclusions are drawn in the fifth section.
Design of the optic-based tactile sensor
The proposed tactile sensor design consists of fiber optic cables, a camcorder, a light source, an elastic and transparent silicone pad, an elastic but nontransparent cover/reflector, a meshing body for fiber optic cables, a computer for image processing and further calculations, and some necessary mechanical structures for the sensor body.
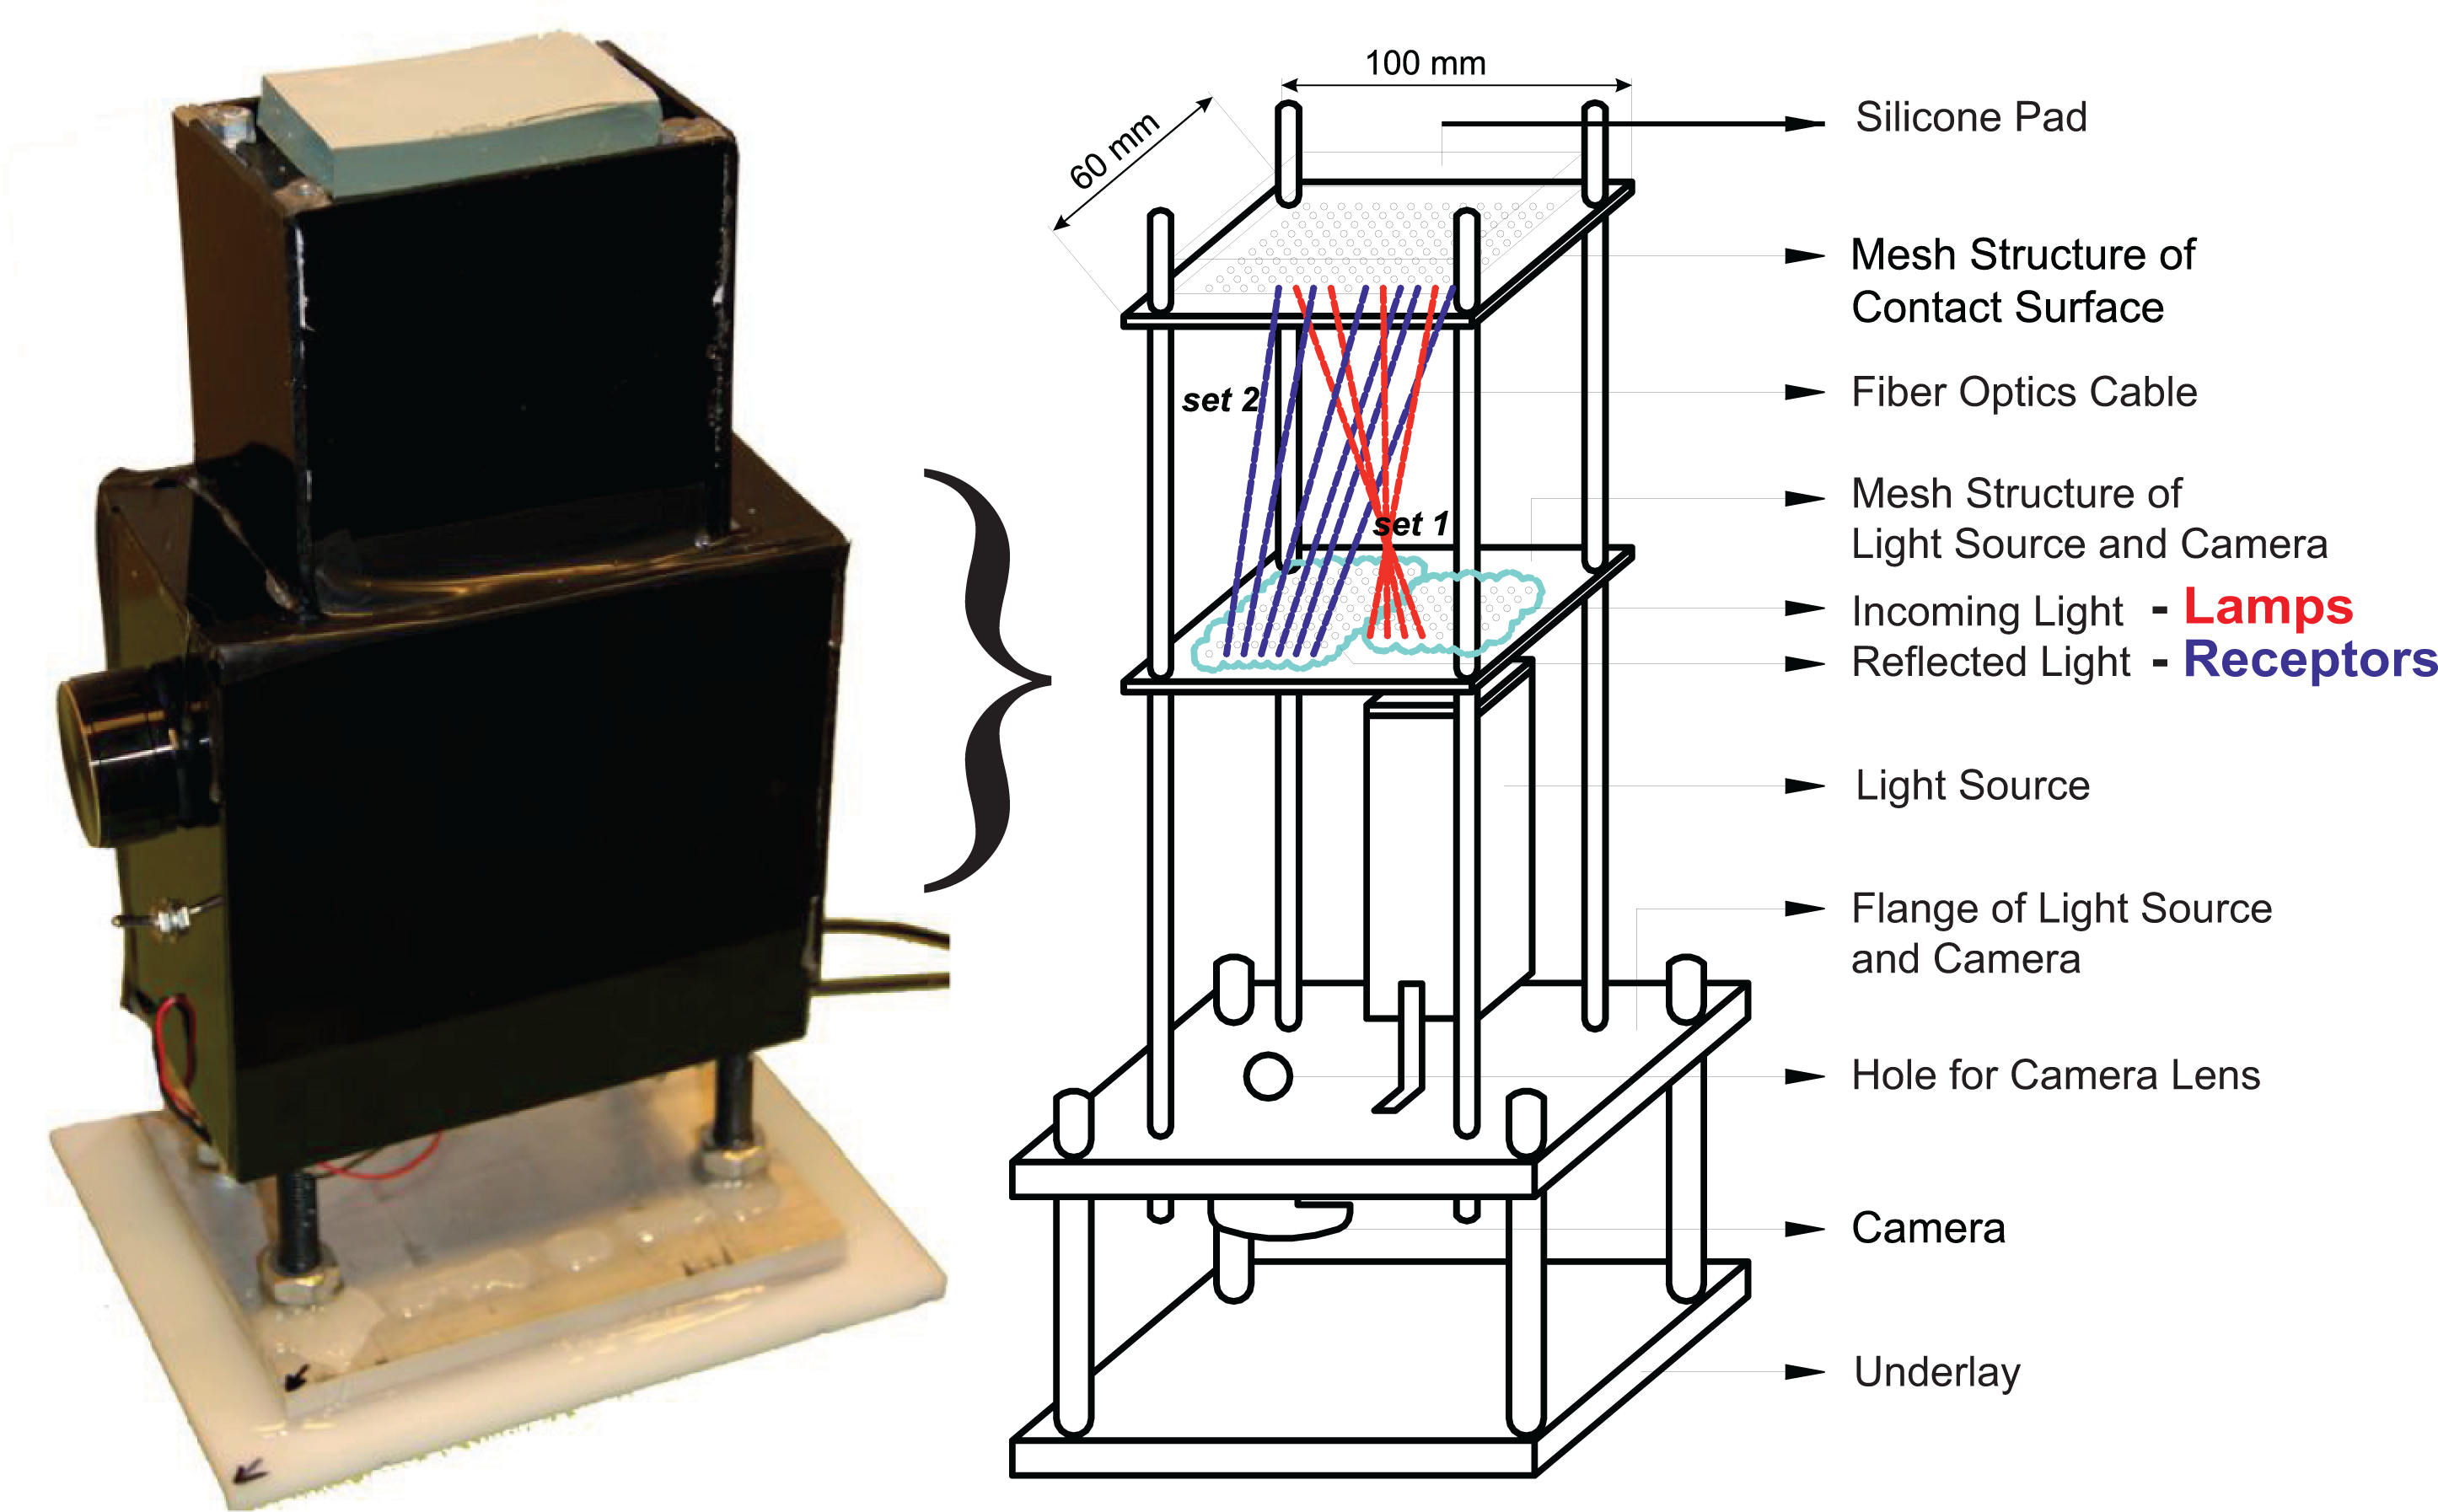
Each fiber optic cable entitled as set 1 delivers one light beam to the surface of the elastic and transparent silicone rubber pad. At this end, the optic cables are located and ordered by the mesh structure. Light beams enter the silicone pad and reach to the reflector which is also elastic but not transparent. Beams reflect back and travel back through the silicone pad into fiber optic cables entitled as set 2. These fiber optic cables bring back the reflected light beams to the camera as shown in Figure 1.

Overall system design demonstrating the flow of the whole process.
System running principle
The reflection occurs as in Figure 2(a) for a simple optocoupler which is just a bounded light source and a receiver. The intensity of the light or in other words the brightness level that is reflected and brought back to the camera depends on the distance h which is the interval between the reflection surface and end point of the fiber optic cables. That is how optics-based tactile sensors work in general. 23 Using optocouplers degrades the spatial resolution to 5 mm since an optic couple is at least 5 mm in diameter.

Change in the light intensity (illuminance) when there is a stimulus.
Spatial resolution is the minimum distance of two discrete inputs for the sensor to identify them as two separate stimuli. An average human can feel two separate stimuli as two different inputs if the distance between them is at least 1 mm at the fingertip. 3,38 The authors regarded high spatial resolution as a better spatial resolution than an average human fingertip. A tactile sensor that has a spatial resolution less than 1 mm is considered as a high spatial resolution tactile sensor.
The proposed design replaces optic couples with fiber optic cables using them like efferent (set 1) and afferent (set 2) neurons as in the human physiology 38 (see Figure 2(b)). Each receptor (pixel) of the sensor has been paired with a corresponding fiber optic cable. Since there are fiber optic cables with 9-µm 39 diameter, the number of receptors that can be placed on a surface dramatically increases up to million levels, as well as the spatial resolution down to micrometer levels.
Fiber optic cables are flexible/bendable and even though they form a curve, they can still be used to transmit light beams. This feature of fiber optics enables to design a system in which the measurement takes place meters away from the computing part. Thus, the system can be protected from magnetic disturbances by locating the computing devices away from the magnetic fields. It is also possible that more than one sensory area (matrices) can be measured using only one computation device. These cables are highly bendable, so that it creates a layout freedom. These features will be explained in more detail in the following sections.
This design brings in a new problem which is acquiring and processing this much of analogue data. One can squeeze in more than a million fiber optic cables with 9-µm diameter in 1 cm2 area which is practically very difficult, maybe impossible to process in real time. Any full-high-definition (HD) camera includes more than two million (1920 × 1080) sensory pixels. Each pixel is able to detect 16.7 million colors in standard usage (RGB color model and 8-bit indexing for each color). Therefore, it is possible to measure the displacement precisely through the variation of the light intensity with such an arbitrary camera, as shown in Figure 2(c) and (d). By pairing each pixel of the camera with a corresponding fiber optic cable, all light beams (receptors) can be represented on a single photo frame, in real time. Then, the level of the displacement can be precisely evaluated using image processing techniques.
The first and the second contributions of this innovative tactile sensor design is to increase the number of the sensory receptors per 1 cm2 area up to more than one million and to be able to measure every single receptor individually and simultaneously.
In addition, there is a third feature which is multi–multi touch capability. This feature allows to measure different inputs, up to the total number of receptors at every instance.
Design of the prototype
The prototype design aimed to have 1-mm spatial resolution both in consideration of easy manufacturing and experimenting. Besides, an average human fingertip has 1-mm spatial resolution. The main objective of this prototype is to prove the claims of the patent and quantify the proposed tactile sensor. In this prototype, there are 522 receptors acquiring the tactile data in 255 levels using gray scale (0 is reserved for a special operation).
The prototype and its 2-D graphical layout can be seen in Figure 3. Technical specifications of the prototype are given in Table 1. The design is explained with details in the following sections.
The actual prototype and its design in 2-D graphical demonstration.
Technical specification of the prototype.

In the following context, the word receptors will be used instead of the fiber optic cables set 2. Receptors, which bring back the reflected light from the measurement surface to the camera, are previously addressed as sensing units/elements. The word lamps is defined for the fiber optic cables set 1, which carry the light from light source to measurement surface.
Mesh structure
There are two objectives of this structure. One is to place the lamps in such a way that every point on the contact surface has the identical level of brightness/illuminance. Another one is that the number of receptors should be high enough in order to ensure the 1-mm spatial resolution. Since this mesh structure design designates the spatial resolution, some designs are made to satisfy these requirements using graphical methods. In the optimum design, each lamp is surrounded by six receptors symmetrically forming a hexagon and each receptor is surrounded by three lamps symmetrically (see Figure 4(a)).

(a) The design of mesh structure where blue and red dots are receptors and lamps, respectively. The spatial resolution is defined as the minimum distance between two receptors. (b) Schematics of light source.
Technical specifications of the prototype
Technical specifications of the manufactured prototype are given in Table 1. These specifications are obtained with the help of a load cell, a force sensor, a universal tension testing machine, and two experimental setups designed and built to quantify the prototype. Note that these properties are valid for this prototype only, and also note that one can manufacture a tactile sensor using this patented design with spatial resolution up to 10 µm (using data fiber optic cables) and/or up to 1000-Hz sampling frequency (using a high-speed camera). We would like to underline that an average human fingertip has 1-mm spatial resolution at 20–50 Hz with 10-kPa (approximately 1 grf/mm2) pressure resolution. 2,3
In this prototype, 23.1-cm2 area is filled with 22 receptors per square centimeter providing 1-mm spatial resolution. One should notice that the spatial resolution is defined as the minimum distance between two receptors.
Material selection for the prototype
The constitutive items of this prototype sensor, which have influence on the measurement, are the light source, the camera, the silicone rubber pad, and fiber optic cables.
Camera
An A4 Tech webcam that works at 30 frames/s is selected for the prototype which has 522 receptor. As mentioned previously, each receptor is paired with a single pixel of the camcorder, in this case with the webcam.
If needed, a full-HD webcam can be used in order to detect 1920 × 1080 = 2,073,600 sensing points.
Light source
Light source should disperse light equally to every point. So a halogen-type torch with 20 light emitting diodes (LEDs) is manufactured. This torch is at 1.76-W power providing 24 lux of illuminance (see Figure 4(b)). As an addition, an electronic circuit is designed in order to control the brightness level (illuminance) on the contact surface for different measurement scenarios. Since this prototype is a close system, thermal variation during working should be considered. In order to quantify the temperature inside the sensor, the LED torch is observed with a thermal camera for 30 min under full working capacity. The temperature on the surface of the torch increased up to 60°C in 20 min and remained still for the next 10 min ensuring that the temperature increase in the sensor is within the working conditions which is below 80°C.
Silicone rubber pad
Silicone rubber material is an elastomer-type material produced from polymer substance. The main ingredients are dimethylvinylpolydimethylsiloxane and fumed silica. The properties of the selected silicone have a direct influence on the measurements and features of the manufactured tactile sensor. For instance, the value of elastic modulus indicates the resolution and range of the force/pressure measuring features. We manufactured silicone pads with 0.10–0.20 MPa elastic modulus. A vacuum pump is used and a molding procedure is applied to cast uniform and homogeneous silicone rubber pads. After that, the pads are sent to an independent laboratory for tension tests in order to be sure about the elastic modulus of every pad.
A silicone pad with 0.156 MPa elastic modulus and 10-mm thickness is selected for this prototype. The selected pad is plastically deformed when there is an input which causes more than 7 mm (70%) displacement due to strain–stress graph. Thus, the prototype has been limited up to 7-mm displacement (indentation) and maximum 108.9-kPa stress due to safety considerations and repeatability. In this work, hysteresis of the silicone rubber pad is not investigated, and it is deferred to future works.
The selected pad has 0.156-MPa elastic modules; therefore, 15.6-N force should be applied to 1-cm2 area for maximum elastic deformation, that is, 7-mm displacement. This variation of force will be acquired in 255 levels because of the gray scale image processing. Thus, this prototype sensor has 15.6/255 = 0.0612 N force measurement resolution for 1-cm2 area, providing 0.61-kPa tactile measurement resolution, as given in Table 1.
The silicone rubber pad determines the resolution and range. If the elastic modulus of the silicone rubber pad increases, the working range of the sensor also increases but the force resolution decreases and vice versa. Thus, one can select different pads for different applications.
Dynamics of light source and silicone rubber pad
The optimum thickness of the silicone rubber pad has been investigated based on the intensity of light source and the absorption coefficient of the silicone material. The absorption coefficient of the silicone material has been empirically obtained. The main objective of this part of the study is to find the optimum thickness and absorption coefficient value for the silicone rubber pad and the proper intensity of light source, together which provide 255 levels of measurement between zero and maximum input. The unique outcome of this particular research is to find out different configurations for different scenarios. One can easily find what should be the level of the light and the characteristics of the silicone rubber pad by simply looking at Figure 5(a). The parameters of the sensory system can be tuned according to the purpose of the measurement for a better performance. The elastic modulus of the silicone rubber pad determines the force level to be measured and this plot shows with how much penetration this force might be applied. The silicone pad selected for this prototype has 10 mm of thickness and 0.016 absorption coefficient. Therefore, the intensity of light source has been adjusted to 9.8 lux. These values are obtained with the help of empirical results (see Figure 5(a)) and fundamental equations of illuminance given in the work of Taylor. 40

(a) Level of light source, thickness, and absorption coefficient of silicone rubber pad chart. There is no light reflection if the intensity of light source is below 7.2-lux level for this silicone rubber pad. (b) The sketch of the flexibility and bendability of the proposed tactile sensor system is shown on an arbitrary robotic hand.
Fiber optic cables
There are 522 receptors for the 23.11-cm2 measurement surface providing 1-mm spatial resolution which is basically the distance between two receptors. There are 257 lamps in order to provide the necessary illumination (brightness level); therefore, there are totally 779 fiber optic cables in this prototype.
The fiber optic cables have 0.75-mm diameter. These polymethyl methacrylate –based cables can work up to 110°C. They can transmit light up to 1 m without any loss, to 2 m with 0.97 efficiency, and to 3 m with 0.92 efficiency.
Flexibility, bendability, and disturbance resistance
This prototype is aimed to do the measuring on a flat area. Yet, this patented design is bendable. This feature of the sensor can be provided easily while casting the silicone rubber pad. The pad mould can be designed for flat surfaces as well as curved surfaces as shown in Figure 5(b). Since the transmission of the light is done through fiber optic cables, a group of tactile sensors can be located on the fingers of a robotic hand, as shown in Figure 5(b). It is also possible to use a single computation unit for multiple sensor matrices.
Fiber optic cables do not lose data for up to 1 m, so the computation unit can be located far from measurement area. For example, if there are magnetic disturbances in the working environment, one can place the computation unit one away from there. This distance can be increased using infrared transmitting fiber optic cables. Note that this sensory system cannot measure shear forces. On the other hand, the fiber optic cables can be placed sandwich type between two contact/measurement surfaces.
Image processing software
This software is in charge of image processing and initial filtering (filtering will be explained under “Noise and filter design” section). Visual Basic 6.0 language, which is generic and compatible with any camcorder, is used in order to obtain the light intensity/lux data of each receptor, leveled from 1 to 255, where 1 and 255 are defined as full black and full white, respectively.
The output of the software is the gray scale values of intensity of the light of each and every individual receptor at the measurement surface. When there is no input to the system, the output of the software will be “1” for every receptor. If there exists an input (a stimulus), this will deform the silicone pad and the reflecting distance will decrease. Consequently, the illuminance/light intensity will increase. This increase is exponentially related to the deformation/stimulus.
The gray scale map of the measurement surface is simultaneously transferred to MATLAB for further and advanced calculations. A MATLAB-based graphical user interface (GUI) program imports the data in a matrix at a predefined frequency. At this point, the sensor system with the aforementioned software provides only the dynamic gray scale map that responds to any force application to the measurement surface.
Cost
The cost mainly depends on the spatial resolution, that is, the number of fiber optic cables. The other parameters that affect the cost are the sampling frequency (i.e. regular webcam vs. high-speed camera), measurement area, and the distance between the measurement surface to the computation unit (i.e. length of fiber optic cables). Since all of the required materials are generic and easy to find, the costs that are given in the following are evaluated by looking at the retail prices from online electronic markets.
A single fingertip tactile sensor with 2 × 2.5 cm2 area and 10 receptors per square centimeter costs US$222.6 including computation unit where five fingertip tactile sensors together cost US$313. A single fingertip tactile sensor with 2 × 2.5 cm2 area and 241 receptors per square centimeter as in human fingertip cost US$322.4 where five of them (which means 6025 receptors in total) together cost US$812.
There is no commercially available tactile sensor that is based on optics. Therefore, it is not very easy to compare the price of a commercial product with the proposed design. However, the specifications of a commercially available tactile sensor that is based on capacitance are given here for comparison. PPS 5226 of Pressure Profile System is an industrial tactile sensor with 1.5-mm spatial resolution at 50-Hz sampling rate and approximately 44 receptors per square centimeter area. The price is US$5400 including the computation unit and the software. 41 A tactile sensor with the same specifications costs US$210 with the proposed design including hardware and software. One should notice that this value is the sum of costs of the materials/hardware.
Mathematical model approach
There are two mathematical models working together and in sequent for the evaluation of the displacement, force, and pressure map on the measurement surface caused by any external stimuli. The input of this sequent model is the gray scale values of each receptors that are in a matrix form provided by the image processing software. The Cartesian coordinates of each and every receptor are known. So, the output of the mathematical models is a map (matrix), showing displacements and force at every point on the measurement surface.
Although the designed system is prevented, there exists some light noise caused by internal happenings, such as light source and camera flaws as well as outer happenings such as environmental light. For instance, a little camera noise causes an incorrect change in gray scale value at this one instant. Therefore, a filter is designed to increase the accuracy of the system.
Noise and filter design
Fiber optic cables cannot transmit the light beams if they are not perpendicular to the cross section of the cable. This feature of fiber optic cables cancels all the light noise that can rise when there is an input with curvy geometry. For instance, if an input (stimulus) is applied by pressing a circular or a triangular shaped body on this sensor, then the deformation on the silicone will be circular or triangular. Consequently, the light beams may reflect to each and every receptor regardless of the location. Since the fiber optic cables transmit the light beams that they look at perpendicularly, the shape of the input (for instance, a non-flat geometry) do not influence any noise to the nearby receptors. This is a mechanical noise filter coming from the nature of the fiber optic cables.
The environmental lighting and manufacturing defects may still cause disturbance. Thus, a two-step filter is developed. First one is an algorithmic software written by the authors and called smart filter. This filtering takes place in the visual basic image processing software. A static lighting (illuminance) may occur at the beginning frame even if there is no input. Therefore, a simple adaptive calibration, which sets the zero input values, initiates in the beginning sequence. There might be also single point and impulse type, dynamic disturbances caused by manufacturing defects or camera. The smart filter observes the variation that is sudden and bigger than an amount of the average variation of the neighborhood pixels. This amount is adaptive and it is decided by the smart filter. This first step of the filter is eventually a text-based algorithm. The smart filter additionally includes a classical low-pass filter. The second step of filtering takes place in MATLAB GUI. It is a classical 2-D Gaussian filter. This method is used in order to soften the image. It causes no decrease in spatial resolution; it only eliminates the impulse type of noises.
Light intensity level to displacement model
Due to the penetration of the external stimulus, the value of the intensity of the light changes exponentially as indicated by Beer–Lambert law, equation (1). 40 If a light beam enters to a transparent substance, the relation of the intensity of the light (illuminance) between the input (I i) and the output (I o) depends on the distance that the light travels (h), and the material’s light absorption coefficient (Σ) which is the product of the molar absorptivity and the concentration of the compound

The first mathematical model has the filtered output as the input which is gray scale values of the light intensity of each and every receptor. The output of this first model is the displacement on the measurement surface which is calculated by the aid of Beer–Lambert law. If there is an input/stimulus, the reflected light intensity will increase (ΔI) due to the displacement (Δh) as in equation (2), where ΔI = I i − I o. Since the system measures I o (the intensity of reflected light) and I i (the intensity of source light) is known, then one can calculate the displacement through equation (3) as shown in Figure 6, 40 where k is the light reflecting constant of the reflector. The coefficient 2 in the denominator exists because the light travels through the silicone pad twice. The coefficient of materials light absorption (Σ) is obtained empirically for the silicone pad as well as the light reflecting constant (k) of the reflector. The light absorption coefficient is assumed to be constant and independent of the pressure


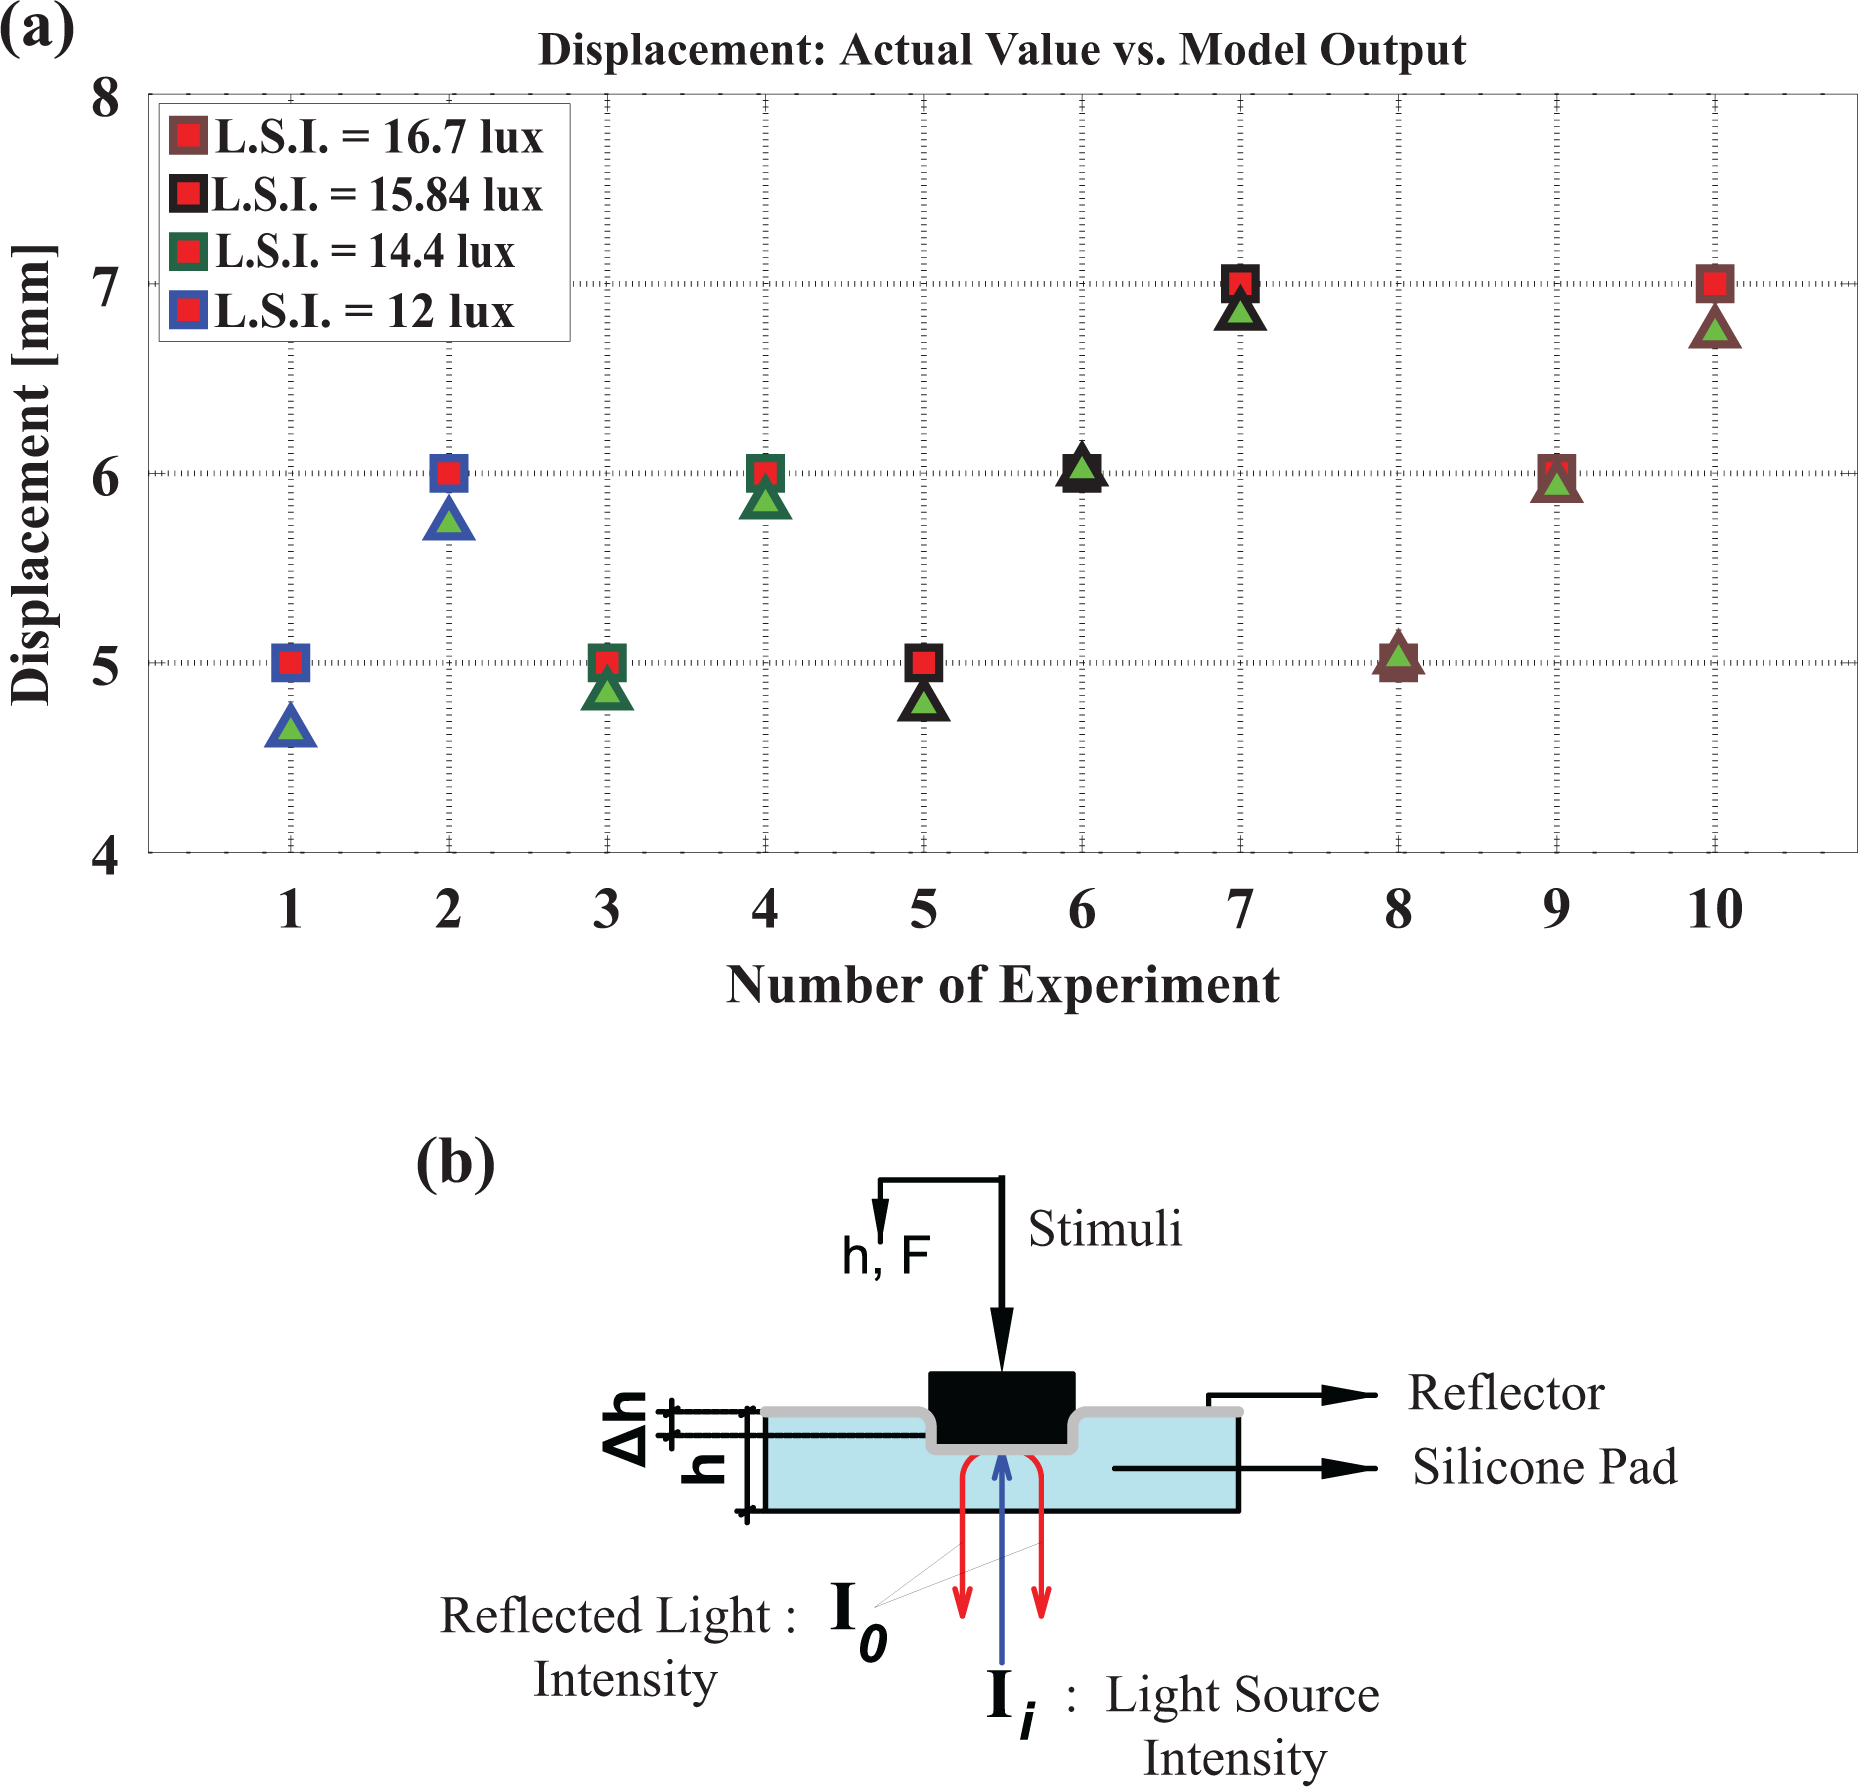
(a) Light intensity to displacement experiments for the verification of the model; and (b) schematic view explaining how a light beam travels in the sensor system when a stimulus applied. I o is measured and Δh is calculated. Σ, I i, and h are constants.
Ten different experiments are performed with different inputs and different light source intensity levels in order to quantify the mathematical model given in equation (3). In Figure 6, where L.S.I. stands for light source intensity, square marked values are the actual displacements and the triangle marked values are the mathematical model’s output. An experimental setup as shown in Figure 7 is used to perform the controlled experiments which revealed that the sensor system and the mathematical model worked well enough. The input (displacement) is controlled with a servomotor and the displacement is observed by an encoder.
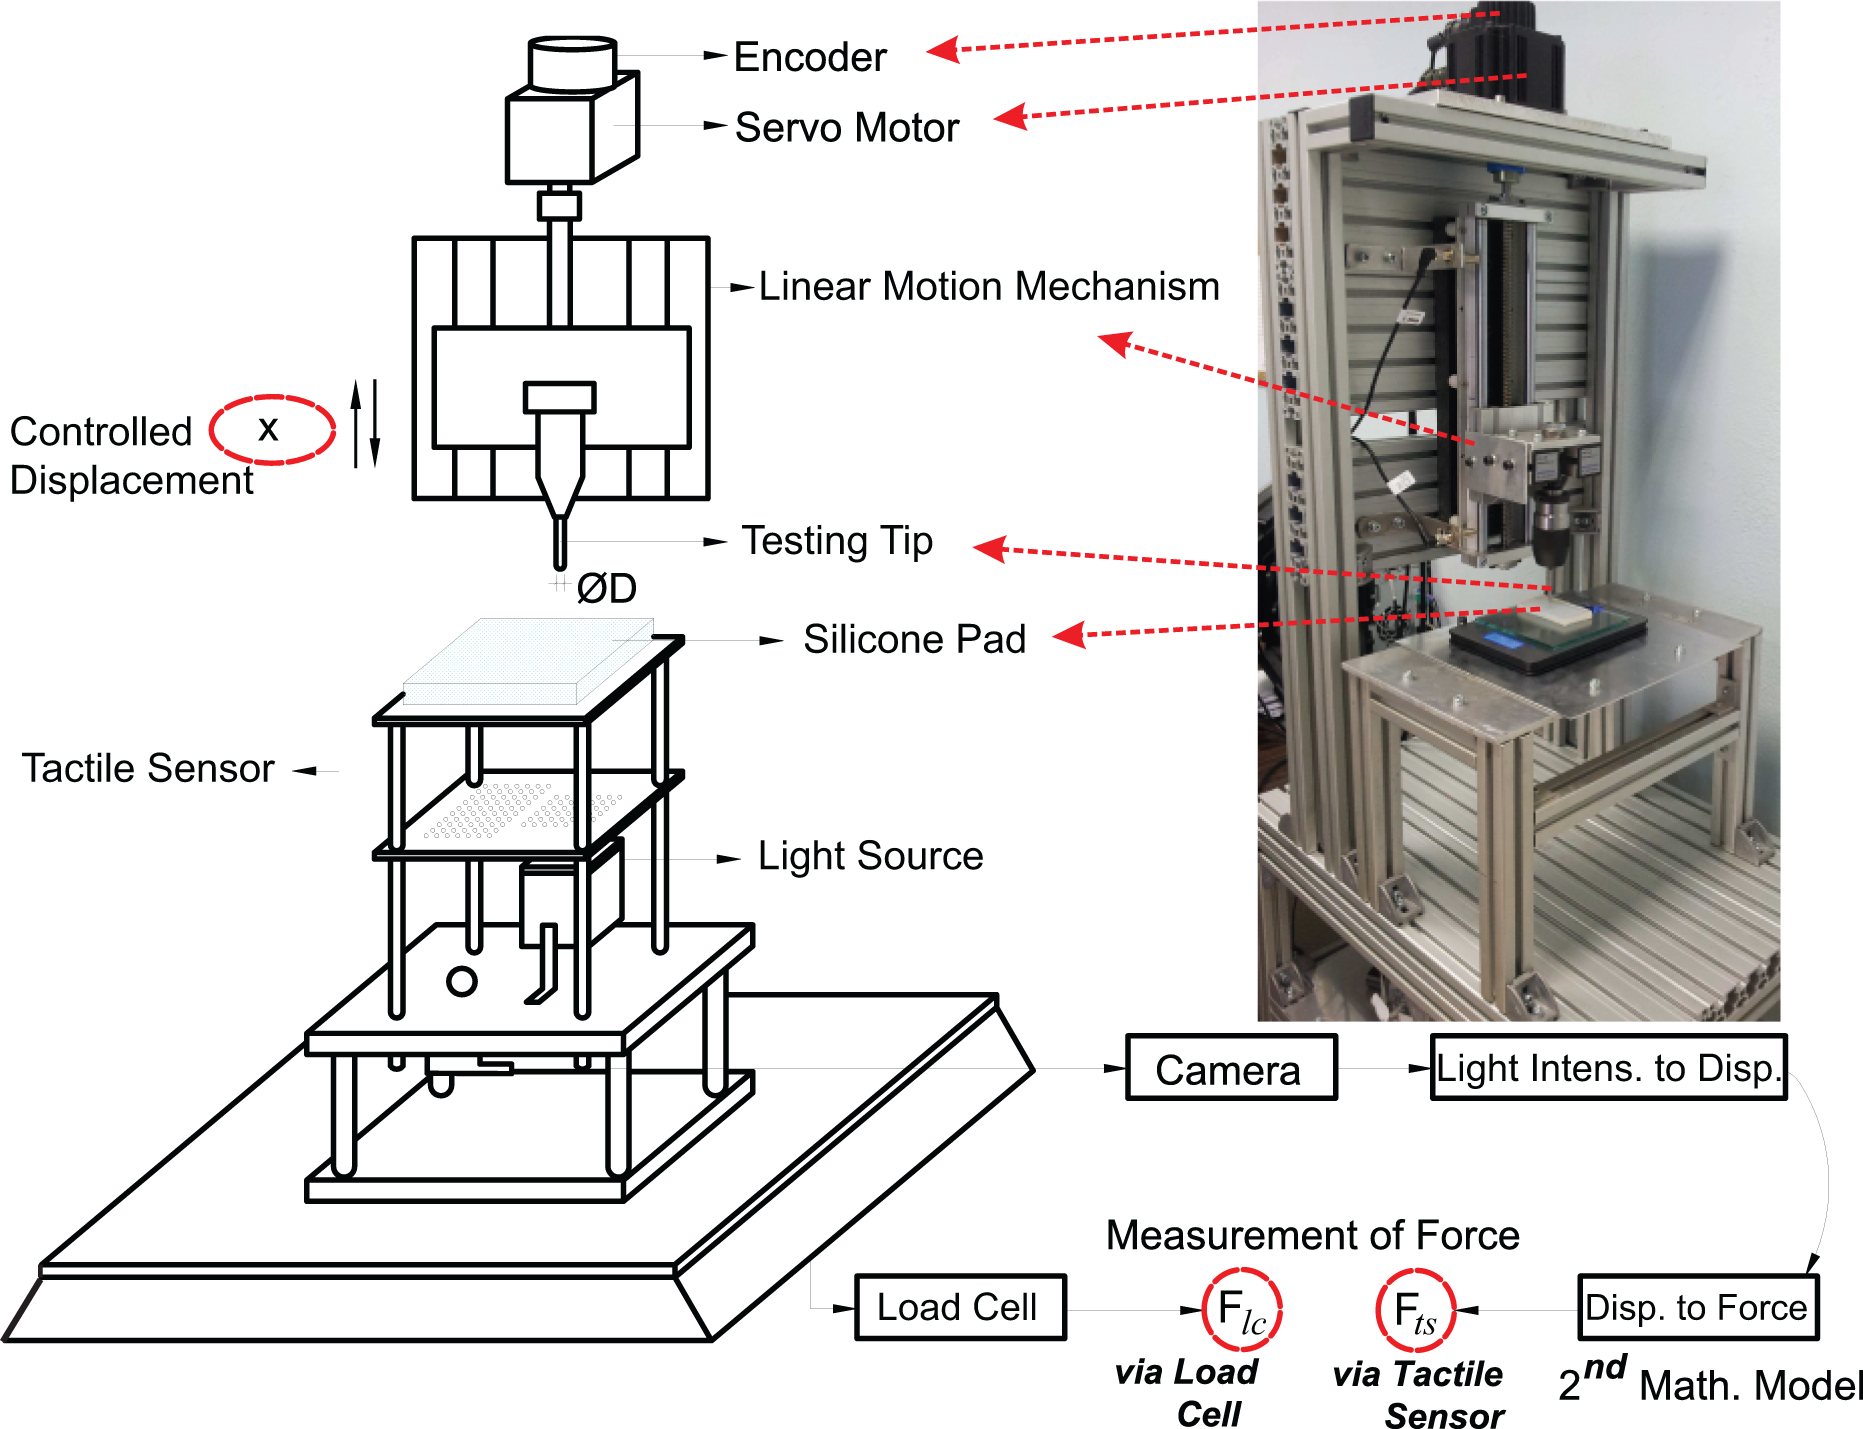
Block diagram of verification of the mathematical models and tactile sensors accuracy (and an actual photo of the experimental setup while doing investigation on a single silicone rubber pad).
Further analyses on the results of the experiments demonstrate that the overall average success rate of the prototype with this mathematical model for displacement measuring is 95%. This rate is the mean of the values obtained from equation (4) for every data points. Consequently, the mean error for measuring the distance is 5%

These experiments also show that if the intensity of light source is higher the success rate increases, this is because more allowed brightness makes the system less sensitive to environmental light disturbances. The silicone pad has 10 mm thickness; therefore, the experiments are limited up to 7 mm penetration to avoid plastic deformation.
Displacement to force model
The first mathematical model calculates the displacement value for each receptor. The second mathematical model calculates the force applied to each receptor. Since we obtained the displacements of each receptor, Δh, from the previous model, the force that causes these displacements can be calculated through the effective elastic modulus, E ∗, of the silicone pad by the aid of the method of dimensionality reduction, 42,43 where d is the diameter of the receptor. Then, the force and the pressure on each receptor can be calculated by equations (5) and (6), respectively. Subscripts i, j denote the Cartesian x, y positions of each receptor (see Figure 1)


This method is valid for contacts that are in the range of elastic deformation. This method does also match with Hertzian contact theory. One can look at the proofs of the method in the literature. 42,43 The introduced mathematical model is verified with an experimental setup in which the input (force–displacement) is controlled with a servomotor and the applied force (stimulus) is observed by a load cell.
The experimental setup in which a linear motion stage is driven by a high precision 1.5-kW Delta AC servomotor is shown in Figure 7. The displacement resolution of the system is 0.0005 mm (5/10000), since a 10000 PPR encoder and a linear motion system with 5-mm step size has been used. The servo system is controlled via ART USB1020 motion control card, which is capable of performing any test procedure.
A puls electronic, PS-4X series platform type load cell with 0–60 N range and 0.012 N resolution, has been used. The calibration has been performed by the retailer, but it is also double checked by known weights. Load cell lays under the prototype to measure the applied force. The damping of the prototype structure has been neglected, and the output of the load cell is assumed to be absolutely true and it is regarded as the reference measurement in further evaluations. As shown in Figure 7, F lc is the force that is measured by the load cell and F ts is the force that is measured and calculated by the tactile sensor system.
Results
The results obtained by the experimental setup (see Figure 7) demonstrate the accuracy of the measurement of the system and prove that the proposed tactile sensor works in acceptable limits as well as the mathematical models are also valid enough. In order to reveal the performance of the proposed tactile sensor more explicitly, hereupon, a series of experiments with a cylindrical type testing tip with 6-mm diameter have been conducted. The system is tested for 0 - 15 N force inputs up to 20-Hz frequency. These experiments included single point and normal force inputs only and the testing tips applied force into the middle of the silicone pad. Eight selected graphs, including the load cell’s (reference) and the tactile sensor’s outputs, are given in Figures 8 to 11.
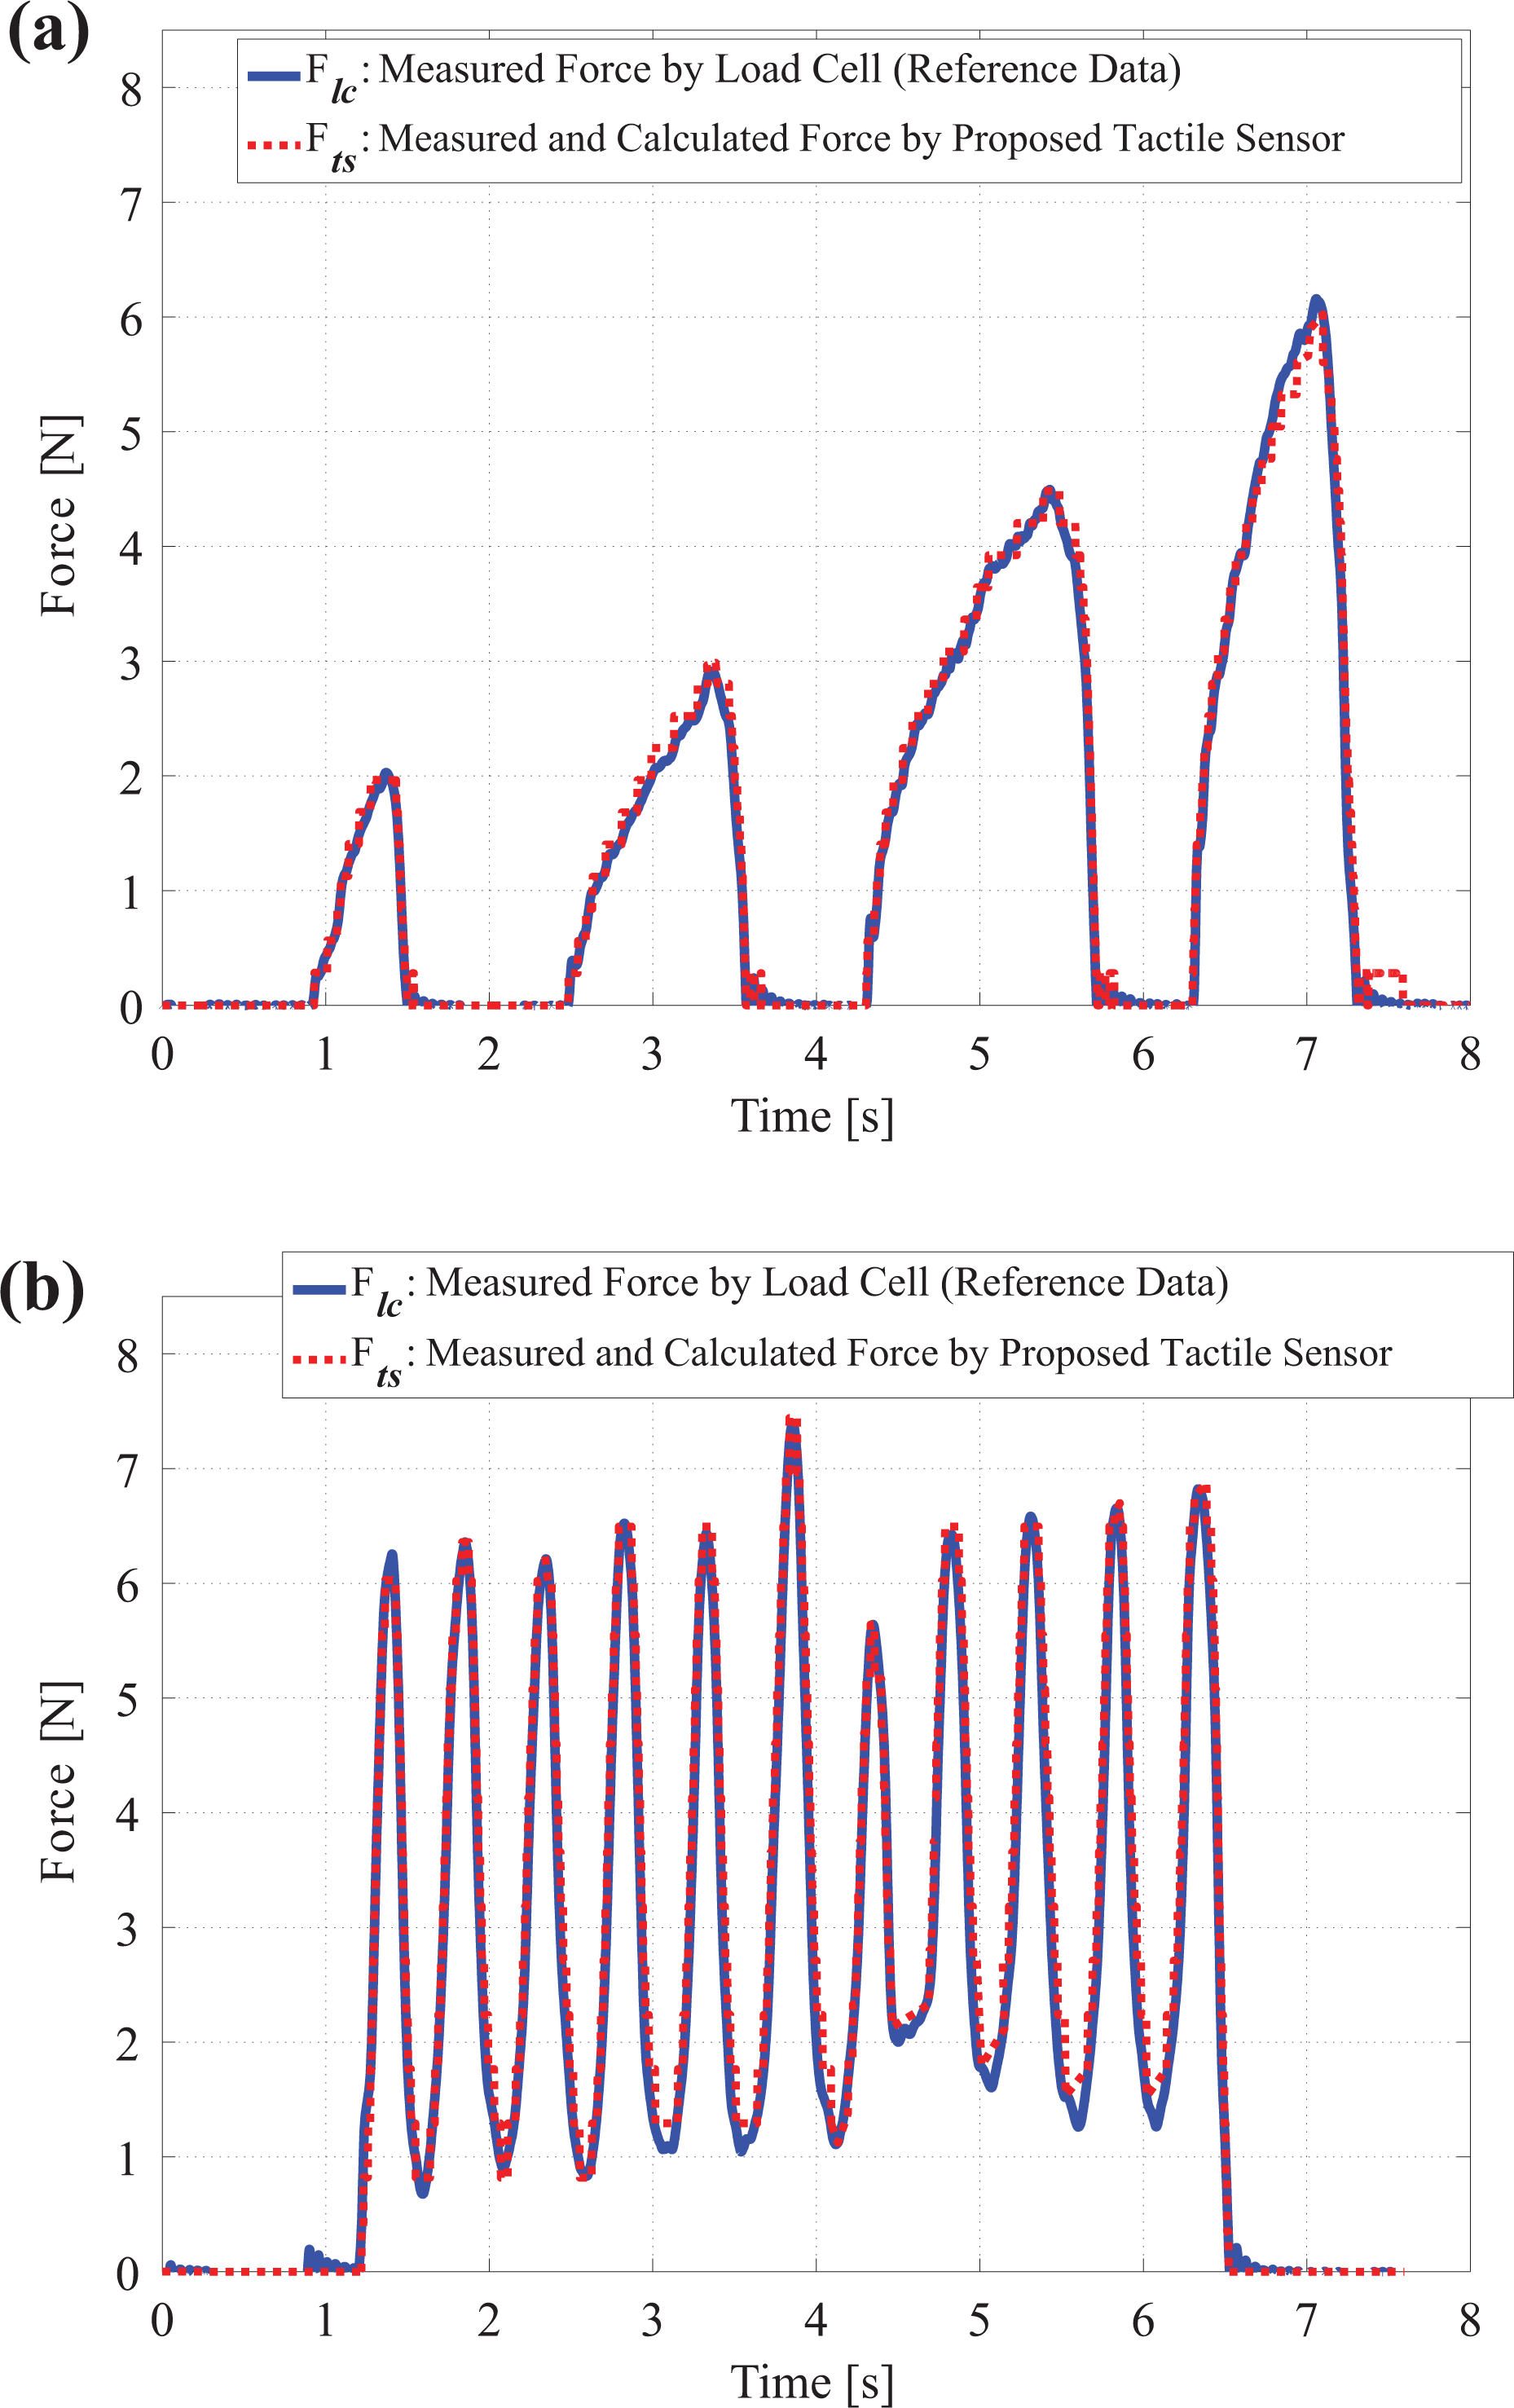
Experimental verification of the displacement to force model and sensors performance for (a) increasing force input and (b) sinusoidal force input.

Experimental verification of the displacement to force model and sensors performance for (a) ramp input and (b) multiple and high value of force input.
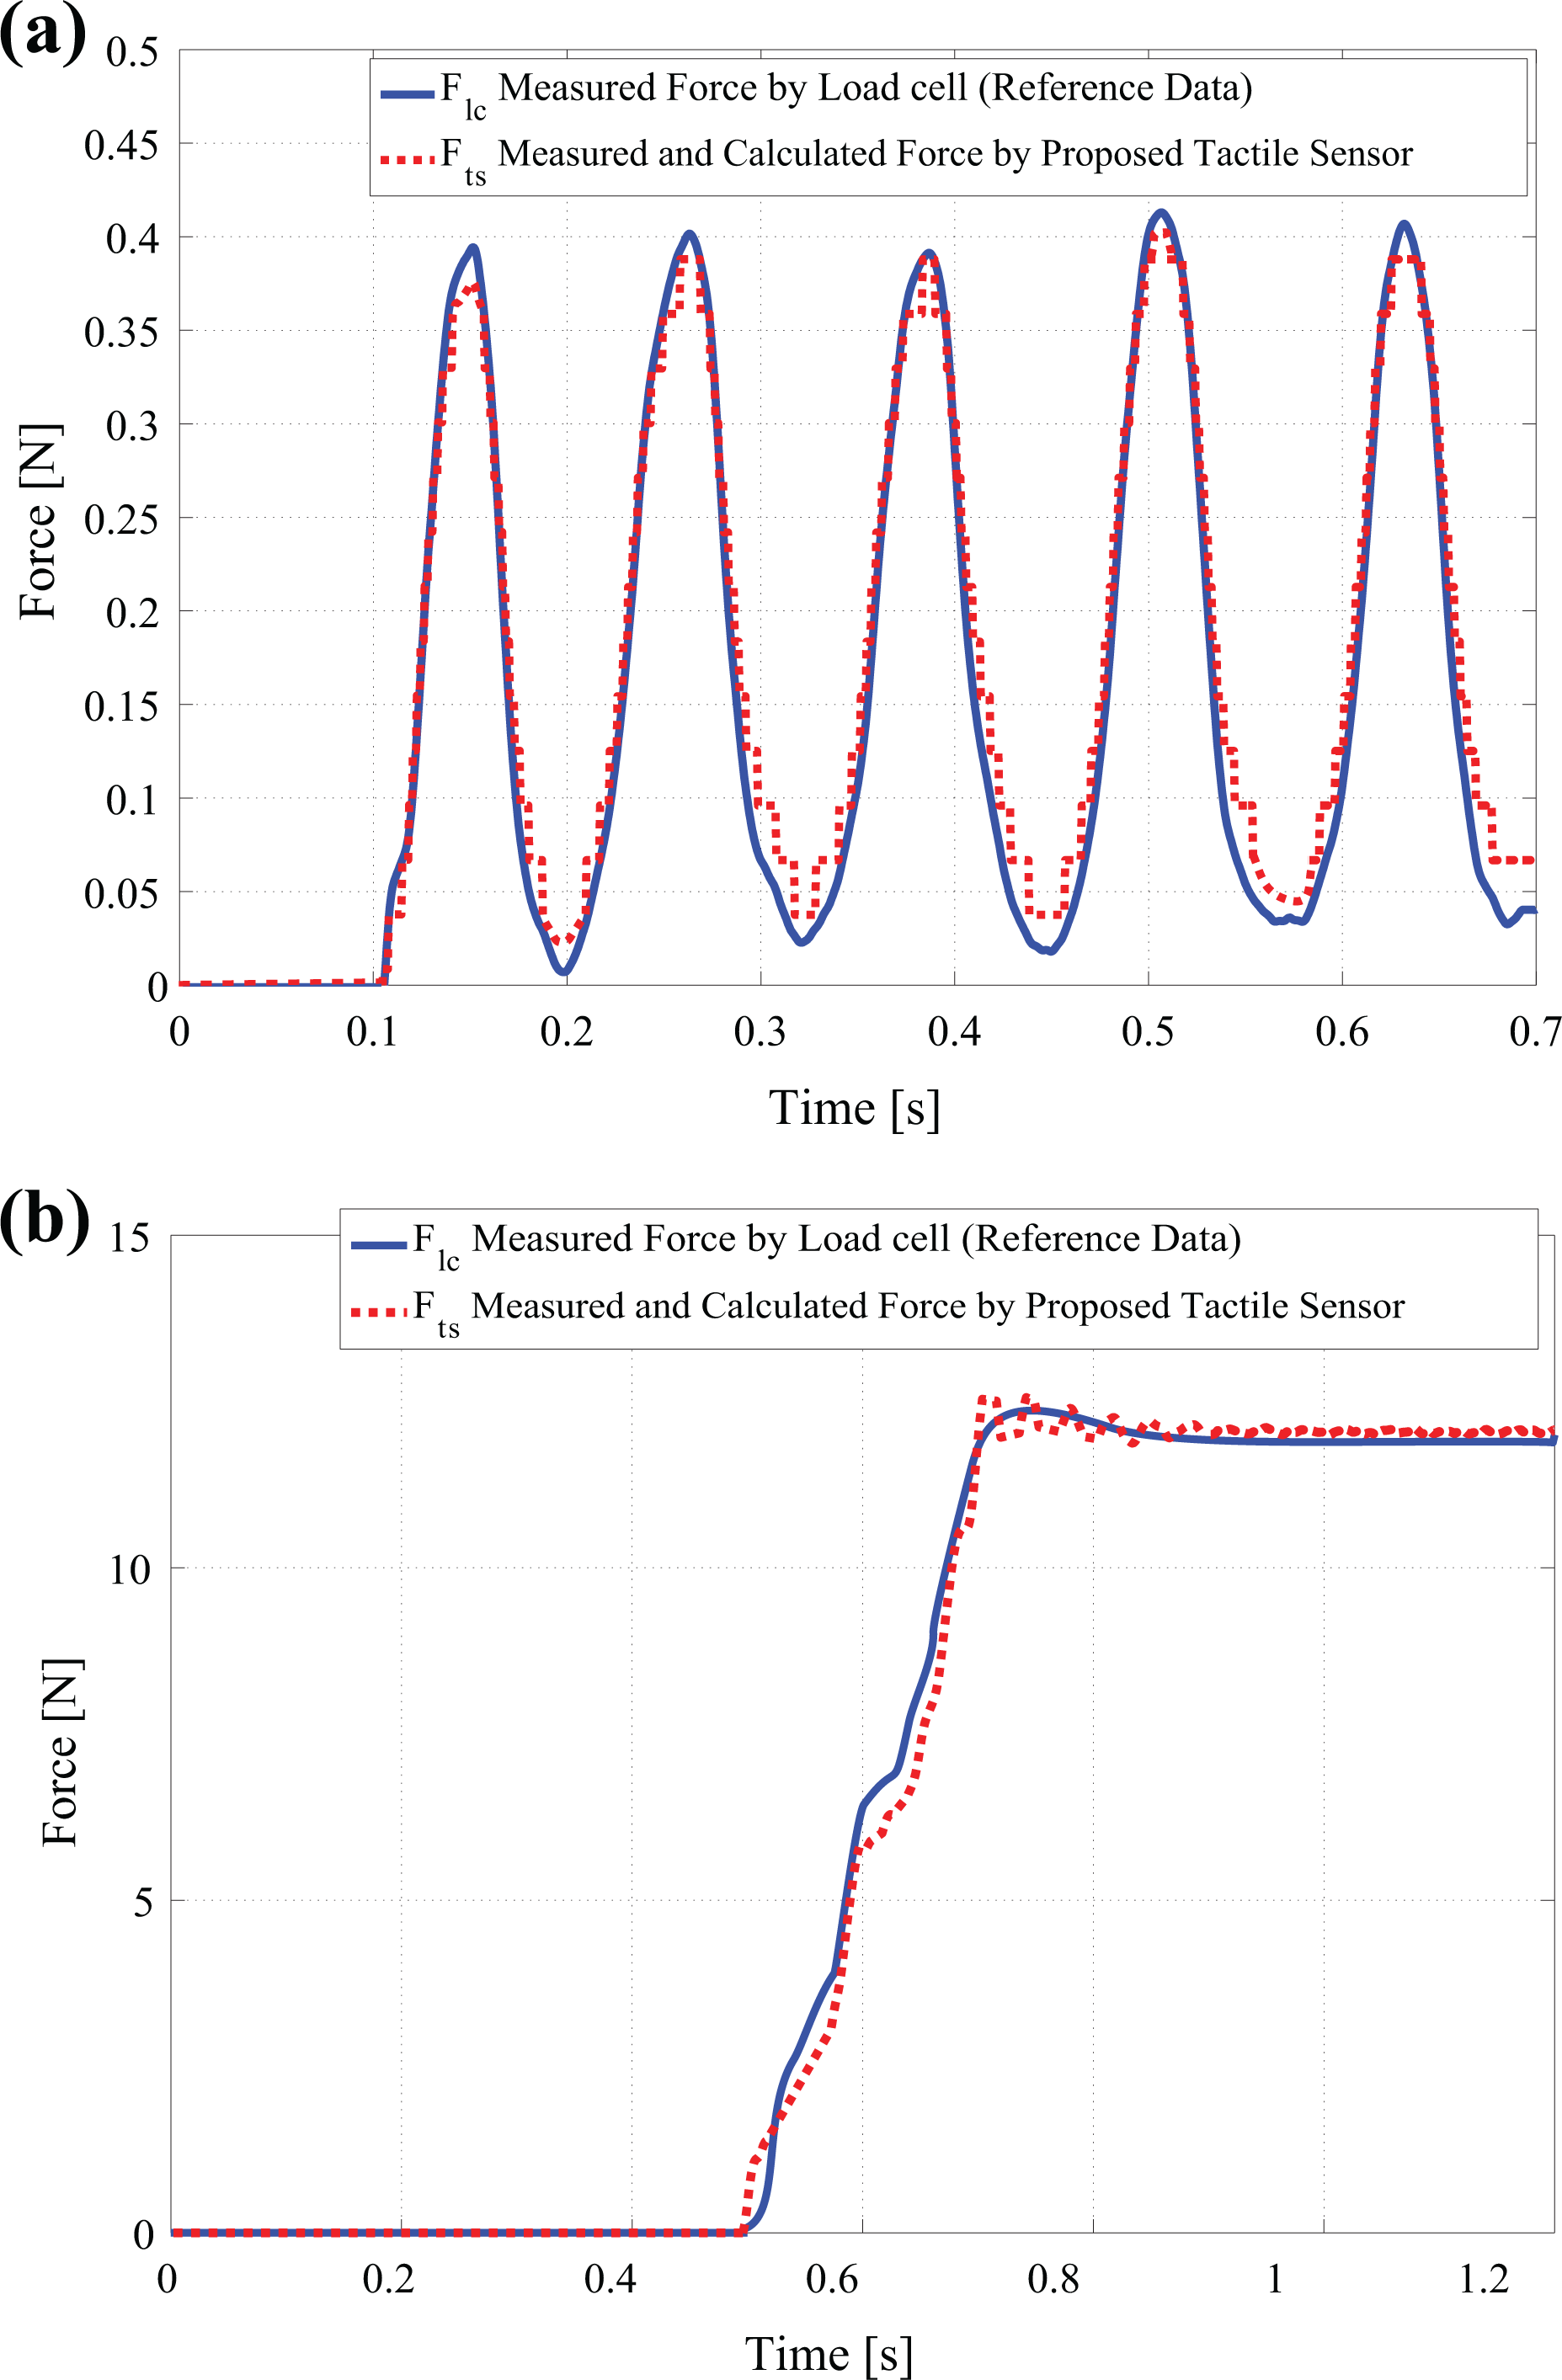
Experimental verification of the displacement to force/pressure model and sensors performance for (a) high-frequency sinusoidal force input and (b) step input.
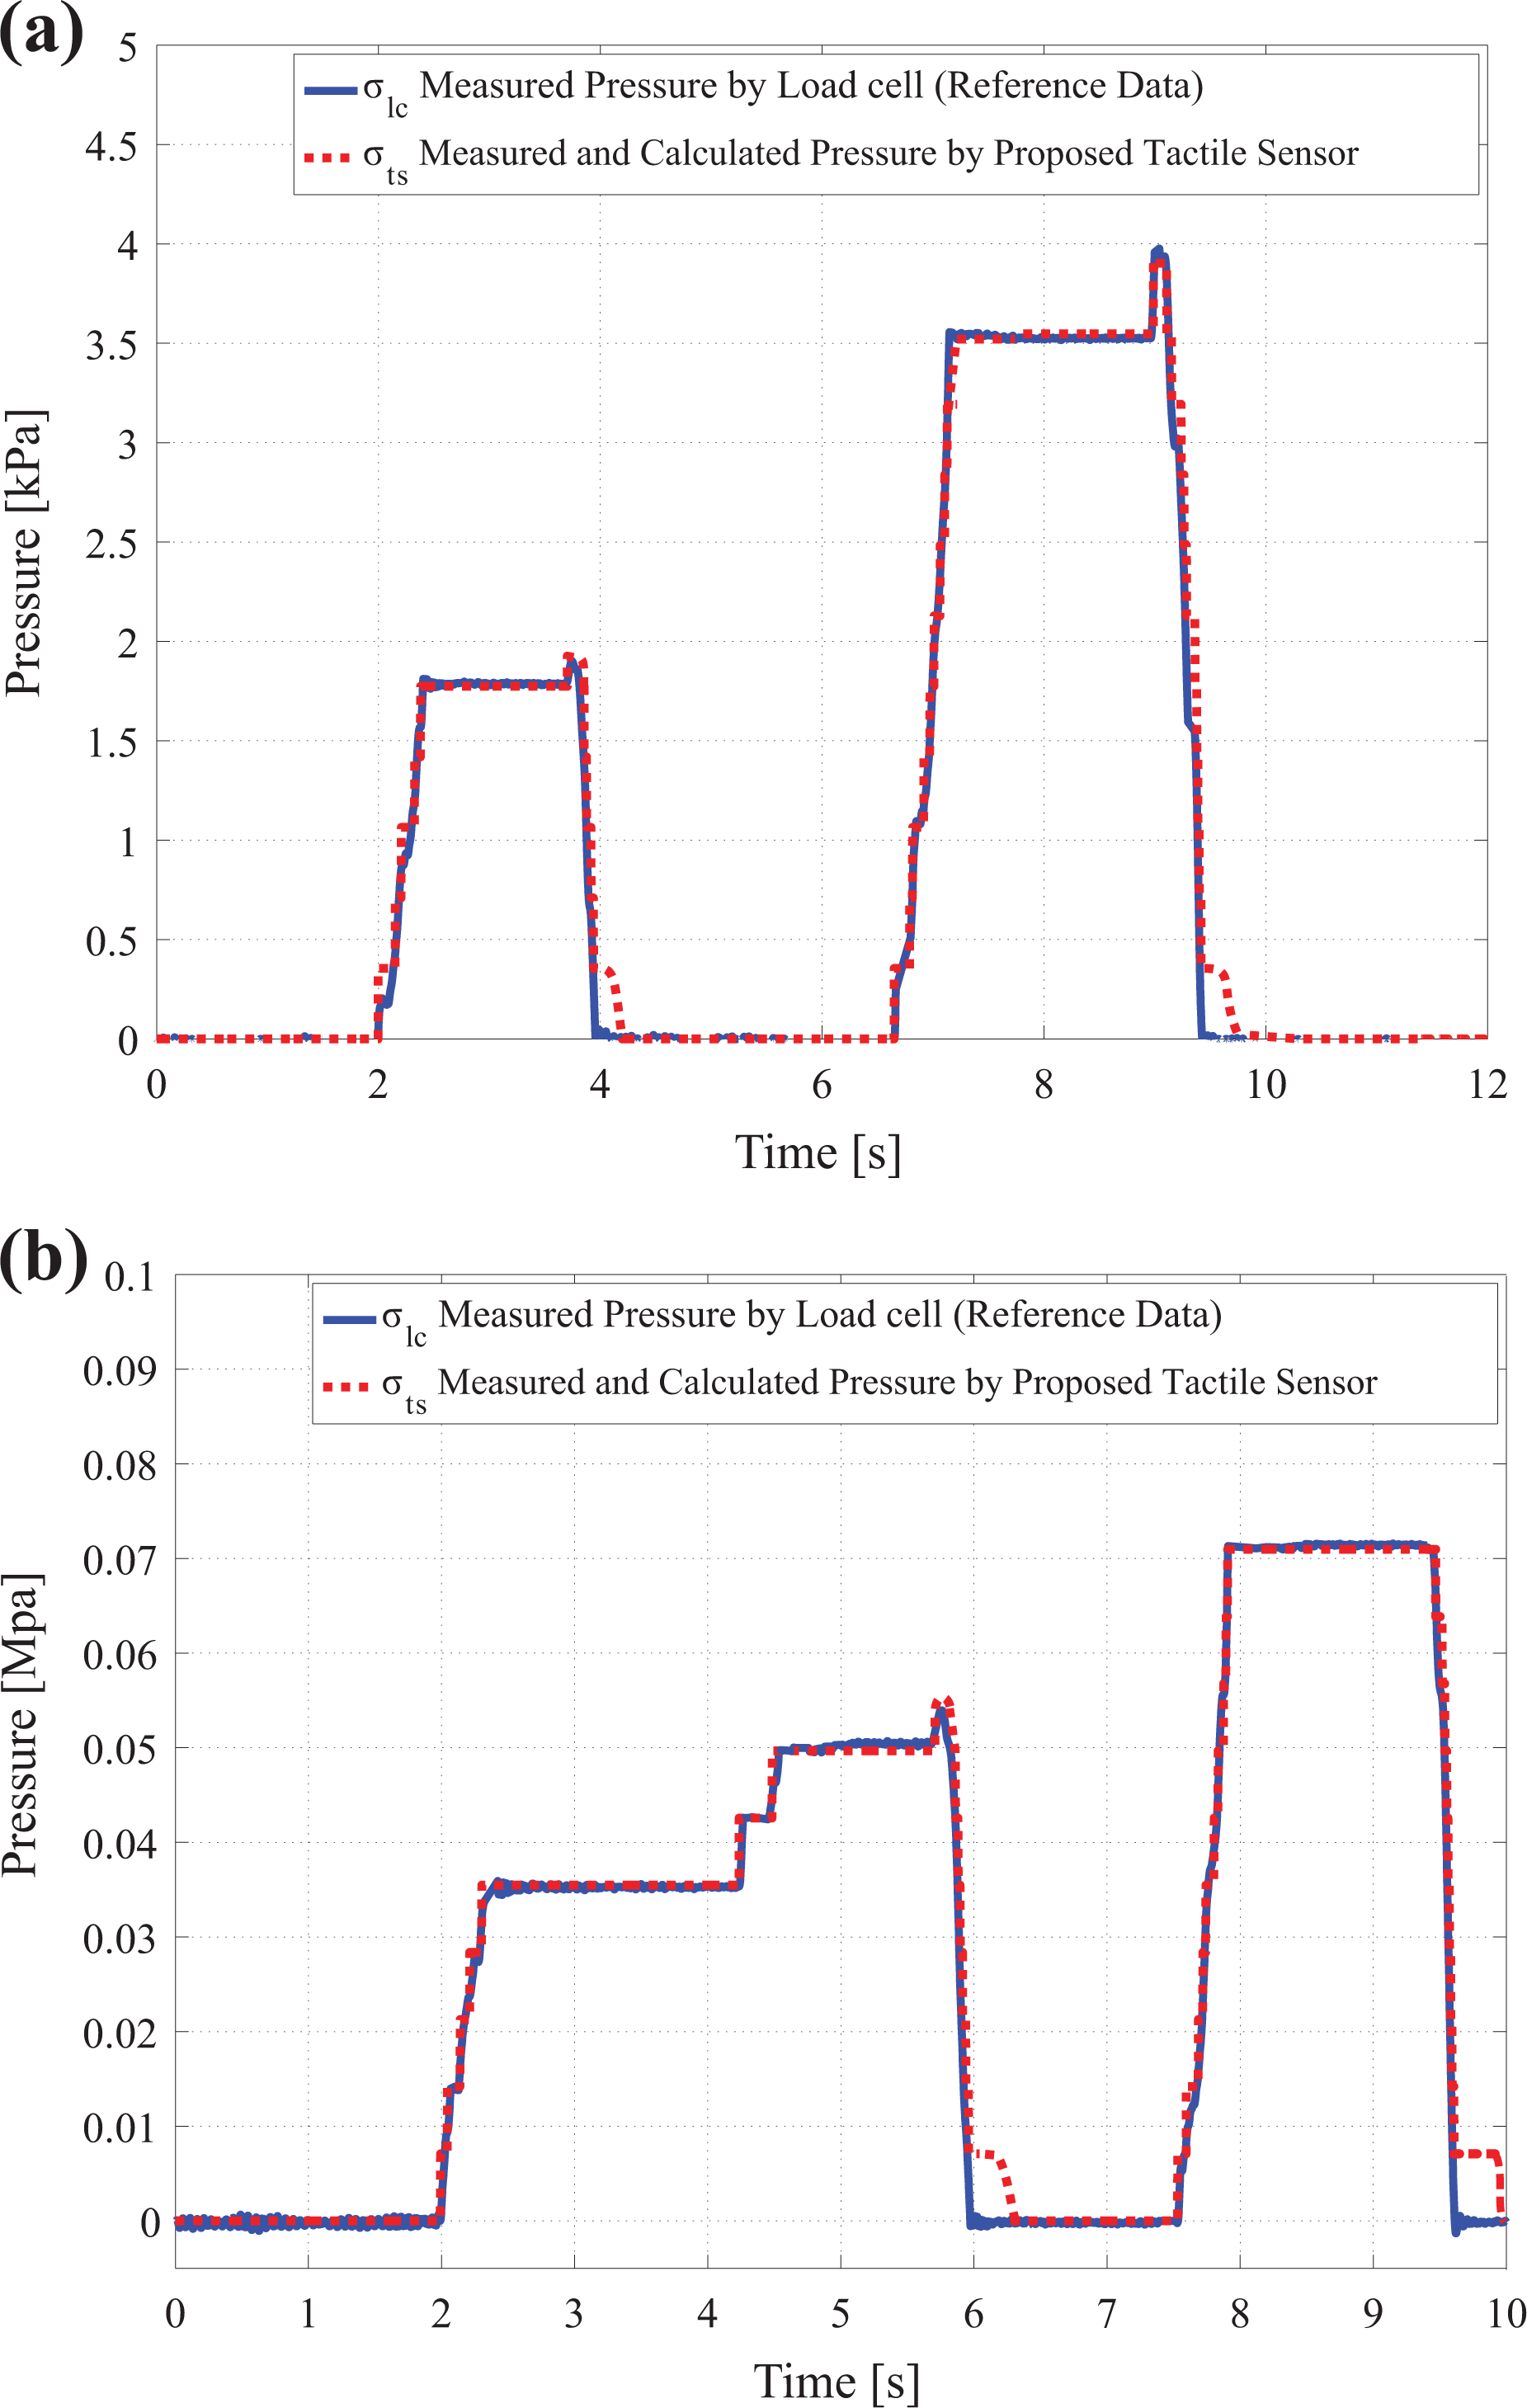
Experimental verification of the displacement to force/pressure model and sensors performance for (a) low value of pressure input and (b) high value of pressure input.
Different experiments in terms of the dynamics of the stimuli have been conducted to demonstrate the performance of the proposed tactile sensor. The experimental procedures included increasing force input, sinusoidal force input, step force input, two-level step force input, ramp force input, and increasing and decreasing force input. The overall performance of the tactile sensor is determined by normalized root mean square method via equation (7), where, “‖…‖” indicates the two-norm, “i” is the number of experiment, “xref” is the reference data, and “x” is the measured data. If the measured data “x” is identical to the reference data “xref,”, then the performance is 1, meaning perfect (error free)

The overall performance of the system has been evaluated as 93% (see Figure 12). Although it is not so ideal to compare a prototype with a commercial product, one should notice that the accuracy error is given as 5% for PPS 5226. 41

The overall performance of the system based on goodness of fit.
As mentioned before, the noise rising from the manufacturing defects influences a decrease in the accuracy.
The authors think that this success rate can be increased with a better manufactured sensor and also using infrared light instead of visible light, since using infrared light source and infrared camcorders would provide a strong immunity to the environmental light disturbances.
Hysteresis may occur for silicone material especially when the stimulus has a higher force value and duration as shown in Figure 11(a) and (b). This effect does not exist or it is negligible for the stimulus which has lower duration, as shown in Figure 10(a) and (b). Overall, the effect of the mechanical hysteresis of the silicone rubber pad has been tolerated, yet deteriorating hysteresis effect might be valid depending on the choice of the silicone rubber pad substance.
This prototype is the first application of the proposed design and the overall performance demonstrated and proved that the proposed novel system is properly working.
Concluding remarks
A tactile sensing system that can cover large areas of a robot body conforming to its outer shape with similar features of natural skin at low costs is invented. There are three main parts in the sensor system: the silicone rubber pad, fiber optic cable set, and the computation unit. The silicone rubber pad, where the measurement is realized, and the fiber optic cable set, which provides the signal flow, are flexible and bendable. In addition, multiple measurement surfaces can be used with a single computation unit. Therefore, the proposed tactile sensor can be used in different applications, such as robotics (to provide better control in grasping or, etc.), medical/surgical devices (to provide a better feeling with more receptors—for remote operations (haptics) or to produce human-like prosthetics with senses), space suits (to provide actual sense of touch), and so on.
The tactile sensor system that is demonstrated in this article is an optic-based tactile measurement device. The outstanding and highlighted features of the design are high spatial resolution, multi touch capability, being insensitive to magnetic disturbances, being inexpensive, and being flexible and bendable.
In this work, a prototype is manufactured with 1-mm spatial resolution, mimicking the dexterity of a human fingertip. This prototype has 0.61-kPa pressure measurement resolution with 0–15.6 N/cm2 (0–360.36 N for entire prototype) working at a range of 30-Hz frequency.
Beer–Lambert model and method of reduction of dimensionality are used to evaluate the force/pressure, which requires some constants to identify the silicone pad and the reflector. An experimental setup is built to obtain necessary constants in which the input (force–displacement) is precisely controlled with a servomotor. The applied force (stimuli) is observed by a load cell as well as the displacement is observed with an encoder. This setup is used in characterizing of the silicone pad and demonstrating the performance of the tactile sensor system. Finally, it is shown that the proposed tactile sensor worked with 93% success rate for a wide variety of test inputs.
Supplementary material
Supplemental Material, Tactile_Sensor_Preview - A low-cost, human-like, high-resolution, tactile sensor based on optical fibers and an image sensor
Supplemental Material, Tactile_Sensor_Preview for A low-cost, human-like, high-resolution, tactile sensor based on optical fibers and an image sensor by Utku Büyükşahin, Ahmet Kırlı in International Journal of Advanced Robotic Systems
Footnotes
Declaration of conflicting interests
The author(s) declared no potential conflicts of interest with respect to the research, authorship, and/or publication of this article.
Funding
The author(s) disclosed receipt of the following financial support for the research, authorship and/or publication of this article: This work was supported by Yildiz Technical University BAPK Project No: 2013-06-04-DOP01, 2015-06-04-GEP01 and TUBITAK (The Scientific And Technological Research Council Of Turkey) 1512 - Project No: 2130185.
Supplementary material
Supplementary material for this article is available online.
References
Supplementary Material
Please find the following supplemental material available below.
For Open Access articles published under a Creative Commons License, all supplemental material carries the same license as the article it is associated with.
For non-Open Access articles published, all supplemental material carries a non-exclusive license, and permission requests for re-use of supplemental material or any part of supplemental material shall be sent directly to the copyright owner as specified in the copyright notice associated with the article.