
Abstract
Brain–computer interfaces are emerging as an important research area and are intended to create an understanding between a computer and the human brain to ensure that robot–human interactions become more intuitive and user-friendly. However, encoding of brain information to derive the intended motion of the user in real time continues to present a problem with respect to the control of wearable robots with multiple degrees of freedom. In this study, a new approach to control several degrees of freedom in a wearable robot is proposed and its feasibility is studied by estimating the user’s motion intention in real time, in terms of the user’s intended tasks to perform, by using electroencephalography signals measured from the scalp of the user. A time-delayed feature matrix is introduced to provide inputs to neural network and support vector machine-based classifiers that harvest the dynamic nature of the electroencephalography signals for motion intention prediction. The experimental results indicate the effectiveness of the proposed methodology in the estimation of user motion intention, in terms of intended task to perform.
Introduction
A brain–computer interface (BCI) provides a method of communication between the human brain and an external device that is based on the neural activity generated by the brain and is independent of normal output pathways such as the peripheral nerves and muscles. 1 Recently, both noninvasive 2 –10 and invasive 11 –16 BCI technologies have been proposed for various purposes. The ultimate goal of BCI studies is to enable anthropomorphic movement of wearable robotic devices, such as a prosthesis 17 –19 or exoskeleton 20 –22 acting as an assistive device, 4 based on the intended motion of the user in real time for more effective use of these devices in assisting with activities of daily living (ADL or ADLs) or rehabilitation tasks. These devices correspond to highly dexterous robotic devices with multiple degrees of freedom (DoFs). Therefore, the control signals should be capable of actuating all required DoFs of these robots when wearable robots are controlled. Consequently, several DoFs of motion must be determined using an electroencephalography (EEG)-based method or another motion intention identification method. To date, several different motion estimation methods 4,5,7,13,23 –27 have been proposed for each specific BCI application.
In one previous study, 23 a prosthetic hand was operated with 1-DoF for its open and closed positions by classifying EEG patterns that occurred while the user imagined left- and right-hand movements. Palanker et al. 24 proposed an EEG-based control architecture for a wheelchair-mounted robotic arm. Their method used visual stimulation of the subject provided via a visual matrix that includes either a symbolic array or an alphabetic array that corresponds to the required motion. In another previous study, 5 Hayashi and Kiguchi proposed a neural network–based method to identify the intended motion of the subject. Their method predicted whether the subject’s intention involved either moving or not moving the hand within a single DoF.
Additionally, several studies 4,7,13,25 –27 also attempted to identify the intended motion of the subject with respect to the intended task. Pfurtscheller et al. 25 examined the reactivity of the EEG rhythms (known as mu rhythms) in association with the subject imagining movement of the right hand, the left hand, the foot, and the tongue and attempted to discriminate each individual task using the mu rhythms. Another method based on principal component analysis and a support vector machine (SVM) classifier was proposed by Vallabhaneni and He 26 to classify the movements of the left and right hands. In an extant study, 27 a steady-state visually evoked potential (SSVEP)-based meal assistive robot was proposed. In this method, the subjects selected any solid food item that they wanted to eat from three different bowls by looking at the light-emitting diode (LED) matrices corresponding to those bowls, which were blinking at different frequencies. The SSVEP generated was then used to control the multi-DoFs meal assistive robot. In a previous study, 4 a motor imagery-based robotic arm control method was proposed to perform reaching and grasping tasks. In this method, the subjects performed motor imagery-based tasks to control different cursor movements on a computer monitor, and the same motor imagery commands were later extended to control a robotic arm with multiple DoFs when performing reaching and grasping tasks.
In most of the studies mentioned above, the motor imagery or motor execution by the subject that triggers the EEG pattern differs from the motion that is generated by the robot. In contrast, the intended motion of the subjects could be predicted using different means. Most studies followed an approach in which they defined a third-party brain trigger for a selected DoF or task. Furthermore, in a few of these studies, the subject operated only a single DoF of the robot or the simultaneous operation of several DoFs was not possible, so this did not provide an intuitive user experience when performing ADLs.
Conversely, two different approaches were proposed to identify the intended motion of the user. One method involved prediction of the direction and the speed of the joints that the user wanted to actuate. In this case, a number of individual joint motion predictions were necessary to predict a user’s upper-limb motion. In this approach, the prediction complexity increases with the introduction of each additional DoF. In another approach, it was possible to identify the ultimate goal of the user’s intended motion and the guide the robotic device from the initial position to the required end position. In this case, it was necessary to predict the intended motion in terms of the user’s intended task, and the prediction complexity was independent of the number of DoFs involved. A few of the above studies 4,5,23 also attempted to predict some motor tasks. However, with the exception of one study, 27 none of the other studies examined or predicted ADLs, although this is more important in the control of wearable robots.
In summary, the available BCI techniques that can be used to operate wearable robotic systems include one or both of the following drawbacks, which do not correspond to the control requirements for wearable robots. Either the techniques do not provide the user with adequate DoFs to allow the required ADL tasks to be performed or the motor imagery/execution that is used to trigger the EEG is not always similar to the output from the robot. Therefore, the robots cannot be controlled intuitively. In addition, EEG signals contain dynamic information about the intended motion, and the available methods do not understand this dynamic information accurately.
This study therefore proposes a new approach to control several DoFs of a wearable robot by estimating the user’s motion intention in real time, in terms of the user’s intended tasks to perform, by using EEG signals measured from the scalp of the user. The study is expected to correspond to an initial one to perform the same tasks using noninvasive BCI techniques, for example, EEG. Initially, the locations and frequency ranges of the required brain activations are identified for each task during an offline analysis. These brain activations are triggered by the same tasks that would be performed by the robot. The information from the offline analysis is used along with a time-delayed feature matrix to provide input to the classifiers, and this helps the classifier to understand the dynamic nature of the EEG features that are introduced in the proposed method. Neural network– and SVM-based classifiers are also used to predict the intended motion in real time. Subsequently, the effectiveness of the neural network–based classifier and that of the SVM-based classifier are both compared to that of the proposed approach, which is used to control several DoFs of a wearable robot to perform a similar intended human motion in real time using a suitable kinematics model for the selected tasks. The next section presents the study methodology and the following sections present the results and a discussion of the study. Finally, our conclusions are presented.
Method
The proposed methodology for control of the wearable robot comprises a data collection process with a two-stage data analysis process, composed of offline analysis and real-time motion prediction, and an inverse kinematics-based motion generation process to control the robot. The key steps in the methodology are shown in Figure 1. Initially, the EEG data are collected from the test subjects for two ADL tasks. The subsequent offline analysis (shown in the dark background area in Figure 1) focuses on identification of the brain behavior because different brain regions are activated based on the task to be performed. Additionally, voltages with different frequency ranges are emitted by the brain when different tasks are to be performed by the body. Therefore, one important step in the development of a real-time controller for a wearable robot involves development of a better understanding of the locations in the brain and the range of frequencies that are generated for the tasks to be performed. In the next step, the subject-specific findings from the offline analysis are used to develop a more dynamic prediction methodology for real-time motion prediction.

Proposed approach for wearable robot control (dark background, offline analysis; , raw EEG;  , preprocessed EEG;
  , filtered EEG).
The current study focuses solely on prediction of the intended motion based on each subject’s EEG signals. However, as shown in Figure 1, the results are to be extended to control a multi-DoF wearable robot using an inverse kinematics model 28 that has been developed appropriately for the expected tasks.
To diminish the effects of the noise that is generated among the electrodes and to normalize the recordings across all channels, a step that is common to both processes involves initial calculation of the common average reference (CAR) as shown in the following, where N denotes the number of channels used in the recordings, Xi(t) denotes the raw EEG signal from the i
th channel at time t,

The details of each step in the process are explained in the following sections.
Experimental setup
In this study, EEG signals were recorded for six healthy male subjects who were all aged in the range of 24 to 28 years. A gamma.cap (Gtec Co., Germany) with 16 electrode locations, a g.Gammabox (Gtec Co.), and a biosignal amplifier (Nihon Kohden Co., Tokyo, Japan) were used to record the EEG signals of the test subjects. A standard 10–20 electrode system was followed for placement of the electrodes on each subject’s scalp and into the brain cap. Sixteen electrodes were placed at the F3, F4, F7, F8, C3, C4, T3, T4, P3, P4, O1, O2, Fz, Cz, Pz, and Oz positions, as shown in Figure 2(a). The sampling frequency for measurement of the EEG signals was set at 1000 Hz. The left ear lobe was used as the reference point for the EEG recordings.

Experimental setup. (a) The 10–20 electrode system and the channel locations. (b) The experimental platform.
The experimental platform is shown in Figure 2(b). In these experiments, the subjects were expected to sit on a chair in front of a table and perform two ADL tasks (i.e. movement of an object and drinking). The experiment begins with an audible cue to the subject: “Start.” The subject remained still for the first 10 s of the test. The subject was instructed to relax his hands on his legs when a task was not being performed. An object was placed on the table in front of the subject at 8 s, and the subject was instructed to perform the task of moving the object at 10 s, which involved moving the object from right to left following an audible cue corresponding to “Start.” The subject moved back to his relaxed position after moving the object to his left. Subsequently, there was a 4-s interval prior to the start of the next experiment. A cup was placed on the table in front of the subject at the time of 2 s within this interval. At the end of the 4-s interval, the audible “Start” cue was again given, and each subject performed the required drinking task by moving the cup toward his mouth in a manner similar to the ADL. The subject drank and then replaced the cup in its original position before returning to the rest position. The subject was intended to perform these tasks at a self-paced rhythm. These procedures were performed 40 times over a period of 357 s. The intervals between each task were randomly selected to be either 3 or 4 s in length. The order in which the tasks were performed was also random. The experimental task schedule for 24 of these tasks is shown in Figure 3.

Task schedule for 24 tasks in the experiment (1, movement; −1, drinking; 0, resting).
The experimental procedure was approved by the institutional ethical review board. All the subjects were given detailed written information about the experiments and were given a chance to clarify any doubts. Then the subjects signed a consent form to confirm their consent to participation in the experiment.
Offline analysis
During the offline analysis, the frequency distributions in the raw EEG signals were studied using fast Fourier transforms (FFTs), which are expressed as

where
Real-time prediction
The results that were obtained during the offline analysis procedure were used to create the feature matrix required for real-time analysis.
Feature matrix
The initial step for the real-time prediction process involves extraction of features from the raw EEG signals. In this study, the EEG band power 29,30 is used as the feature for the prediction algorithm. The EEG power band was calculated based on the results of the offline frequency analysis. Accordingly, the four channel locations that showed the best activation results were selected by observation for use in the real-time analysis in this study. The CAR-calculated EEG signals were then used to calculate the EEG power bands based on the results of the FFT analysis.
One major challenge in EEG-based studies involves understanding of the dynamic information, which changes over time. In this study, a feature matrix of time-delayed inputs is used by the classifiers for this purpose. Therefore, the feature matrix from the selected electrode provides three inputs to the classifier, as shown in equation (3), where IPi(t) denotes the input to the classifier at time t and EEGi(t) denotes the EEG band power in the selected ith channel at time t:

Therefore, the input training matrix dimensions correspond to

To determine Δt, neural network–based classifications were performed for three randomly selected data sets with different Δt values corresponding to 50 ms, 100 ms, 250 ms, 500 ms, 1 s, and 2 s. Following the evaluation, Δt was selected to be 1 s for the entire study because the highest classification accuracy was produced for Δt = 1 s.
Neural network–based prediction
Artificial neural networks are widely used to solve a broad range of classification problems. In this study, seven neural networks were trained: six networks were trained using one individual subject’s data and one was trained with the data from all the subjects. Each neural network consists of three layers: the input, the hidden, and the output ones. The hidden layer contains 30 neurons and was determined by comparison with the results for structures containing 20, 30, 40, and 50 neurons in their hidden layers. The neural network structure is shown in Figure 4. A sigmoidal transfer function was used as an activation function in both the hidden and output layers to calculate the outputs from each layer. Each neural network was trained using the error-back propagation algorithm and the feature matrix that was derived during the offline analysis process. The entire experiment accounts for three different tasks during the training of the neural network, that is, moving an object, drinking, and resting. With respect to the required training values, 1 was assigned to moving the object, −1 was assigned to drinking, and 0 was assigned to resting, as shown in Figure 3. The output during the prediction process from the neural network corresponds to the values ranging from −1 to 1 that are used to represent each of the above tasks. Therefore, six different neural networks were trained for the six subjects using each individual subject’s training data. A seventh neural network was trained using a combination of the training data from all the subjects.
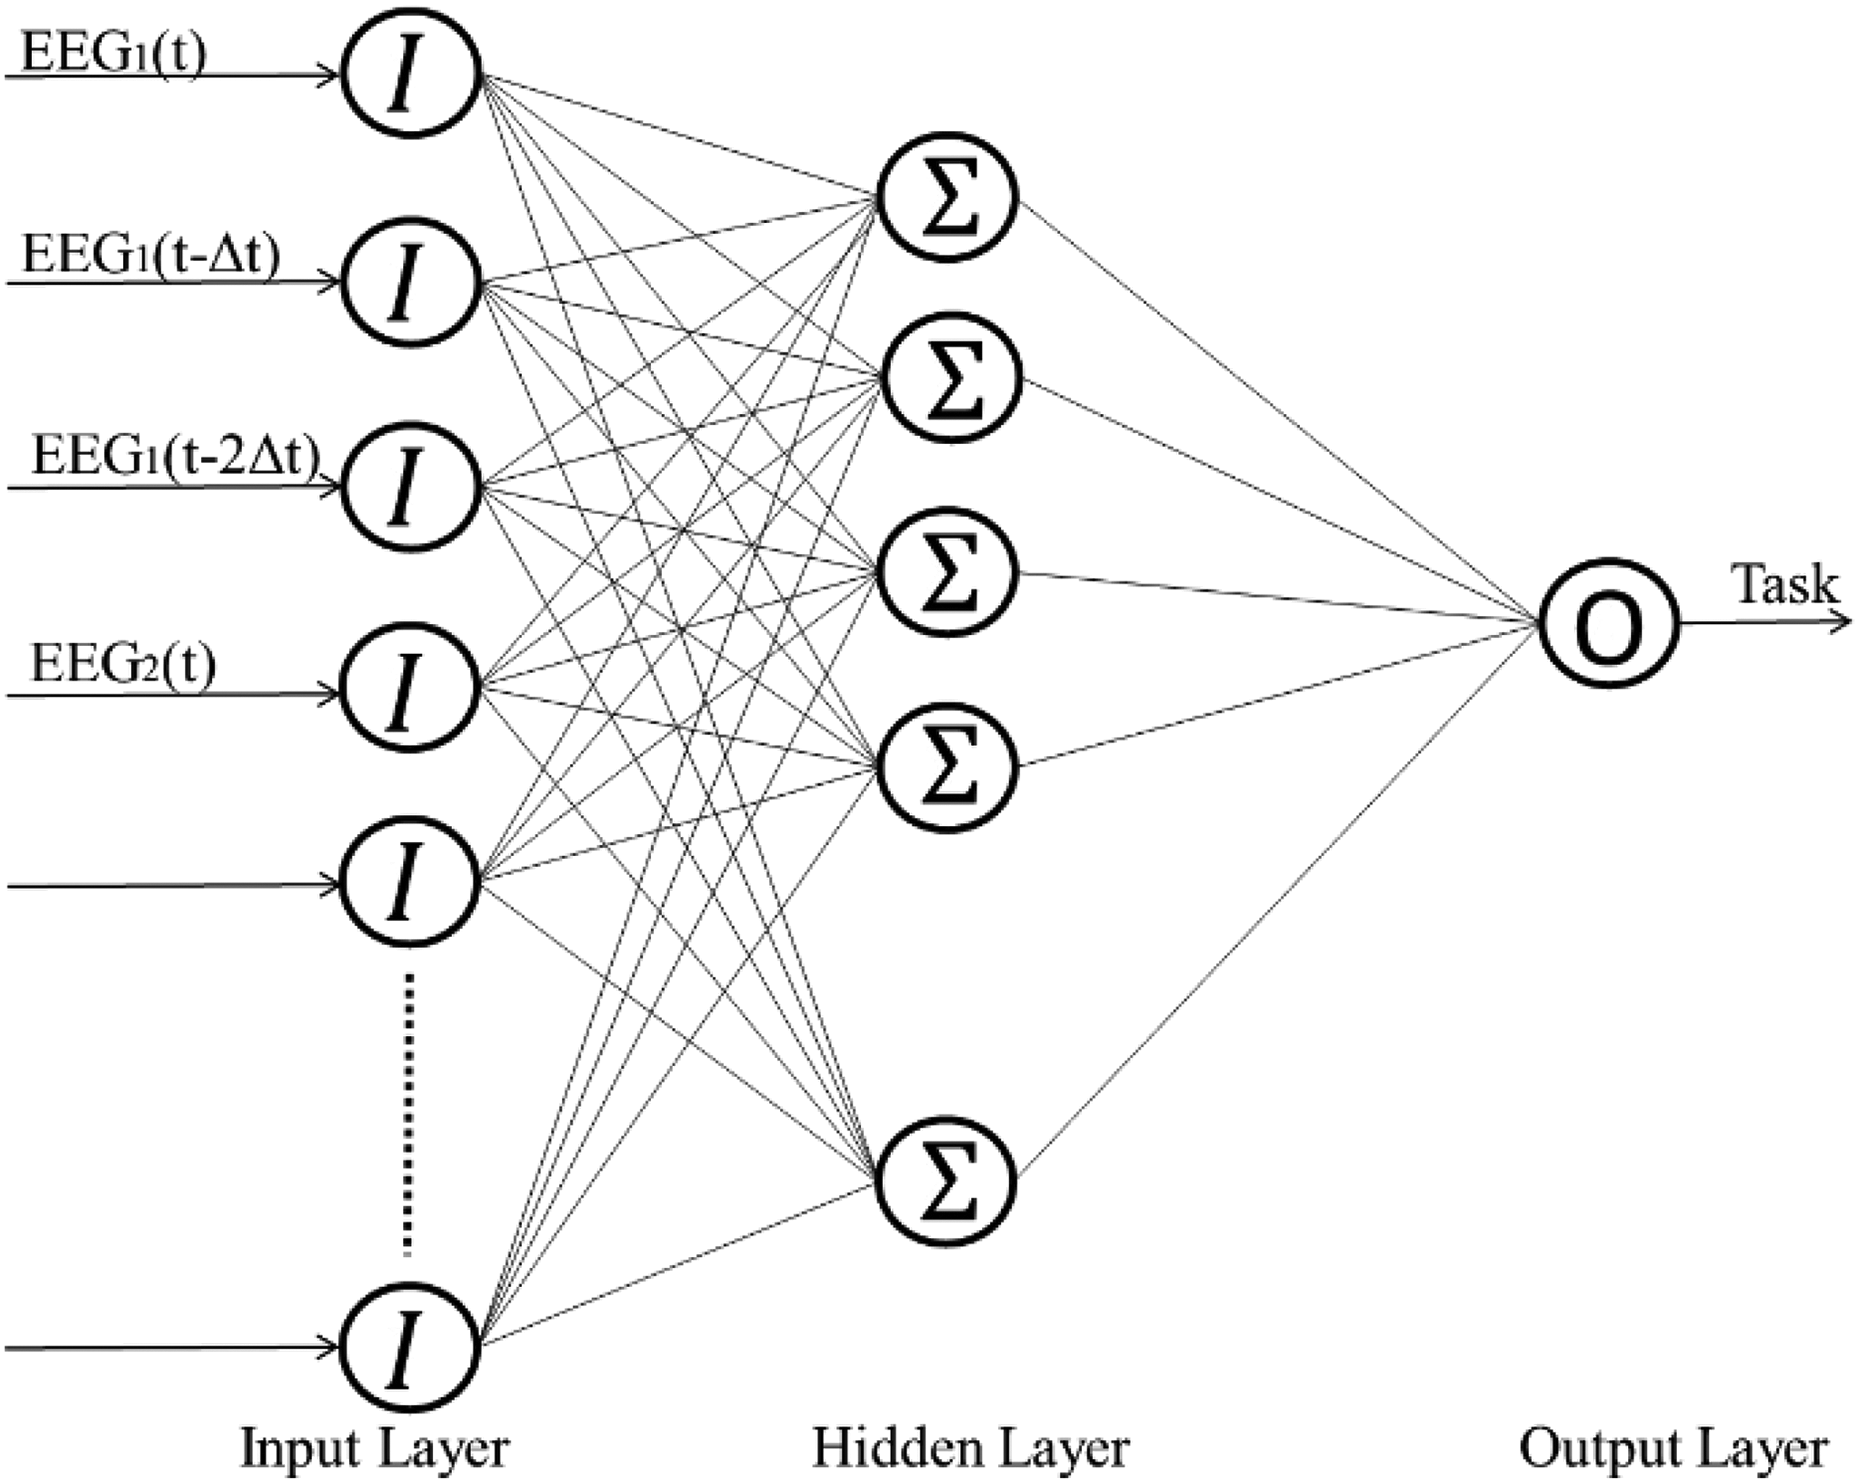
Structure of the trained neural network.
SVM-based prediction
The SVM 31 performs classification using linear decision hyperplanes in the feature space. During the training state, these hyperplanes are calculated to separate the training data using different labels. However, these data are transformed into a new vector space using a kernel function when it is not possible to separate the training data in a linear manner.
In the linear classification procedure, the hyperplane is calculated as shown in equation (5), which is upper bounded in terms of the margin as indicated by equation (6)


The SVM is also extended to perform multiclass classification. This study focuses on classification of a three-class problem. Given the choice of the use of one-against-many and one-against-one approaches in the SVM, this study used the one-against-one approach, which is more efficient for use with training data from the i th and j th classes, and the classification problem is solved as shown in equation (7): 31
Minimize

Subject to


The SVM classifier was implemented using the LIBSVM library. 32 A radial basis function was used as the kernel function. Additionally, C and ε were randomly selected to produce superior classification rates. In a manner similar to the neural network approach, six different SVM models were trained for the six subjects using their individual training data and a separate SVM model was then trained using a combination of the training data for all the subjects.
Results
Frequency analysis
The frequency analysis results show the distributions of the magnitudes of the frequencies for each channel. The frequency distributions of channel locations F7 and C5 for subject 1 are shown in Figure 5(a) and (b), respectively. Specifically, F7 shows good activation when compared with the performance of C5. For all six subjects, channel locations F7, F8, T3, and T4 showed good activation based on observation and comparison processes. These channels were therefore selected for use in the real-time prediction procedure. The activations were in the frequency range below 4 Hz in all the selected electrode locations above. The selected electrode locations and their frequency ranges were similar for all six subjects. The EEG signals from the selected channels were high-pass filtered at 4 Hz, and the resulting values were squared to perform the EEG power band derivation. The resulting time series activations of the EEG patterns at F7 and F8 are shown in Figure 6, where M denotes the object movement state and D denotes the drinking state. A rhythmic activation was observed in both channels for the object movement state. With regard to the drinking state, a certain degree of activation did exist, but no rhythmic pattern was observed. During the resting state, no activation was observed. The derived band power signals were then used to create the input feature matrix for the classifiers and a (3 × 4 × l) feature matrix was created and used as the input.

FFT results for electrodes (a) F7 and (b) C5 for subject 1. FFT: fast Fourier transform.

Activation of electrodes F7 and F8 (where D is drinking and M is moving).
Neural network–based prediction
The trained neural networks for the six subjects were then used to predict the intended task. The output from the neural network for the task prediction process is shown in Figure 7(a). This predicts values in the range of 1 to −1 for the expected tasks. The orange color indicates the expected output, and the blue color denotes the real output. The output signal from the neural network was rounded off, and the resulting output is shown in Figure 7(b). Similarly, the neural network that was trained using the data from all subjects was also used to predict the intended tasks of the six subjects individually. The results that were obtained from neural network–based prediction are summarized in Table 1. The prediction accuracies were calculated based on comparisons of the real and predicted classes at each instant in time. For the individually trained neural networks, the highest accuracy and the average accuracy for the resting state corresponded to values of 80.4% and 70.1%, respectively. For the object moving state, their highest accuracy and average accuracy values corresponded to 81.6% and 72.4%, respectively. For the drinking state, their highest accuracy and average accuracy values corresponded to 58.2% and 49.9%, respectively. The highest individual accuracy of 70.5% was achieved for subject 1. For all six subjects, the average overall accuracy was 65.8%. In addition to the accuracy, the latency between the real execution of motion and the prediction was calculated based on the time difference between the real and predicted starting points of the motion. The average latency corresponded to 300 ms for the individually trained neural network–based classifier, based on the average for all six subjects. For the neural network that was trained using the data from all six subjects, the highest accuracy and the average accuracy with respect to the resting state corresponded to 87.4% and 72.5%, respectively. For the object moving state, the highest accuracy and average accuracy values corresponded to 80.3% and 72.6%, respectively. For the drinking state, the highest accuracy was 80.2%, while the average accuracy was 59.5%. The highest individual accuracy of 74.8% was recorded for subject 2. The average overall accuracy for all six subjects in this case was 69.4%. The overall average latency for this type of neural network prediction was 250 ms.

Comparison of actual tasks with predicted tasks for the neural network (1, moving; −1, drinking). (a) Actual output from the neural network. (b) Rounded output.
Percentages of estimation accuracies for six subjects produced by the neural network–based prediction.

SVM-based prediction
In a manner similar to the neural network–based prediction case, the same data were used to predict the tasks intended by the subjects that used the trained SVM models. Figure 8 shows the task prediction results for two subjects. The orange color denotes the expected output, while the blue color denotes the real output. Table 2 shows a summary of the results for all six subjects. For the SVM models that were trained using data from individual subjects, the highest accuracy with respect to the resting state corresponded to 94.5%, while the average accuracy corresponded to 86.6%. For the object moving state, the highest accuracy was 83.8% and the average accuracy was 77.6%. For the drinking state, the highest accuracy was 59.8% and the average accuracy was 39.1%. Subject 2 showed the highest overall individual accuracy of 74.6%. The average overall accuracy for all six subjects was 73.1%. On average, the latency between the real execution of motion and the predicted execution was found to be 600 ms when using the SVM for all six subjects. In contrast, for the SVM model that was trained with the data from all six subjects, with regard to the resting state, the highest accuracy was 97% and the average accuracy was 90.4%. Additionally, a highest accuracy value of 84.3% and an average accuracy of 73.4% were recorded for the moving state. For the drinking state, the highest accuracy was 47.4%, while the average accuracy was 27.7%. However, the model recorded a lowest accuracy of 4.3% for the drinking state. The highest overall individual accuracy of 76.7% was recorded for subject 2. The average overall accuracy for all six subjects was 71.4%. The average latency for all six subjects between the real and predicted motions was 700 ms.

Comparison of actual tasks with predicted tasks for the SVM for two subjects (1, moving; −1, drinking).
Percentages of estimation accuracies for six subjects produced by the SVM-based prediction.

SVM: support vector machine.
Discussion
This study proposed the use of a motion-based task intention prediction method to control a wearable assistive device. The proposed method was used to predict three task states: moving, drinking, and resting of the upper extremity, using both neural network– and SVM-based classifiers. Initially F7, F8, T3, and T4 electrode locations were identified to have a better activation of the brain for the selected tasks, compared to the other electrode locations, in an offline study. Then the power band data were derived as feature inputs to the training of the classifiers. Each classifier was trained using two different types of data, including data from individual subjects and data from all six subjects. Therefore, four predictions were made for each individual subject. A summary of the results of the four predictions for all six subjects is shown in Figure 9. All four prediction methods demonstrated higher rates of accuracy for the object movement and resting states. However, the accuracy rates for the drinking state were low when compared with those for the other two states. This was expected because the input signal for the moving state clearly involves a certain degree of activation, while there were no clear activation signs for the drinking state. However, in neural network–based prediction, when the network was trained using the data from all six subjects, a significantly higher accuracy rate was achieved for the drinking state when compared with the other three prediction methods. Similarly, when it was trained using the data of all six subjects, the neural network–based classifier performs better than the corresponding classifiers that were trained using an individual subject’s data for all three classes. Conversely, when compared with the overall results, the accuracy of the SVM-based classification results exceeded that of the neural network–based classification results. Unlike the neural network–based classifier case, the individually trained SVM models performed better than the SVM model that was trained using the data from all subjects. For the resting state, the SVM achieved a maximum accuracy of 94.5%, while the maximum accuracy for the neural networks was 87.4%. For the object moving state, the accuracies of the SVM and neural network–based classifications were 84.3% and 81.6%, respectively. For the drinking state, the highest accuracies of the SVM and of the neural network–based classifications were 59.8% and 80.2%, respectively. However, for the drinking state, the lowest success rate for the prediction was an accuracy of less than 7% when using the SVM-based classifiers with two subjects, when trained with the data from all subjects. Therefore, the average accuracy for the drinking state for the SVM (39.1%) was lower than that of the neural networks (59.5%). However, the neural networks provide faster predictions than the SVM in terms of the latency between the actual motion and the motion predicted by the classifiers. While some prediction latency is inevitable, the latency of the neural network–based classifier is almost half of that of the SVM-based classifier. Summary of the prediction latency for all subjects is shown in Figure 10.

Analysis of results for all six subjects with four different types of predictions.

Latency of predicted motion relative to the expected motion for all six subjects.
Additionally, when compared with the available noninvasive BCIs for control of wearable robotics, the proposed approach allows the wearer to perform two ADL tasks based on the intention of the exact motion through generation of multi-DoF motion for the wearable robot using an inverse kinematics model for the tasks. Furthermore, the prediction capability of the proposed method for expected motion tasks exceeds or equals that of the currently available noninvasive BCIs for wearable robots.
Future studies will involve the use of hybrid signal modality to provide additional information about the tasks that are performed to obtain the inputs for the classifiers. From this perspective, it will be possible to use the inputs from real-time video signals, head position information measured using inertia measurement units, and functional near-infrared spectroscopy signals in conjunction with the EEG signals.
Conclusions
In this study, a noninvasive BCI approach was proposed to examine the dynamic features of EEG signals that occurred during two ADL tasks. The proposed method was used to predict the task-based motion intentions of users of a wearable robot. Initially, the current statuses of the BCI techniques that were available to perform such tasks were identified. The proposed methodology accommodates the dynamic nature of the EEG signals in its approach through use of time series feature inputs in the classifiers. An offline analysis was performed to identify the activated brain regions and the frequency ranges for each of the intended user motions. The identified signals were then used in real time as inputs to neural network– and SVM-based classifiers to predict the intended motions. The experimental results indicated the effectiveness of the proposed method. This study has thus established the feasibility of using a task-based approach to control wearable robots with BCIs.
Footnotes
Declaration of conflicting interests
The author(s) declared no potential conflicts of interest with respect to the research, authorship, and/or publication of this article.
Funding
The author(s) received no financial support for the research, authorship, and/or publication of this article.