
Abstract
This research aims to develop a novel method for recognizing the shape of an object located behind thin medium utilizing combination of ultrasonic sensor signal and edge detection technique. This system is extensively designed so that it can be easily mounted on a surveillance autonomous ground vehicle and is robust for operating in a hazardous environment. Once the autonomous ground vehicle reaches near the hidden objects, the proposed ultrasonic sensor system will identify shapes of the objects. Generally, the number of different sensors mounted on the robot and the number of tasks related to navigation, exploration and detection operation make the design of the autonomous ground vehicle control system very complex. The proposed ultrasonic sensing system for an autonomous ground vehicle provides two-dimensional shape information with low computational cost and will not add significant computational burden to the autonomous ground vehicle’s overall control system. At first, a mathematical model for the ultrasonic sensor is created to find the relationships between the attenuation coefficient, the transmission coefficient, the thickness of the medium and ultrasonic wavelength. The mathematical model is followed by numerical simulation to establish several design parameters. Finally, a prototype for the proposed shape detection system is developed using the kHz range off-the-shelf ultrasonic sensors and edge detection technique. Experimental results confirmed that the accuracy of the proposed mathematical model and shape of an object located behind a thin medium could be estimated successfully. It was concluded from the results that the developed novel method was useful for identifying objects located behind thin media and this will help in conducting the further development of research for surveillance and rescue operation using the autonomous ground vehicle.
Keywords
Introduction and literature review
Interest in object location and shape detection has increased significantly over the last few years and several methods have been developed. Various models and systems have been reported for indoor and outdoor object detection. 1 –3 Object location techniques have been implemented by using elliptical localization, based on ultra wideband systems 4 and image-based systems. 5 Other applications for ultrasonic measurements range from displacement measurement, 6 underwater detection, 7 non-destructive measurement 8 and medical-imaging used for clinical diagnosis. 9 Over the last few years, many different types of sensors 10 have been developed for autonomous ground vehicle (AGV) path planning such as infrared sensors, ultrasonic sensors, LADAR, laser rangefinders and stereocameras with a projector. Range-finding sensors include ultrasonic sensors and laser range finders which are used for obstacle avoidance, scene interpretation and mapping.
Most of the research reported in literature for object location and detection use optical sensors, ultrasonic sensors and global positioning system (GPS). Optical sensors have limited application when objects are hidden. Ultrasonic-based systems reported in research for behind wall object identification are mostly used for map building for large areas and use high-resolution ultrasound imaging techniques. 11 On the other hand, millimetre-wave radar techniques can detect the shape of the hidden objects. However, such techniques are computationally expensive and may not be well suited for rescue-type operation. A new approach of a trackless navigation system for AGV using ultrasonic sensing based on time of flight theory has been developed to identify the position coordinates and the orientation of the AGV. 12 The prototype of small mobile vehicle like AGV using ultrasonic sensor to accomplish environment detection and microcontroller data procession has been revealed by Wahab et al. 13 Detecting reasonably accurate shapes of hidden objects is crucial in applications such as rescue operations and identifying objects behind thin media.
High-accuracy measurement of small movement of an object behind thin medium have been already attempted by Hoshiba et al. 14 To design a measurement system for movements underneath thin medium, it is important to obtain transmission characteristics of medium. Many studies on the acoustic properties of thin medium have been carried out. 15 The acoustic transmission attenuation characteristics of thin medium-like canvas fabric using an ultrasound at frequencies over 20 kHz have been revealed by Hoshiba et al. 16
In order to detect an object hidden inside or behind a thin media, detecting shapes of the hidden objects is one of the primary tasks. An autonomous robot must be equipped with a set of sensors that have small dimensions, low power consumption and real-time performance. Such a system needs to be robust to operate under difficult environmental conditions, lightweight and low cost.
This article presents a novel ultrasonic-based shape detection system satisfying all the above requirements utilizing broadband ultrasound for target object shape detection located behind a thin medium. The proposed sensor system can be easily mounted on an AGV as shown in Figure 1. The AGV can move in hazardous environment using obstacle avoidance without human intervention. Once the AGV reaches the object to be inspected, the proposed ultrasonic sensor system looks to see inside the thin media like a cloth or paper bag to identify the shapes of objects within. Generally, the number of different sensors mounted on the robot and the number of tasks related to navigation, exploration and detection operation make the design of the AGV control system very complex. The proposed ultrasonic sensing system for an AGV provides two-dimensional (2D) shape information with low computational cost and will not add significant computational burden to the AGV’s overall control system.
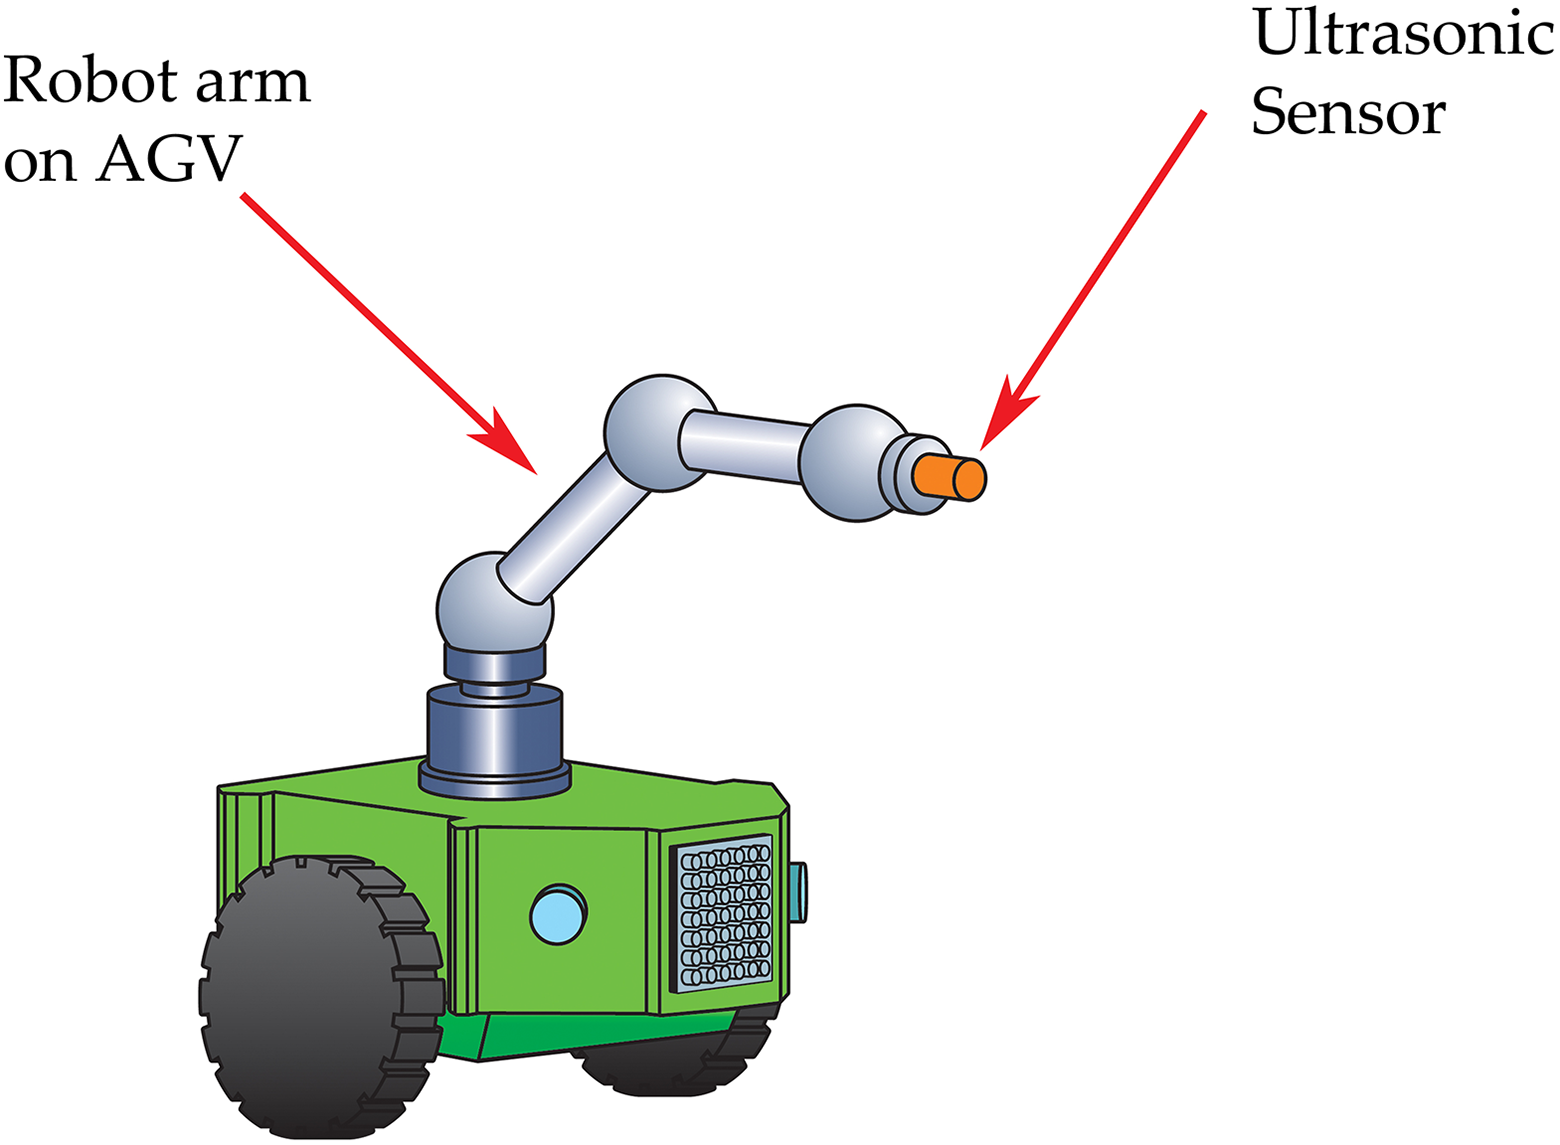
Ultrasonic shape detection system mounted on an AGV. AGV: autonomous ground vehicle.
First and foremost, a mathematical model for the ultrasonic sensor is developed to calibrate the relationships between the attenuation coefficient, the transmission coefficient, the thickness of the medium and ultrasonic wavelength. The numerical simulation was conducted to establish several design parameters. Then described the construction of the prototype shape detection system and gave the details of the experimental setup to test the system. The prototype for the proposed shape detection system was developed using the kHz range off-the-shelf ultrasonic sensors and edge detection technique. Finally, we confirm the accuracy of the shape estimation of an object located behind a thin medium by using the kHz range off-the-shelf ultrasonic sensors and edge detection technique experimentally.
Model development and analysis of system design parameters
In the following section, we derive the equations for the attenuation coefficient αtotal starting with expressions for the reflection and transmission coefficients of ultrasonic waves (AGr and AGt) 17 when ultrasonic signal travels between different media and is reflected from the target object as shown in Figure 2. This section is an expanded version of the modelling method newly developed in previous own research. 18,19

Transmission coefficient and reflection coefficient between different media for ultrasonic signal.
We use the derived equations 18,19 to establish relationships between the attenuation coefficient of the reflected echo from the object behind the medium and the ratio of thickness of the medium and ultrasonic wavelength, the transmission coefficient and ratio of thickness of medium and ultrasonic wavelength and the attenuation coefficient and the thickness of medium.
The reflection and transmission coefficients of ultrasonic waves (AGr and AGt) for any medium can be calculated using the following equations


where d is the thickness of the first medium (wall), ρ is the density of the first medium, c is the speed of ultrasonic signal in the first medium, ρ0 is the density of the second medium, c0 is the speed of ultrasonic signal in the second medium, λ is the wavelength of the operating frequency, z is the acoustic impedance of the first medium and z0 is the acoustic impedance of the second medium. The standard value of acoustic impedance of air (Zair) is 315 rayls.
Using equations (1) to (3), when waves travel between two different media, the transmission and reflection coefficients can be calculated using the density of the medium, speed of ultrasonic signal in the medium, thickness of the medium and wavelength of the operating frequency.
Figure 2 shows schematically the transmission coefficient and reflection coefficient between different media for ultrasonic signal. When the ultrasonic wave is reflected from the medium, the reflection coefficient (ACr1), as shown in Figure 2, can be calculated by substituting equation (3) into equation (1)

where d1 is the thickness of the first medium.
When the ultrasonic wave is reflected from the target object, the reflection coefficient (ACr2), as shown in Figure 2, can be calculated by substituting equation (3) in equation (1)

where d3 is the thickness of the object.
When the ultrasonic wave is transmitted through the second medium towards the target object direction, the transmission coefficient (ACt1), as shown in Figure 2, can be calculated by substituting equation (3) in equation (2)
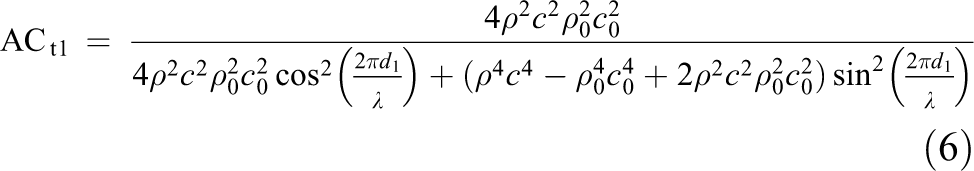
When the ultrasonic wave is transmitted through the medium towards the transducer direction, the transmission coefficient (ACt2), as shown in Figure 2, can be calculated by substituting equation (3) in equation (2)
When the ultrasonic wave is transmitted through the second medium between the medium and the target object (towards the target object direction), the transmission coefficient (ACt12), as shown in Figure 2, can be expressed as

When the ultrasonic wave is transmitted through the second medium between the target object and the first medium (towards the sensor direction), the transmission coefficient (ACt22) can be expressed as

where d1 is the thickness of the first medium, d2 is the thickness of the second medium, d3 is the thickness of the target object, ρ0 is the density of the first medium, c0 is the speed of the ultrasonic signal in the first medium, ρ1 is the density of the second medium and c1 is the speed of ultrasonic signal in the second medium.
αTOTAL is the attenuation coefficient when ultrasonic wave is reflected back after passing through the first medium (wall) and the target object. By combining equations (4) to (9), we can calculate αTOTAL as

We show the application of above-mentioned equations to model the transmission coefficients of ultrasonic signal αCL-TW through thin medium-like cloth and αCR-TW through medium.
We define ACR-TW, BCR-TW, ACL-TW and BCL-TW as follows.


where ρR0 is the density of curtain and ρL0 is the density of cloth.
The transmission coefficient of ultrasonic signal through curtain αCR-TW can be calculated by substituting equations (11) and (12) in equation (7)

where d1 is the thickness of curtain.
The transmission coefficient of ultrasonic signal through cloth αCL-TW can be calculated by substituting equations (13) and (14) in equation (7)

where d1 is the thickness of cloth.
In the following section, we use the derived equations to establish relationships between the attenuation coefficients of the reflected echo from the object behind the medium and the ratio of thickness of the medium and wavelength of ultrasonic signal, the ratio of thickness of medium and wavelength of ultrasonic signal and the transmission coefficient, the attenuation coefficient and the thickness of medium.
The attenuation coefficients of the reflected echo signals can be obtained from above equations. The relationship between the attenuation coefficients of the reflected echo from the object behind the medium and the thickness of the medium per wavelength at frequencies of 40, 75, 120 and 240 kHz is calculated using the following parameters: medium density 200 kg/m3 and medium thickness of 0.2 mm. Result of the relationship between ratio of thickness of medium and wavelength of ultrasonic signal and attenuation coefficient is shown in Figure 3.

Relationship between ratio of thickness of medium and wavelength of ultrasonic signal and attenuation coefficient for object behind the medium.
From Figure 3, we observe that the attenuation coefficient varies with the ratio of thickness of medium (d) and wavelength of ultrasonic signal (λ). The design parameters of the transmitter and receiver can be selected based on the reflectivity of the object and the thickness of the medium. We use data from Figure 3 to estimate the d/λ value for use in the system simulation as described in the next section.
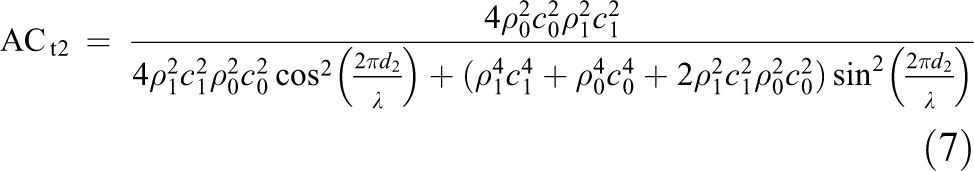
The relationship between the transmission coefficient and the thickness of the medium per wavelength is calculated using the following parameters: density of medium 200 kg/m3, thickness of medium 1.0 mm, density of object 680 kg/m3 and thickness of object 1 cm. The relationship between the ratio of thickness of medium and wavelength of ultrasonic signal and the transmission coefficient is shown in Figure 4.
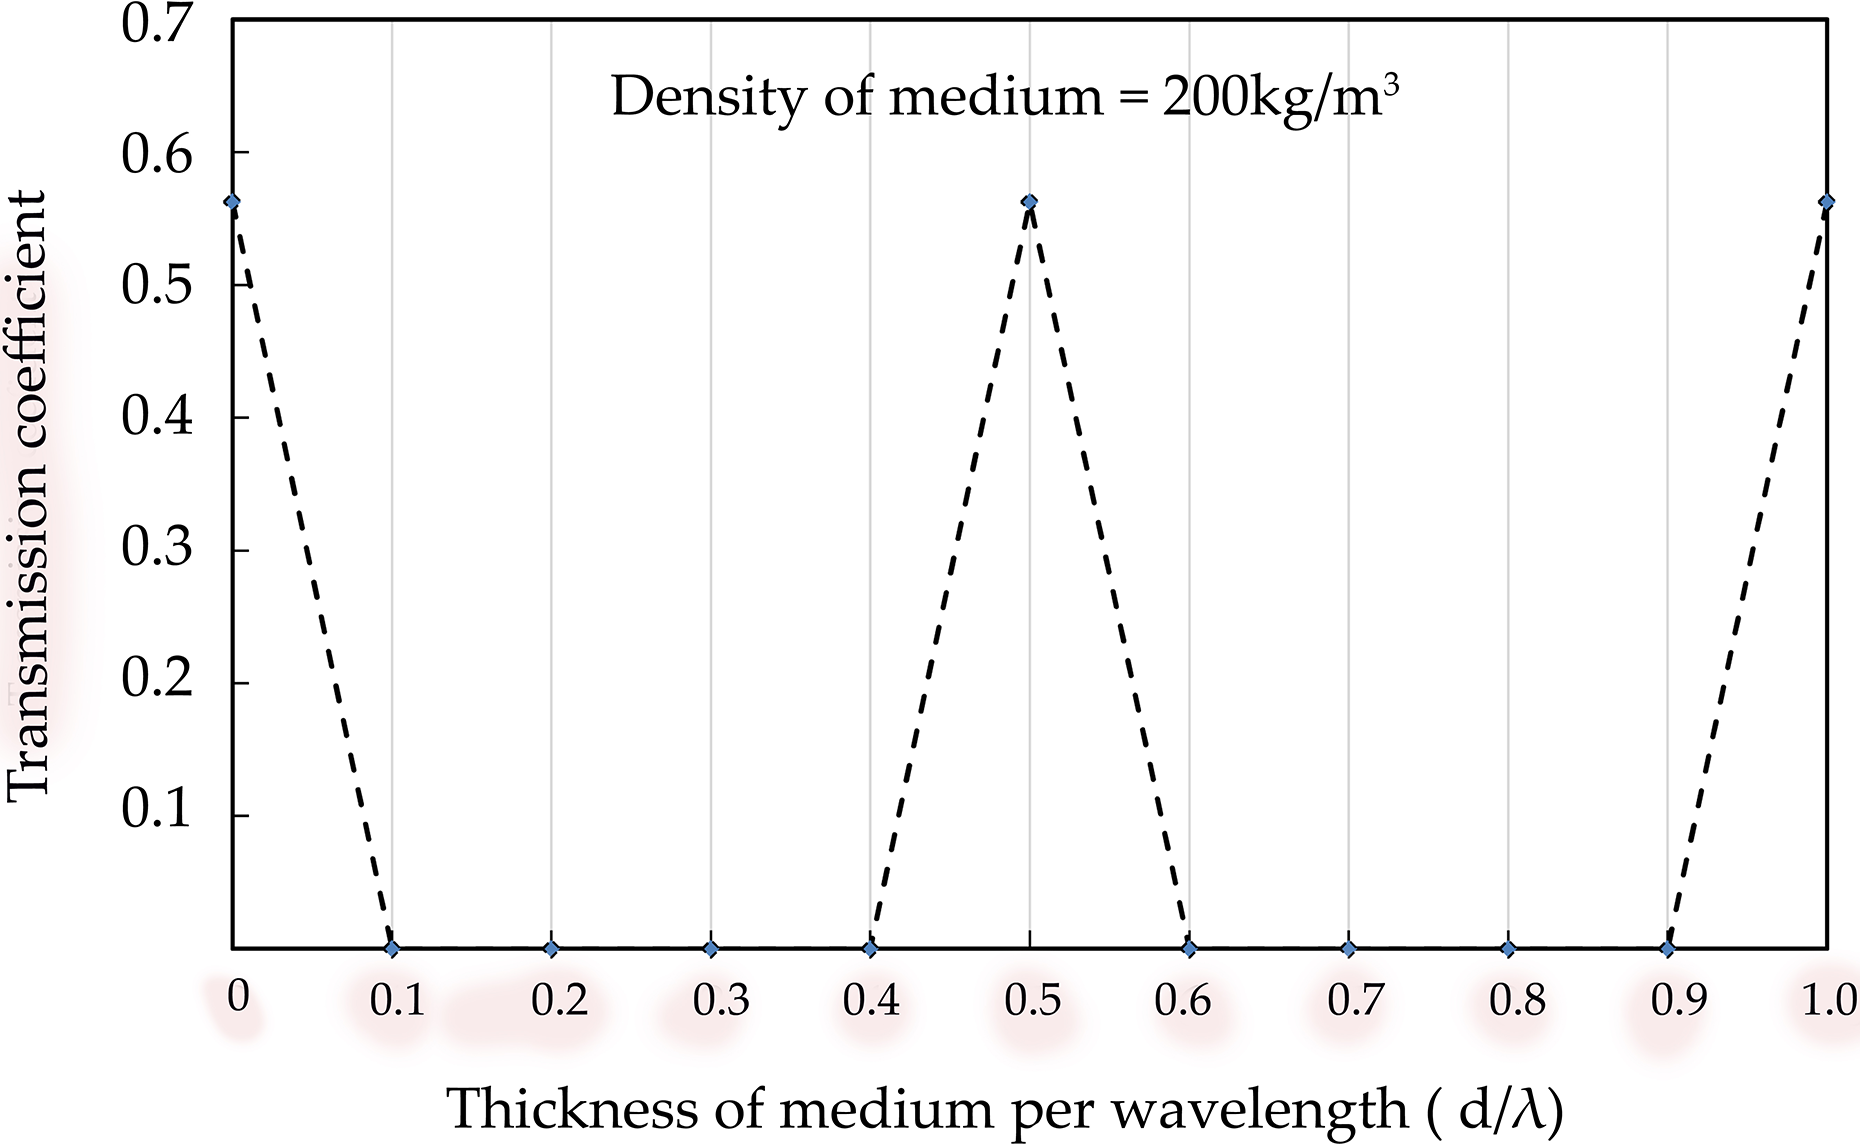
Relationship between ratio of thickness of medium and wavelength of ultrasonic signal and transmission coefficient for the object behind the wall (medium).
From Figure 4, we can conclude that the signal can penetrate better when the ratio of the thickness of the medium and the wavelength of ultrasonic signal is 0.5 and 1. When the ratio of d/λ varies between 0 and 1, the signal strength varies from micro-scale to nanoscale.
The relationship between the attenuation coefficient and the thickness of medium is shown in Figure 5. The value of density used is 200 kg/m3 with the wall (medium) thickness varying from 0.08 mm to 0.12 mm. From this result, it can be seen that the medium of thickness becomes larger and the attenuation will be lower.

Thickness of medium versus attenuation coefficient.
According to the result, the return signal strength behind the object increases when the thickness of the wall (medium) becomes thinner, such as 0.012–0.08 mm. Moreover, it has been observed that the strength of the echo signal from the target object depended on the operating frequency, as well as the density of the medium between the target object and the sensor confirming the theoretical model derivation in this section.
The transmitted signal (Stransmit) was calculated using linear frequency modulation, as shown in the following equation

where µ = B/2τ′ is the linear frequency modulation coefficient, B is the bandwidth, τ′ is the uncompressed pulse width, fc is the ultrasonic frequency and t is the sample time.
The receiver signal (Sreceive) was calculated using the following equation

where Δτ = 2R/c is round trip delay, a is the amplitude of the return signal from an object behind the medium and R is the distance of the target object from the sensor. The reference signal (Sreference) can be calculated using the following equation

where fr is the reference frequency. At the same time, the signal after the bandpass filter was calculated using the following equation

where f0 is the central frequency. For the above equations, the speed of ultrasonic signal and operating frequency was initialized at 344 m/s and 120 kHz for the simulation.
The ratio of the thickness of the medium (d) and the wavelength of the frequency (λ) is the critical factor for input parameter initialization. We select the d/λ value 0.5 which is one of the highest attenuations result obtained from Figure 3. The 200 kg/m3 density value is selected for the simulation as we target for thin medium applications. The simulation results of the incoming reflected and normalized signals are shown in Figures 6 and 7, respectively.
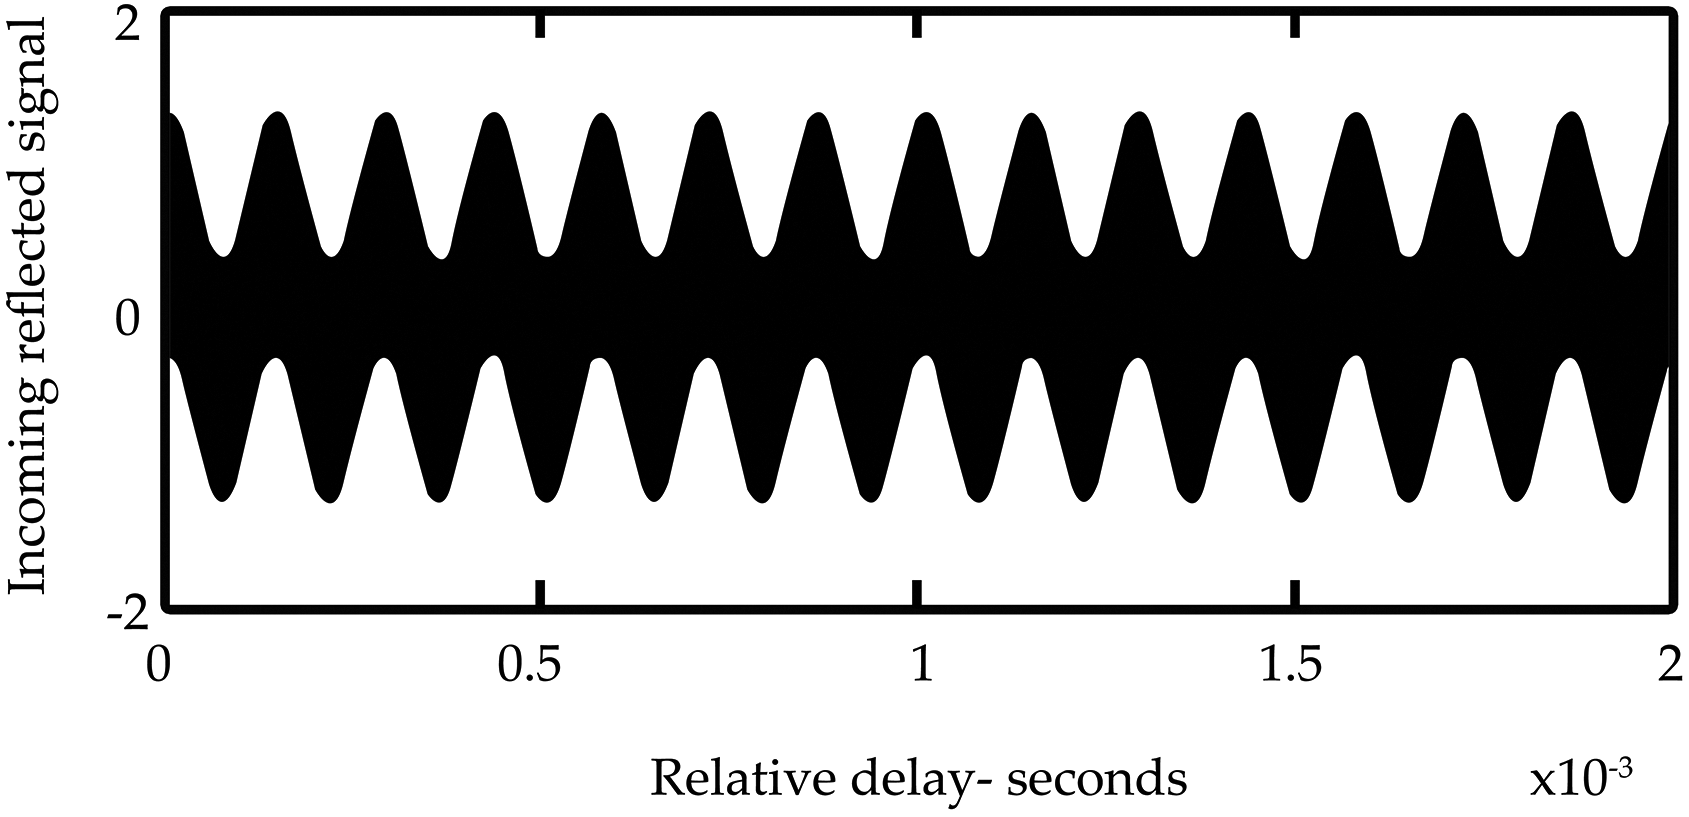
Simulation result of returned echo from the object behind medium.
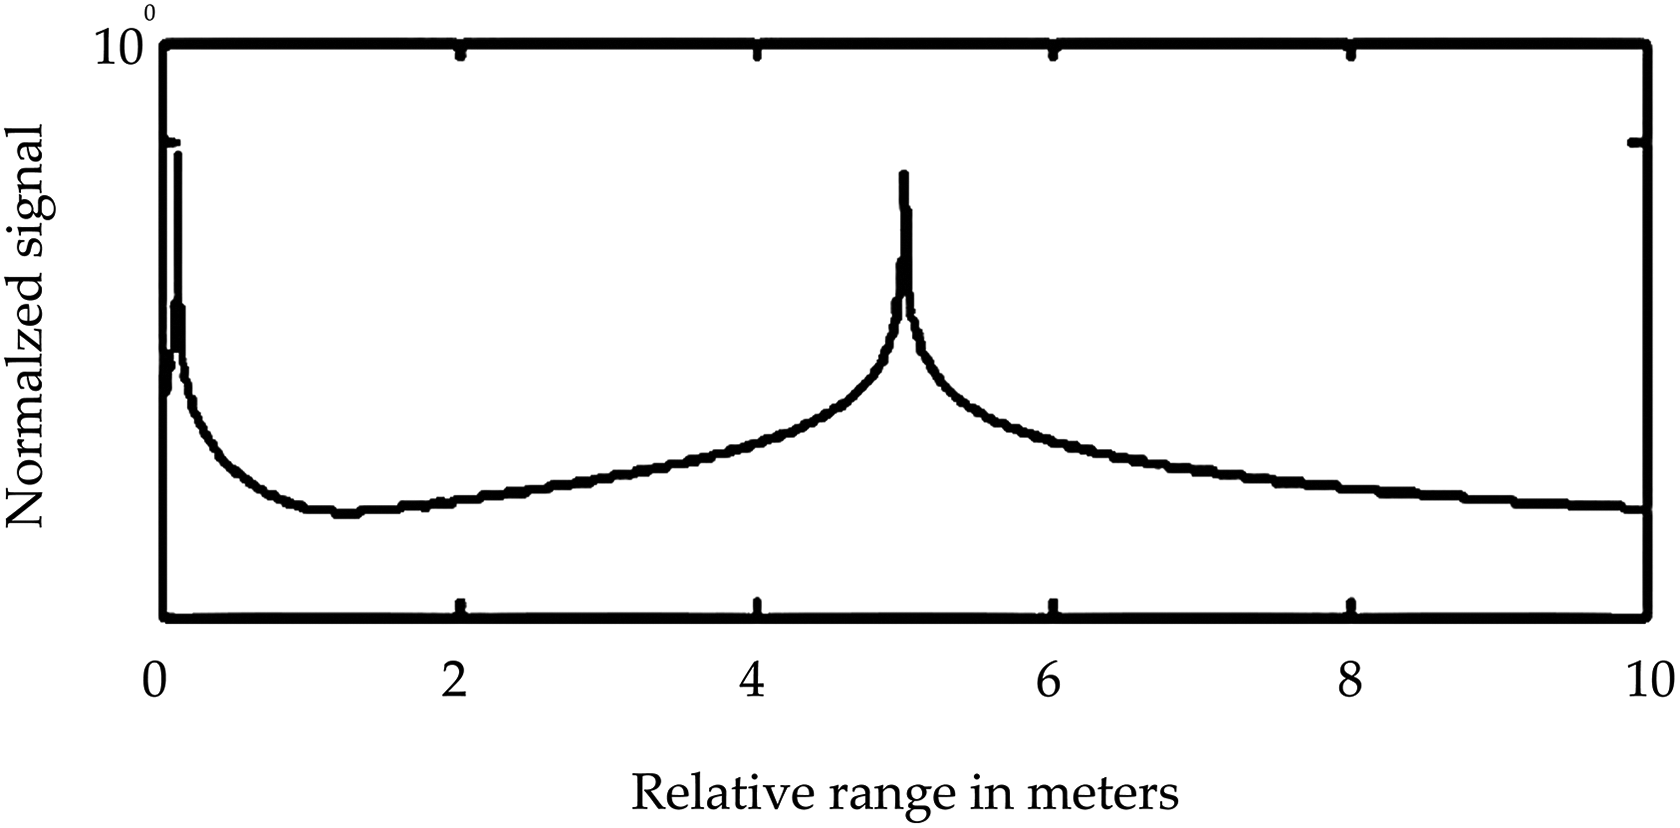
Normalized signal strength from the target object versus relative range.
In Figure 7, the vertical axis represents the normalized signal strength from the target object behind the medium and the horizontal axis represents the relative range in metres. Normalized signal is a unit of measurement of signal strength of the echo signal from the target object behind the medium. Relative range in metres is the distance between the target object and the medium.
From the simulation results, we can estimate the design of transmitter and receiver by varying the ratio of thickness of wall and wavelength of ultrasonic signal. From the result of simulation, it is found that the signal can penetrate the medium better when we set the d/λ value to 0.5. Hence, to obtain the better penetration, parameter setting for d/λ value is one of the critical factors for detecting the object behind the medium.
Development of novel method for shape detection system
Target object shape detection system
A prototype for the proposed shape detection system has been developed using commercially available ultrasonic tough sonic sensor (TSPC) series ultrasonic sensors as shown in Figure 8(a) and (b).

(a) Prototype description and (b) schematic diagram for the prototype.
Based on the results from the modelling and simulation from ‘Model development and analysis of system design parameters’ section, the prototype system is constructed with ultrasonic sensors of frequencies 75, 120 and 240 kHz, a calibration board for X–Y motion of the sensors, an interface module with a computer to monitor and control the sensor measurements via serial data interface, detection range adjustable module and a power supply unit. The system’s detection range adjustable module controlled the detection range according to the target positions. The calibration board is capable of moving the ultrasonic sensors in the X–Y directions with an accuracy of 0.02 mm.
Calibration board
We constructed a calibration board and mounted the ultrasonic sensors on the board as shown in Figure 9. The calibration board of size 12′′ × 12′′, which is convenient for handling purpose, allows movement of the sensors in the vertical and horizontal directions with 1-inch resolution and 0.02-mm accuracy. Alternatively, sensors can be mounted on autonomous guided vehicle as shown in Figure 1 or even handheld to scan the environment.

(a) Sensor configuration and (b) schematic diagram.
Experimental setup and discussion of results
In fact, temperature, humidity, wind speed, object shape, colour of object and arrangement of sensor can affect the accuracy of measurement result. Hence, this experiment is set up under steady environment condition with high-resolution sensor application to minimize the environmental effects as much as possible.
Ultrasonic sensor accuracy and linearity measurement
To calculate the accuracy and linearity of the ultrasonic sensor for detecting object behind a thin medium, calibration board as shown in Figure 9 was used. We measured the distance of the object using the ultrasonic sensor with 240-kHz frequency and compared the data with physical measurement of the object distance under the following two conditions: with no solid medium between the sensor and the target object and with a thin medium between the sensor and the target object.
The details of experiment conditions are presented in Table 1.
The details of experimental conditions.

The object distance was varied from 1 to 25 inches, and the variation of measurement from actual data was plotted as shown in Figure 10. It can be seen that the measure value variation with or without medium to the target is nearly the same with the actual value. The result of actual distance versus measured distance confirmed that measured distances are in close agreement with the actual distances for the target object. Hence, accuracy and linearity of the ultrasonic sensor for distance measurement in this experiment are reliable.

Variation of measurement from experimental value (operating frequency = 240 kHz). Gr-zero = with a thin medium between the sensor and the target object; no wall = with no solid medium between the sensor and the target object.
Target object shape detection system: Experimental setup
The experiments were performed to detect and calculate the shape of the target object located behind a thin medium at different distances using ultrasonic frequencies of 75, 120 and 240 kHz. A cellulose material with thickness of 2 mm was used as thin medium during the experiments. This material has a density of 200 kg/m3. Air at room temperature was used as the medium between the sensor and the target object. We used a small square-shaped object as target object as shown in Figure 11. The density of the target object was 500 kg/m3. In order to receive the reflected signal, density and the thickness of the medium (wall) played an important role. The measured data from the transducer were transferred using an RS-232 serial data interface to a personal computer.
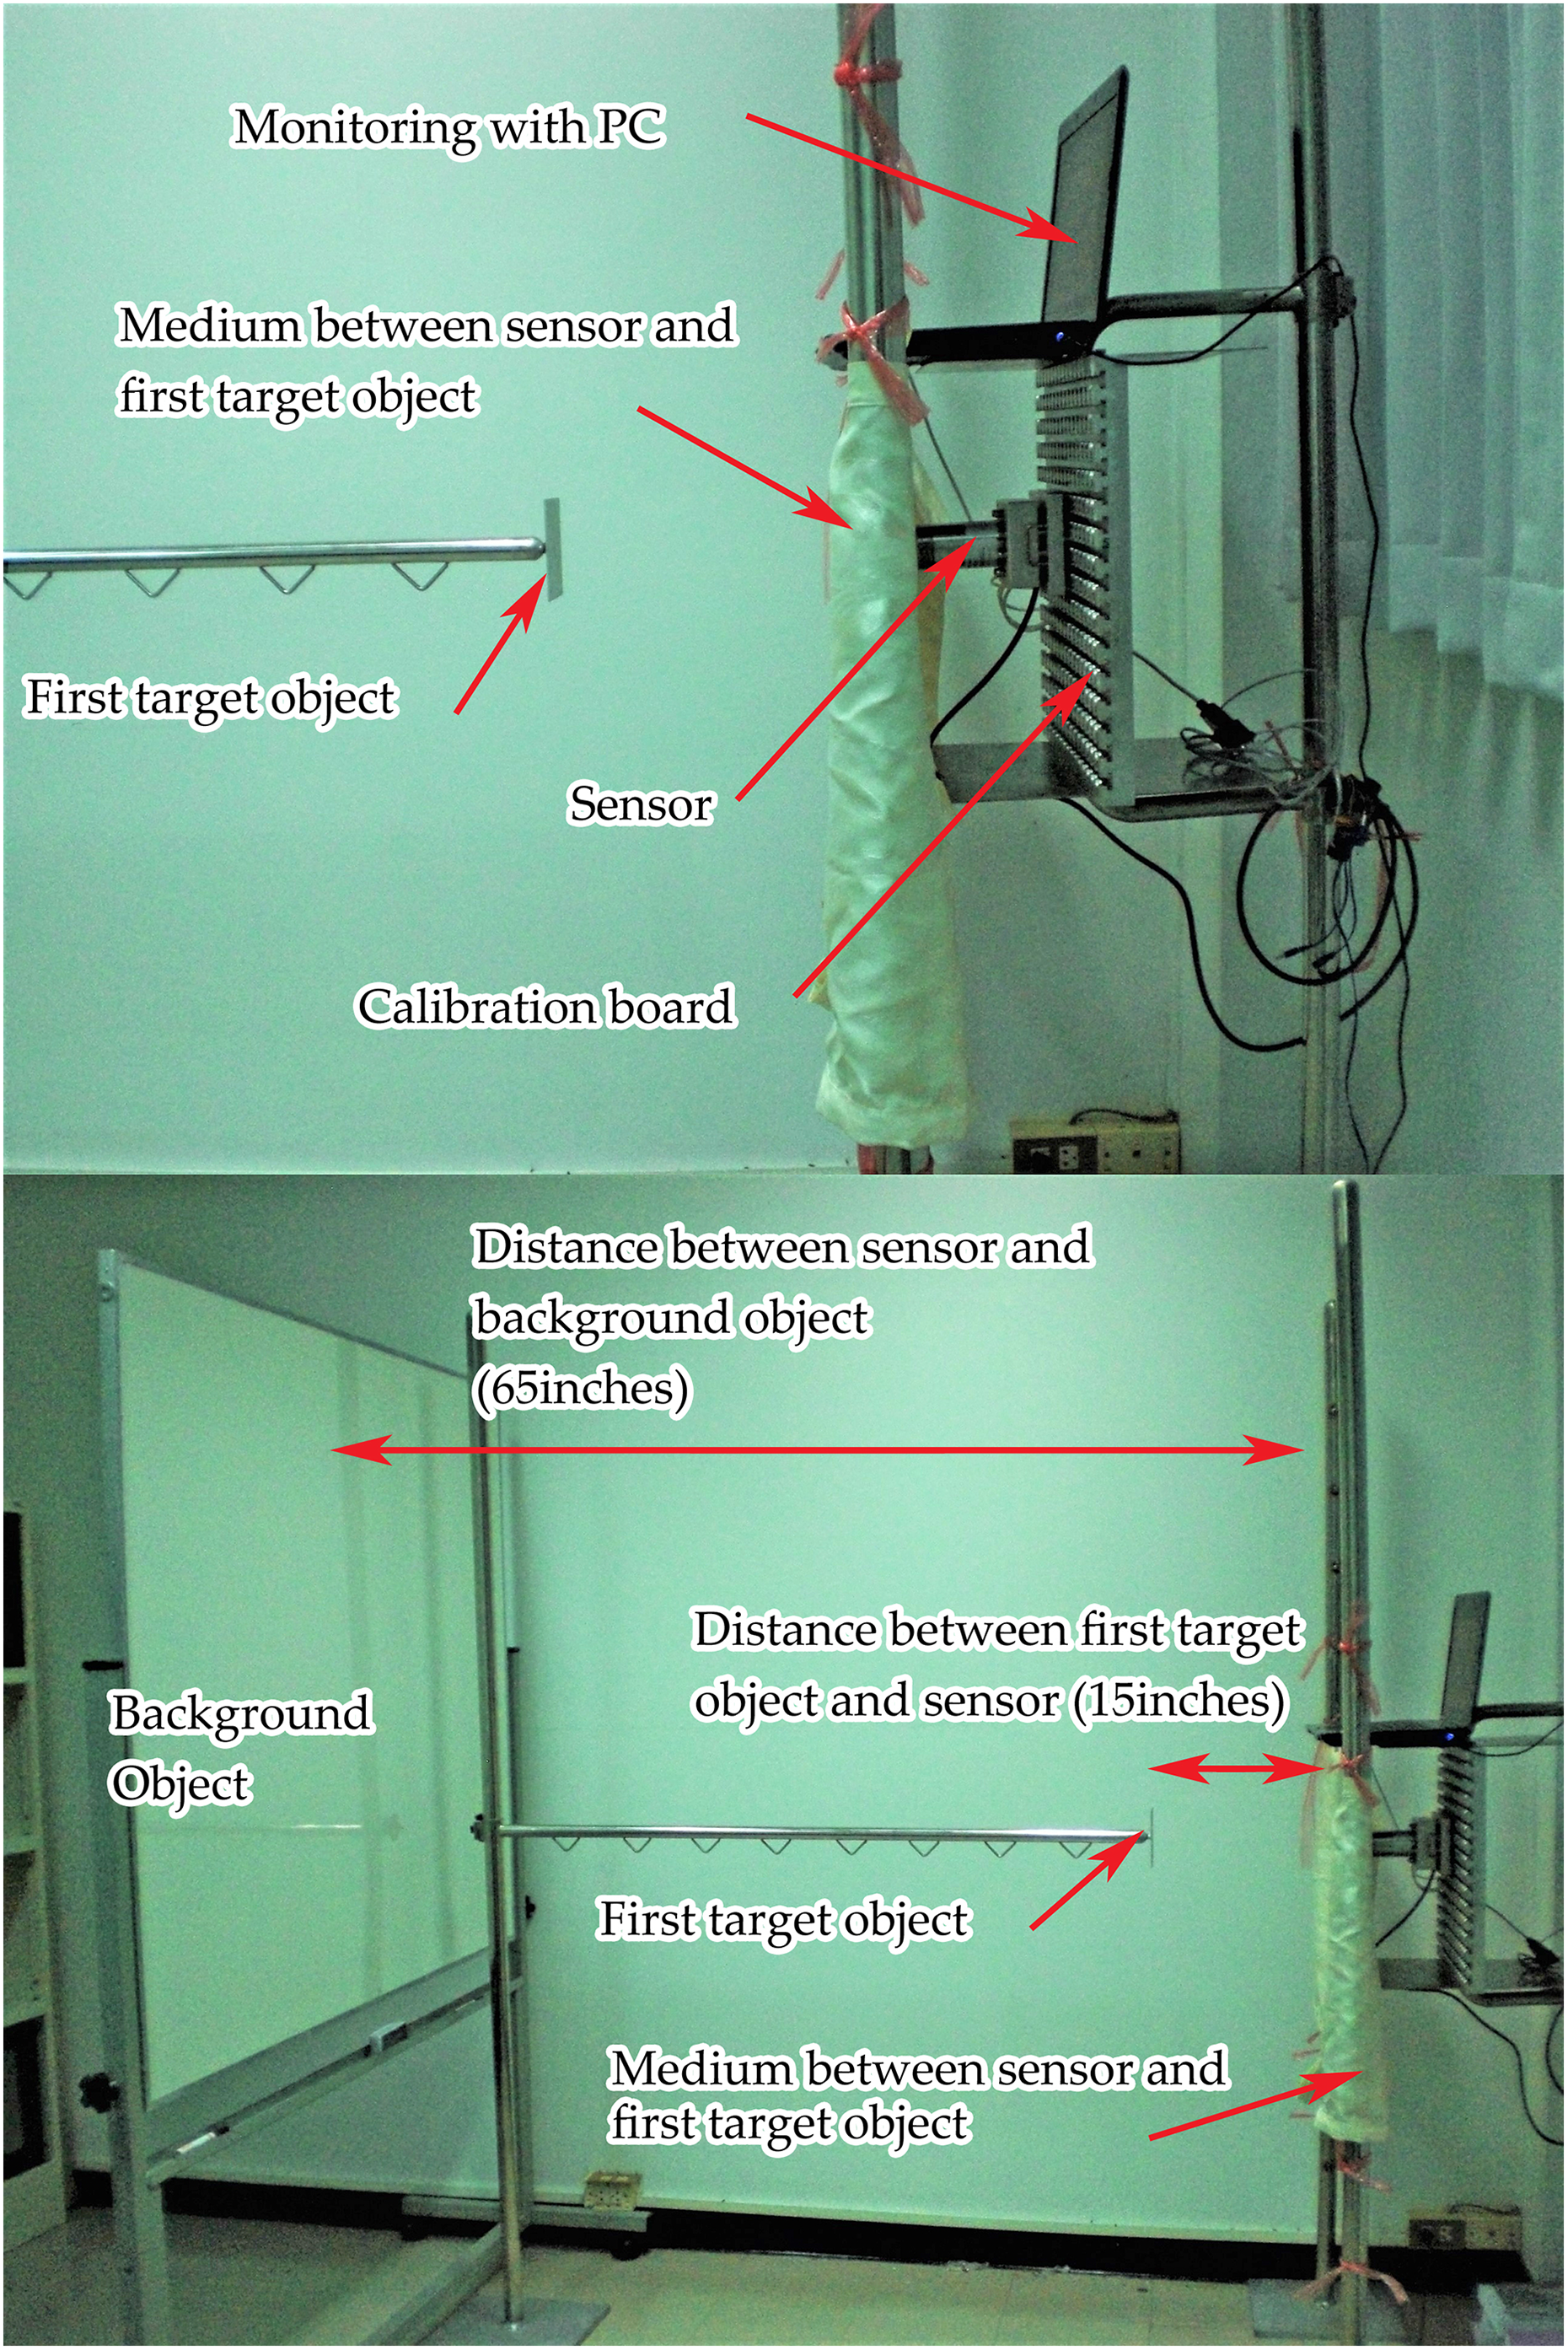
Shape detection experimental setup side view.
For detecting the shape of the target object situated behind the thin medium, first the system scans the space during the initialization process and locates a large stationary 2D object using the distance measurement data. For a large stationary object, the distance measurement data give a uniform distance value, within a threshold limit. This object is used as background object. During scanning, the ultrasonic sensor is moved manually or using motors along the top and bottom rows (X-direction) and the left and right columns (Y-direction) of the calibration board and data are measured. The row and column numbers are stored as X–Y values, and the distance measurement data are stored as Z-value in a SHAPEARRAY. Since the calibration board used in our experiment has 144 scanning points as described in this section, SHAPEARRAY has 144 data points. SHAPEARRAY is initialized with this uniform value BACKGROUND after rounding up.
After the initialization process is complete, the ultrasonic sensor is moved sequentially from rows 1 to 12 and columns 1 to 12 covering each slot and data are measured. Measured data values are compared with BACKGROUND and if different from BACKGROUND, beyond a threshold, are recorded in SHAPEARRAY. For instance, at X = 6 and Y = 0, the measured value at the (6, 0) cell was 64.53, which is within the threshold limit of the BACKGROUND value, hence the BACKGROUND value is retained. Then, at X = 6 and Y = 1, the measured value at the (6, 1) cell was 15.47, which is beyond the threshold limit of the BACKGROUND value, then original BACKGROUND value at (6,1) is overwritten by 15.47.
In the first experiment, using the above-mentioned method, we used a 75-kHz ultrasonic sensor to record SHAPEARRAY75 data as given in Table 2. Using the same method, we used a 120-kHz ultrasonic sensor to record SHAPEARRAY120 data as given in Table 3, and using a 240-kHz ultrasonic sensor, SHAPEARRAY240 data were recorded as given in Table 4.
Experimental measurement data SHAPEARRAY using a 75-kHz ultrasonic sensor when target object located 15 inches from thin medium.a

aBlue cells represent the actual shape of the object; orange + blue cells represent the shape of the object as detected by the shape detection system.
Experimental measurement data SHAPEARRAY using a 120-kHz ultrasonic sensor when target object located 15 inches from thin medium.a

aBlue cells represent the actual shape of the object; orange + blue cells represent the shape of the object as detected by the shape detection system.
Experimental measurement data SHAPEARRAY using a 240-kHz ultrasonic sensor when target object located 15 inches from thin medium.a

aBlue cells represent the actual shape of the object; orange + blue cells represent the shape of the object as detected by the shape detection system.
The experiments were repeated by moving the target object to a different location and SHAPEARRAY75 data were recorded as given in Table 5, SHAPEARRAY120 data were recorded as given in Table 6, and using a 240-kHz ultrasonic sensor, SHAPEARRAY240 data were recorded as given in Table 7.
Experimental measurement data SHAPEARRAY using a 75-kHz ultrasonic sensor when target object located 5 inches from thin medium.a
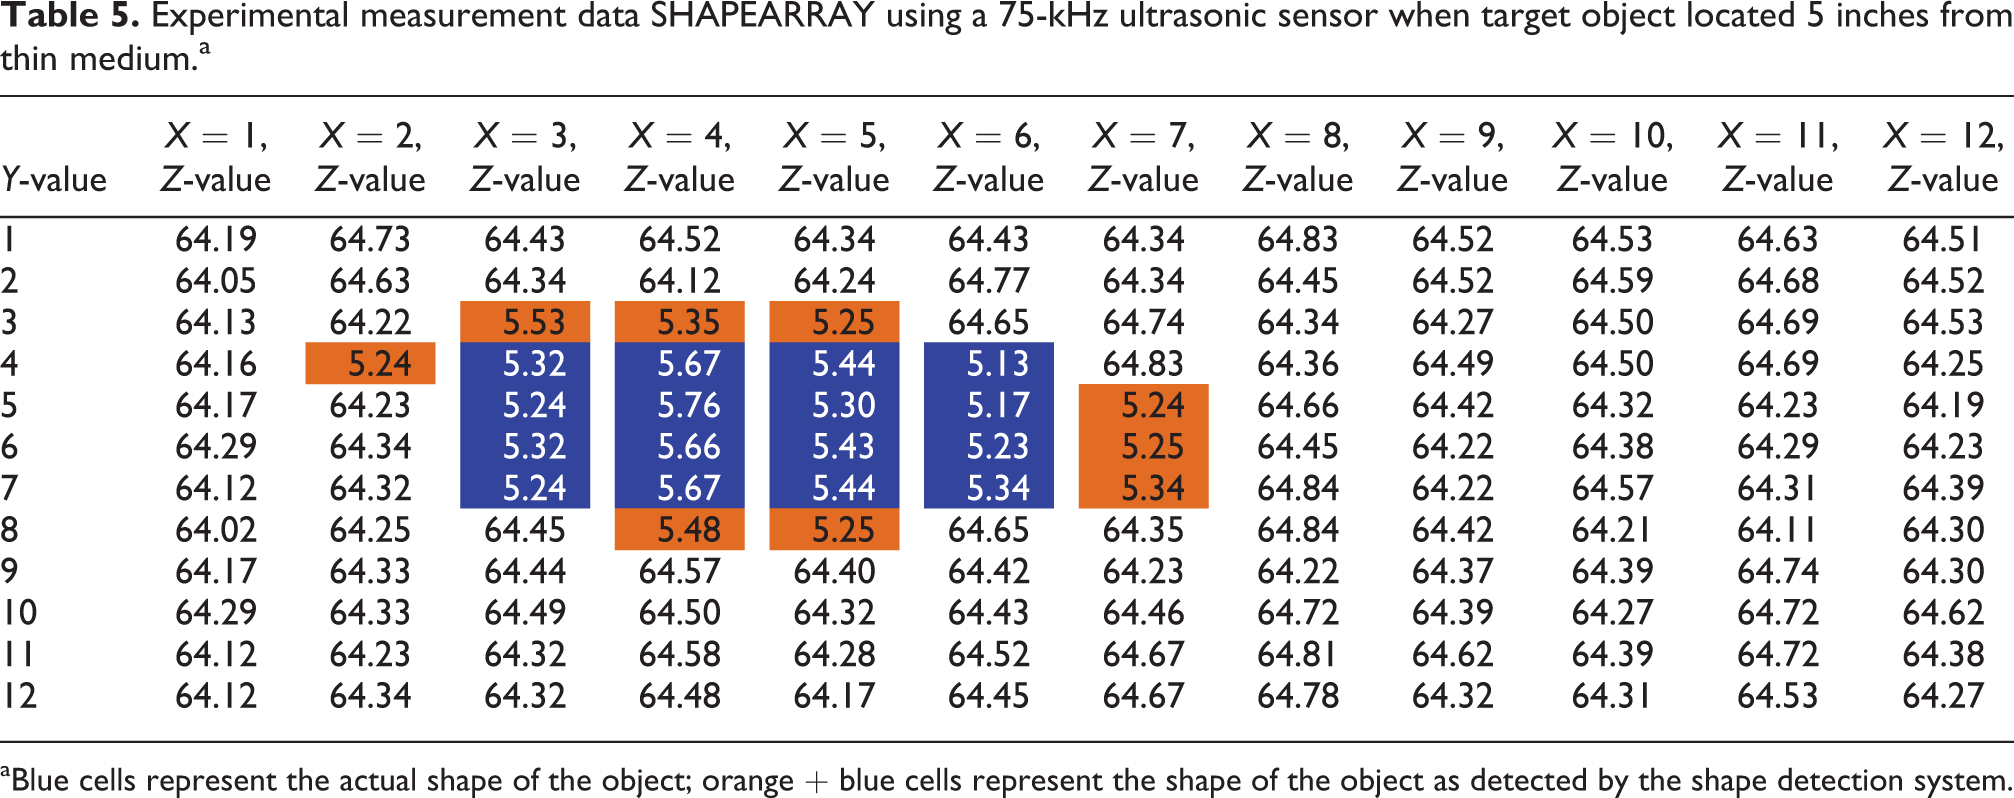
aBlue cells represent the actual shape of the object; orange + blue cells represent the shape of the object as detected by the shape detection system.
Experimental measurement data SHAPEARRAY using a 120-kHz ultrasonic sensor when target object located 5 inches from thin medium.a
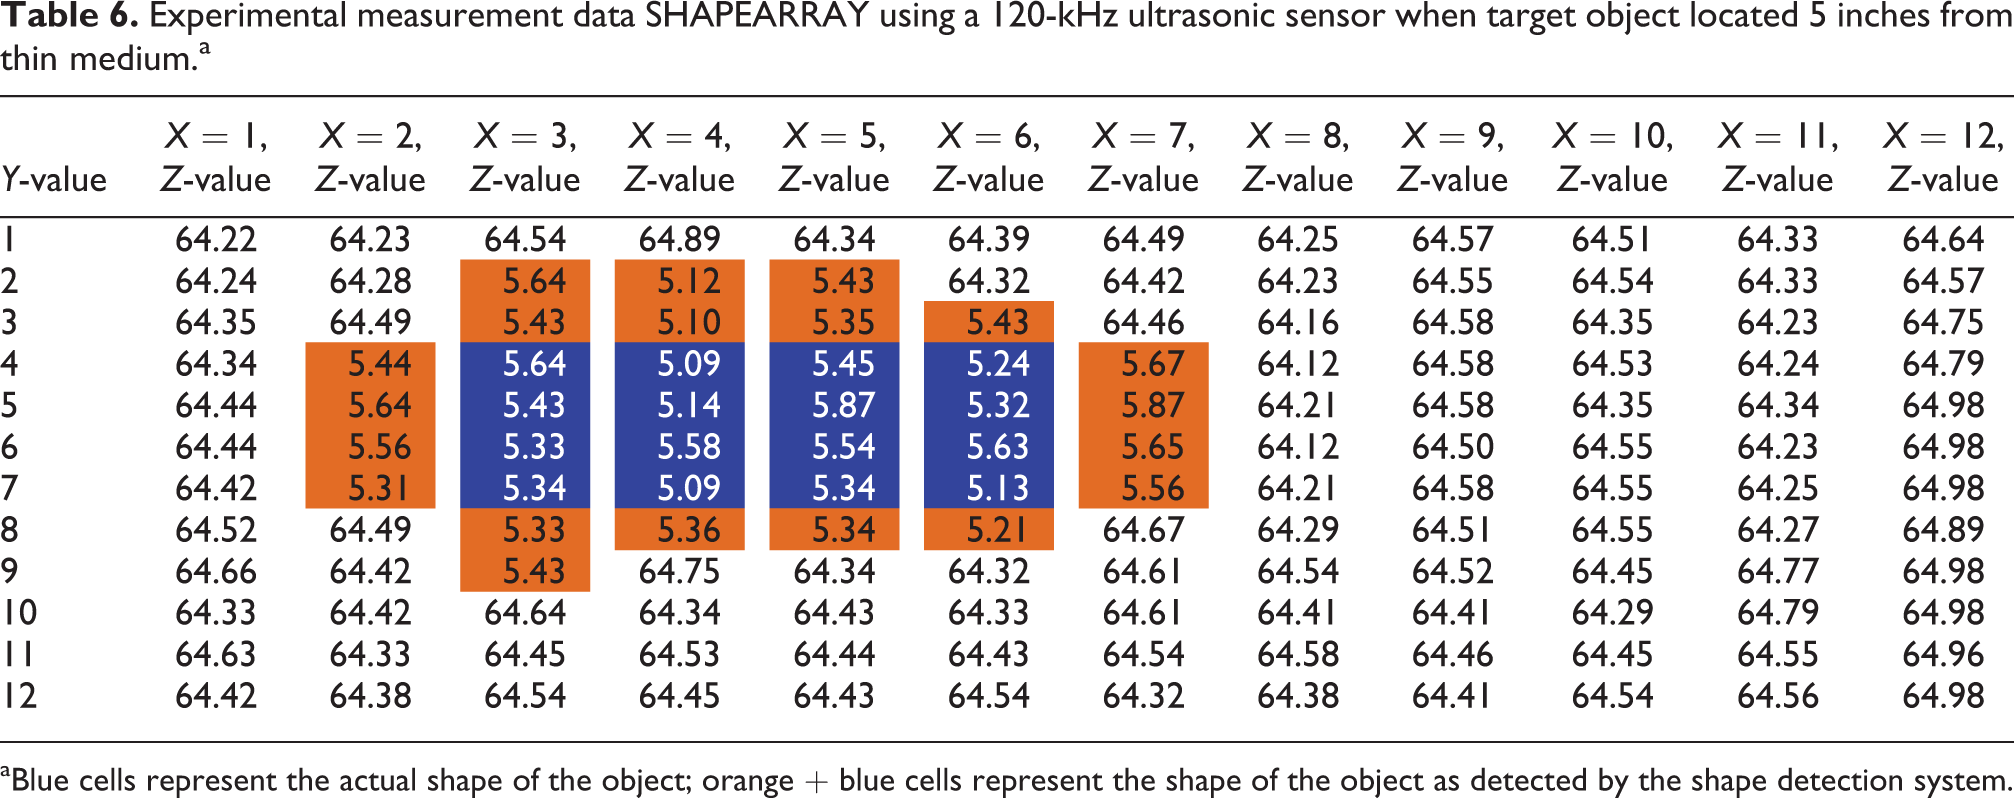
aBlue cells represent the actual shape of the object; orange + blue cells represent the shape of the object as detected by the shape detection system.
Experimental measurement data SHAPEARRAY using a 240-kHz ultrasonic sensor when target object located 5 inches from thin medium.a

aBlue cells represent the actual shape of the object; orange + blue cells represent the shape of the object as detected by the shape detection system.
We applied gradient-based edge detection techniques to the SHAPEARRAY data and calculated the target object boundary edge pixels. The system can detect multiple object shapes in the scanned space if the objects are not overlapping. Since the object shape is important, the points inside the boundary were also marked as object pixels. The same method was used for SHAPEARRAY120 and SHAPEARRAY240 data.
The results of applying edge detection technique for target object located at a distance of 15′′ behind the thin medium are given in Tables 2 to 4 and for target object located at a distance of 5′′ behind the thin medium are given in Tables 5 to 7. As given in Tables 2 to 7, the cells in blue + orange give the shape of the target object. When we compare the shape with the real shape of the target object, which was square shape 4′′ × 4′′, the cells in blue give the shape of the detected target object and the cells in orange indicate the data showing that there was a target object edge present, although there was no actual target object (false edge detection). From the tables, it can be observed that the shape of the target object could be estimated with good accuracy. Error analysis for the target object is presented in the next section.
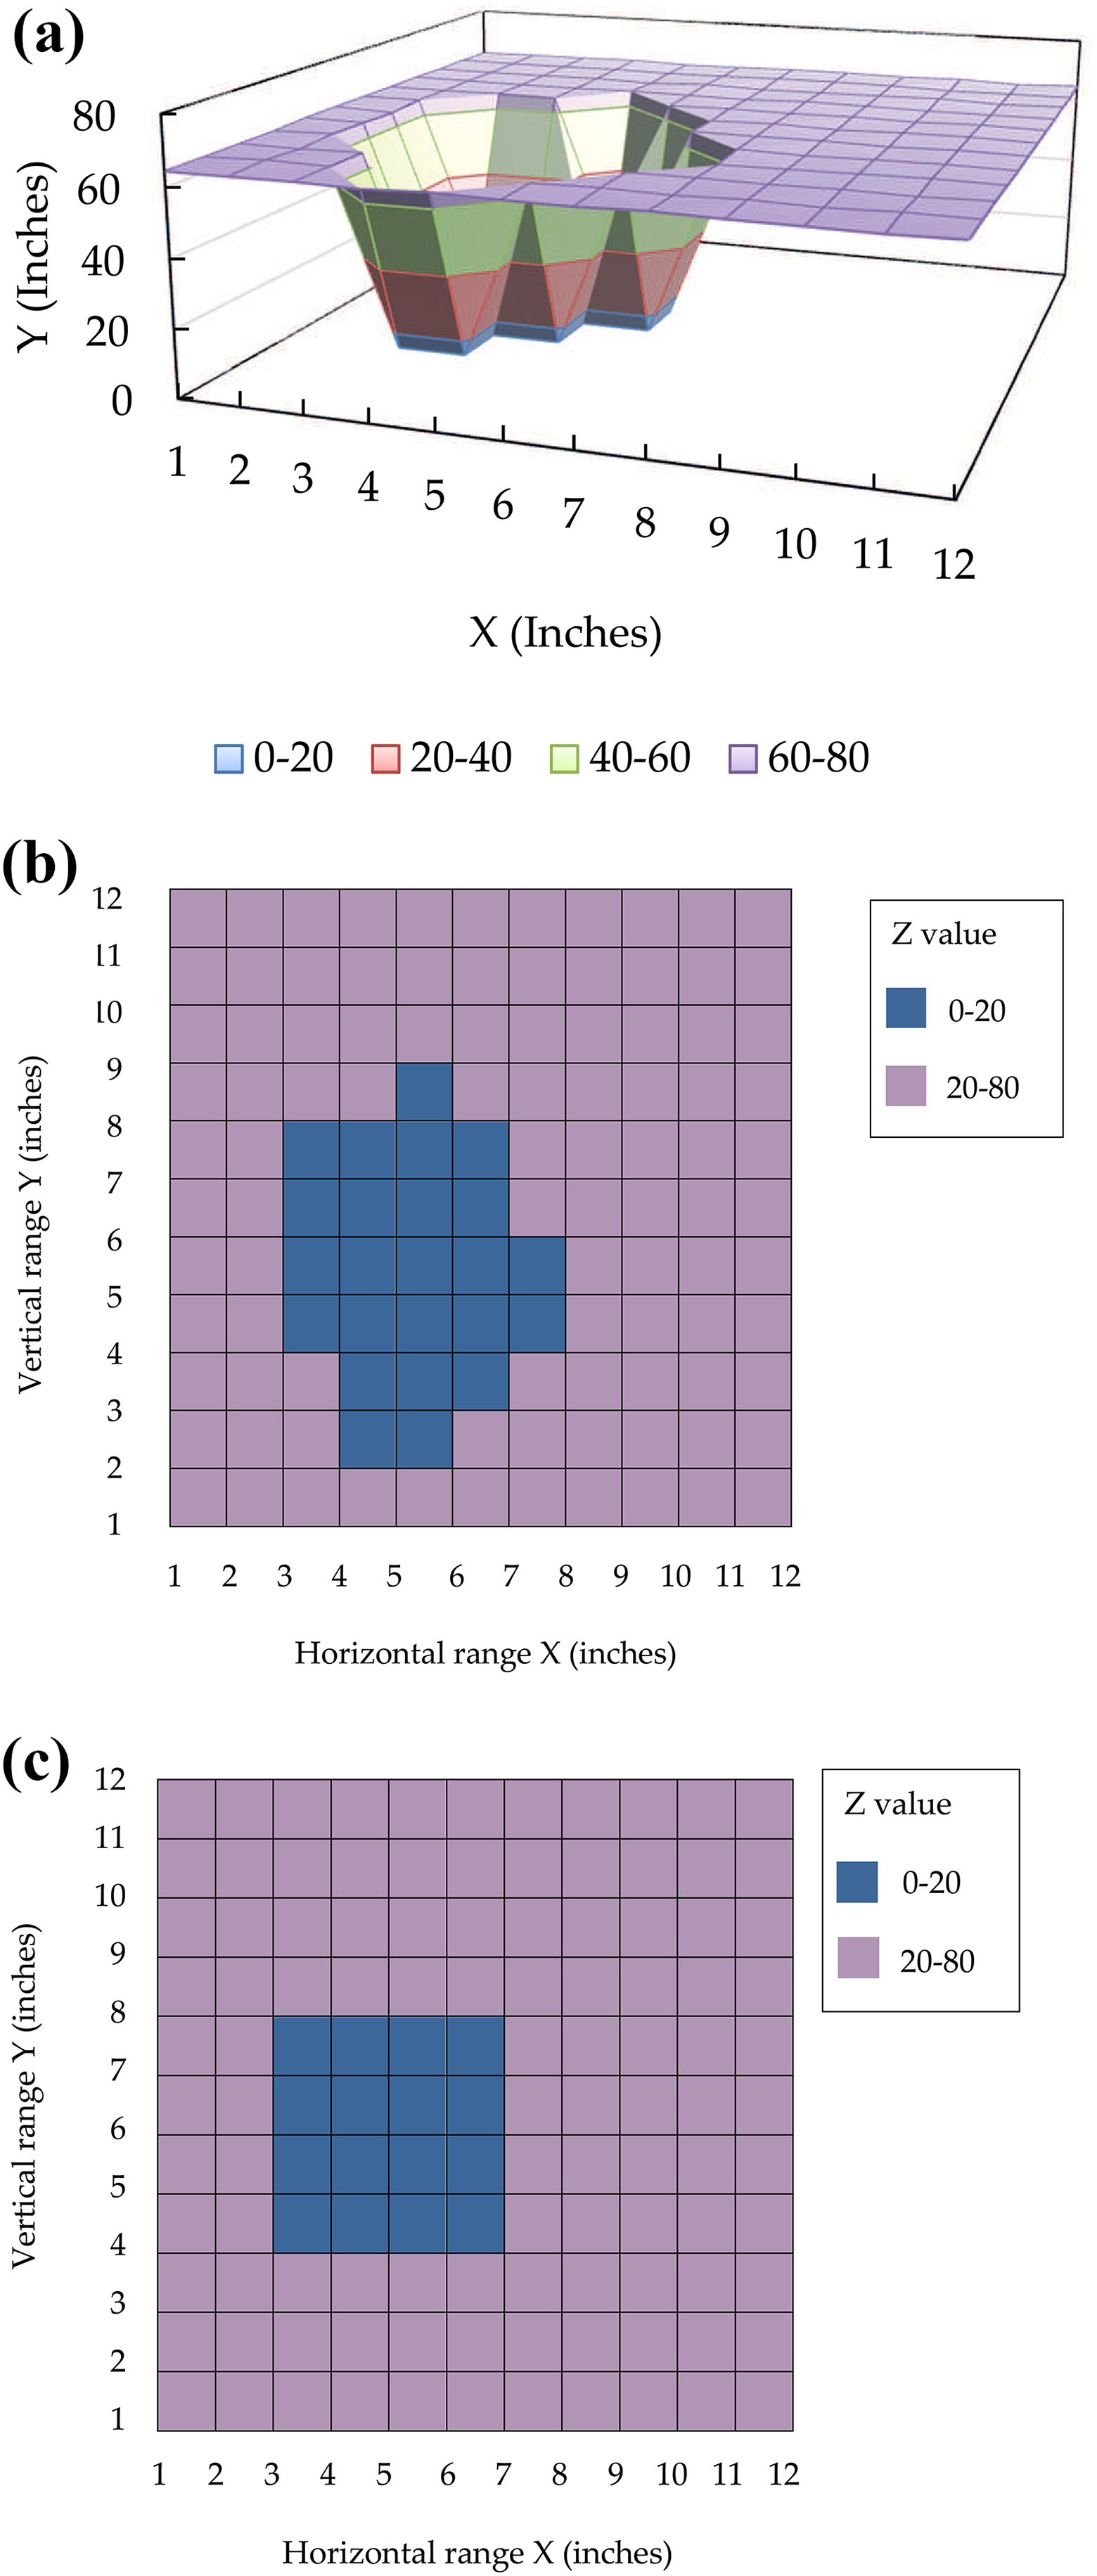
For automating the shape detection process, SHAPEARRAY data were analysed using MATLAB. Three-dimensional shapes of the target objects were plotted in Figures 12 to 14.

(a) Experimental result to predict the shape of object behind the medium using ultrasonic 75-kHz sensor; (b) detection of target shape using 75-kHz sensor; and (c) original shape of the target object.

(a) Experimental results to predict the shape of the object behind the medium using ultrasonic 120-kHz sensor; (b) detection of target shape using 120-kHz sensor; and (c) original shape of the target object.
(a) Experimental results to predict the shape of the object behind the medium using ultrasonic 240-kHz sensor; (b) detection of target shape using 240-kHz sensor; and (c) original shape of the target object.
The shape of the target object was determined using the experimental data obtained from the ultrasonic sensors of frequencies 75, 120 and 240 kHz as shown in Figures 12
to 14. The total processing time for detecting the hidden object is 50 min. In Figures 12(a), 13(a) and 14(a), the distances of the target object are shown on the Z-axis. The overall error of target’s distance detection using the 75-kHz sensor was 7.4% and that of 120-kHz sensor was 13.43% and for 240-kHz sensor was 3.62%. A sample calculation is given below: Overall error calculation % error = [(measured value − actual value)/actual value] × 100% For Table 2, cell (1, 0) white cell % error = [64.79 − 65/65] × 100 = 0.32% For Table 2, cell (3, 3) blue cell % error = [15.49 − 15/15× 100] = 3.26% Repeat for all the cells (1, 0) (1, 1) to until (12, 12) and calculate the average
From the results, we can see that the accuracy of the distance estimation varies with the frequency of the ultrasonic sensors. The 240-kHz frequency sensor performed better because higher frequency has better penetration consistent with the results from ‘Experimental setup and discussion of results’ section. A comparison between the experimental area and actual area of the target object’s shape using Tables 2 to 7 shows that the 240-kHz ultrasonic sensor produces more accurate shape detection than 75 and 120-kHz sensors. Hence, we confirm that the shape of an object located behind a thin medium could be estimated by using the kHz range off-the-shelf ultrasonic sensors and edge detection technique which is sufficient for applications such as rescue operation and identifying objects inside thin media.
Conclusion and future work
In this article, a novel design of ultrasonic sensor system for target object’s shape detection located behind a thin medium is presented. In order to detect the target shape, we used ultrasonic sensors of frequencies of 75, 120 and 240 kHz. A detailed mathematical model for the ultrasonic sensor was developed in order to find the relationships between the attenuation coefficient, the transmission coefficient, thickness of the medium and ultrasonic wavelength. The mathematical model was followed by numerical simulation. We established several design parameters using the model and simulation results. We used the derived equations to establish the relationships between the attenuation coefficient of the reflected echo from the object behind the medium and the ratio of thickness of the medium and ultrasonic wavelength, the transmission coefficient and ratio of thickness of medium and ultrasonic wavelength and the attenuation coefficient and the thickness of medium. The simulation showed the strength of the received ultrasonic signal depends on three factors: operating frequency, density of the medium and thickness of the medium. From this simulation, the received signal’s strength from a target object behind the medium could be estimated. The simulation was very useful in the ultrasonic sensor design/selection process and calculating the transmission power to the system. We then described the construction of the prototype shape detection system and gave the details of the experimental setup to test the system. Based on the experimental data for target object located at various distances behind a thin media, the distance measurement accuracy calculations were presented. From the results, we conclude that the accuracy of the distance measurement varies with the frequency of the ultrasonic sensors. The overall error of target’s distance detection using the 75-kHz sensor was 7.4%, 120-kHz sensor was 13.43% and 240-kHz sensor was 3.62%. The 240-kHz frequency sensor performed better because higher frequency has better penetration consistent with the results from ‘Experimental setup and discussion of results’ section.
From the experiments, we established that the shape of an object located behind a thin media could be estimated by using the kHz range off-the-shelf ultrasonic sensors and edge detection technique with good accuracy. We applied gradient-based edge detection techniques to the SHAPEARRAY data and calculated the target object boundary edge pixels. Although filter option was not applied for signal received in this experiment, the shape recognition software can still estimate the shape. Accuracy will improve with additional filter applications of ultrasonic sensors. Hence, the effect of noise on sensors will not be the crucial factor for certain environments. This system can detect multiple object shapes in the scanned space if the objects are not overlapping and moving fast.
The proposed sensor system can be easily mounted on any AGV to identify the shapes of the objects inside the thin media which is very useful for applications such as rescue operation. Although developed system has some limitation, it is robust development to estimate received ultrasonic signal. Based on this development, accuracy of the system can be improved by using more compact range of ultrasonic sensor arrays and real-time operation system software. Real-time operation for the system software is also being implemented. So that system ability will improve to detect higher thickness medium and the motion of the target object can also be calculated.
Footnotes
Declaration of conflicting interests
The author(s) declared no potential conflicts of interest with respect to the research, authorship, and/or publication of this article.
Funding
The author(s) received no financial support for the research, authorship, and/or publication of this article.