
Abstract
Automated driving requires a reliable digital representation of the environment, which is achieved by various vehicle sensors. Wireless devices for communication between vehicles and infrastructure (Car2X communication) provide additional data beyond the vehicle’s sensor range. In order to reduce the amount of on-road testing, there has been an increased use of numerical simulation in the development of automated driving functions, which demands accurate simulation models for the sensors involved. The present research deals with the development of Car2X sensor models for conceptual, automated driving investigations based on relatively simple yet computationally efficient mathematical models featuring parameters derived from on-road hardware testing. For analysis purposes, variations in range and reliability in different driving situations were measured and depicted in Google Earth. For the sensor model, a combination of geometric and stochastic models was chosen. The modeling is based on a link budget calculation that considers system and path losses, where wave propagation is described using Nakagami probability density functions. For intersections, an additional term is added to account for the path loss with geometric parameters of the intersection. After model parametrization, an evaluation was conducted. In addition, as a sample case, Car2X was added to an adaptive cruise control, and the improved functionality was demonstrated using vehicle dynamics simulation. This extended adaptive cruise control used information from the indicator of surrounding vehicles to react faster to lane changes by these vehicles.
Motivation
There are several motivations behind the ongoing development of assisted and automated driving functions. Traffic safety is expected to improve, since about 90% of accidents are primarily caused by human error. 1 Driving comfort is improved by reducing the driver’s workload, especially in monotonous situations (e.g. traffic jams). The human driver will be allowed to use the time spent in the car productively, and even people with limited driving skills (disabled or elderly people) will be able to participate in mobility. Finally, fuel reduction will be achieved via the economical driving modes and predictive operation strategies of alternative drive trains. Nevertheless, several challenges must be met before the vision of a self-driving vehicle can be realized.
One of the main challenges is to replace human perception with vehicle and infrastructure sensors. In order to plan routes and control the motion of the automated vehicle, the control algorithm for vehicle guidance has to be fed with a suitable digital representation of the environment that contains the relevant information (e.g. relative speed and distance of objects, classes of objects). There is an increasing tendency to use sensors that deploy different measurement principles and then merge the data for maximum reliability.
However, one drawback is the relatively short range of onboard vehicle sensors, which does not allow for certain advantages of automated driving, such as long-term predictive mission planning. 2,3 One solution to this issue is to use the information measured by the sensors of surrounding vehicles and the infrastructure. There are several different terms and definitions for these types of communication, but one widespread term in Europe is Car2X. A consortium of experts, technology suppliers, and manufacturers is working to develop standards and applications for the United States, Japan and Europe.
For the current research, the specific standards mentioned refer to the European model, which is based on the Institute of Electrical and Electronics Engineers (IEEE) 801.11p standard. 4 The Institute of Electrical and Electronics Engineers (IEEE) 801.11p defines the physical and data link layer related to the open systems interconnection (OSI) model. This fundamental description is the basis for the European Telecommunication Standards Institute (ETSI) and the Car-to-Car Communication Consortium for the layers of the OSI model standard. 5 The major application of the modeling approach presented here is the fast conceptual investigation of future automotive driving functions via numerical simulation.
The novelty of this research is the combination of existing methods in wireless sensor modeling, which are parameterized via on-road driving tests with different classes of driving environments using high-precision measurement equipment. A sample case study was conducted to demonstrate the benefit of the approach.
The structure of the article is as follows: “Background” section summarizes the state of the art in both ITS G5 standardization work and wireless sensor modeling, which is the basis of this research. “Car2X sensor modeling” section describes the selected modeling approach, which is segmented into the general and the intersection model. “Model verification” section describes the setup and results of the on-road tests, as well as the verification of the sensor models. “Integration into full-vehicle system simulation” section demonstrates the application of the models when integrated into a full-vehicle simulation environment and “Conclusions” section summarizes the research.
Background
European Car2X standardization
The carrier frequency for Car2X communication is 5.9 GHz, with some channels operating at slightly higher or lower frequencies. The bandwidth of all channels is 10 MHz. Figure 1 shows the different bands of the ETSI ITS-G5 standard, which are dedicated to different tasks. The transmitter power is set to 25 dB, and the receiver’s sensitivity is −95 dB. 6 Since the network is a ad hoc network, it is managed by the clients, and no master or main device is required. Therefore, no network infrastructure is needed. The benefits of an ad hoc network are the smallest possible latency time, a highly localized network load, local privacy, 4 and high flexibility. 7
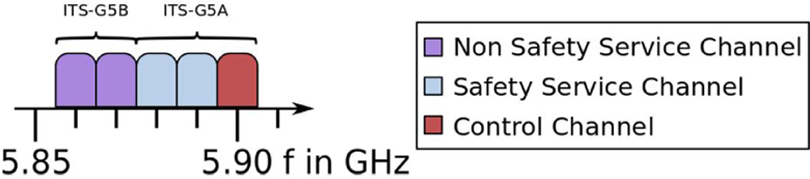
Channel assignment of ETSI ITS-G5 standardization. Source: Bloessl et al. 4 ETSI: European Telecommunication Standards Institute.
Several types of messages are available. One important message type is denoted cooperative awareness messages (CAM). Every client in the network broadcasts these messages periodically. The message includes some basic information, such as global positioning system (GPS) coordinates, client type (e.g. infrastructure, truck, car), and others. The CAM provides valuable information on other Car2X-equipped road users. This message will be introduced to the market in the first planned introduction of Car2X systems.
The CAM is highly relevant to safety. For instance, systems such as intersection or traffic jam assistants will rely on CAM for information about the tail end of traffic jams or whether surrounding vehicles are braking or turning. To support different tasks, the CAM is split into different cases with different rates of periodicity. 4 Table 1 shows different use cases with varying minimum periodicity. Depending on the priority of a use case, the notification frequency is higher or lower. If a channel is close to overload (e.g. in the case of a traffic jam involving many vehicles), each client decreases the notification frequency. 8
Use case notification frequency of CAM; priority in driving situations determines the minimum periodicity.

Source: Intelligent Transport Systems. 8
CAM: cooperative awareness messages.
The time delay between transmitted and received messages depends on the message size, data rate, channel load, traffic density, application, and other factors. Details can be found in the study by van Eenennaam et al., 9 where the allowable latency for traffic safety applications was set to 100 ms, which conforms to the chosen 10 Hz measurement frequency in the present research (see “On-road measurements” section). The maximum number of vehicles involved in a C2X communication network is particularly dependent on the length of application commands. For an example, see the study by Vinel, 10 where the probability of beacon delivery for longer contention windows was above 0.8 for 50 vehicles.
State of the art in Car2X sensor modeling
Automotive manufacturers have to investigate a large number of scenarios to ensure the safety of functionalities to be used for series production. For conceptual investigations, Car2X simulation models are needed to test applications using Car2X information. Apart from different wireless propagation effects, which various effect models can described with relative levels of accuracy, existing published models with a similar general problem were analyzed, and these are presented in the following section.
Most of the models discussed in the relevant literature, which are hybrids of three approaches mentioned below, describe the wireless propagation effects more or less accurately. The models are commonly divided into line-of-sight (LOS) and non-line-of-sight (NLOS) models because NLOS models have smaller NLOS ranges and higher fading effects.
Deterministic modeling: Maxwell’s equations, which require knowledge of shape, material, magnetic and electric behaviour, provide the foundation for deterministic wireless propagation models. This high amount of data has to be collected, after which a high computation effort is required.
11
Geometric-based models, also called ray-tracing models: All rays and possible reflections are calculated to determine a possible communication connection. This approach is a nondeterministic, polynomial time problem which requires comparatively high computational effort.
11
Stochastic propagation: Since these models forego geometric or physical equations and instead describe the explained effects with general stochastic equations, the results may not be as precise as other models. They are often used to model small-scale fading, such as multipath component fading and scattering.
11
The following models are a small selection of the possible realizations that appear most frequently in research. The model abbreviations used in the present article are shown in parentheses after each model name.
MIMO model (MA)
The multiple-input and multiple-output (MIMO) model 11 is a hybrid of geometric-based models (e.g. for road width) and stochastic models (e.g. for scattering effects). Although the model can represent many scenarios very precisely, it is very complex with respect to computation time and parametrization.
SUMO MOVE model (MB)
The SUMO MOVE model 12 is an association of MOVE (MObility model generator for VEhicular networks) and SUMO (Simulation of Urban MObility) simulation software. They provide a combination of a driving and a wireless network simulation.
NS-based models (MC, MD, and ME)
A network simulator (NS)–based model, as described in the study by Stepanova and Sukuvaara, 13 represents a symbiosis of the two simulation techniques, SUMO and NS. Due to its wide range of application, NS is a widely used tool that requires a full setup of network layers. In the study by Al-Bado et al., 14 another hybrid of NS and a geometrical model is described, while Benin et al. 15 describe a stand-alone NS model.
Trace-based model (MF)
Trace-based models, as presented in the study by Goebel et al., 16 feature ray-tracing techniques, but this does not meet the requirements for a deterministic approach.
Payload model (MG)
The payload model 17 is a more simple approach based on the two-ray ground propagation, which earlier was called breakpoint. Fading is simulated with a random Nakagami probability distribution, and the payload is varied. However, since the scenarios discussed in the source were static, this model does not fully match the current approach.
Geometry stochastic models (MH)
The idea of this approach is to combine geometrical features with stochastic fading description. The model and parametrization method is described in the study by Abbas et al. 18 and Mangel et al. 19
Car2X sensor modeling
As a next step, a cost-utility analysis was conducted on the modeling approaches described in “Background” section with respect to the following criteria: real-time capability for evaluating the computational effort, mathematical description to gauge the accuracy of mathematical documentation, deterministic behavior of the modeling technique, simplicity of the realization, and parametrization and the possibility to use it for automotive applications. For further details and explanations of the cost-utility analysis see the study by Markovic. 20 The analysis showed that MH was the best model for the present application. However, since it is was designed for wireless propagation at intersections, it had to be adapted for additional use cases, thereby yielding the general model, which is presented in the following section.
Methodology of the general model
The general model has to fit nearly all situations in Car2X communication except intersections, including motorway, rural, and suburban areas. Within these areas, objects with different characteristics (e.g. woods or walls) block the LOS. These different areas demanded various adaptations. Fading is highly dependent on the number, size, and shape of interacting objects. It is realized using Nakagami distributions because it needs only one parameter to fit both LOS and NLOS scenarios. In a certain configuration, Nakagami, which is based on the Euler-Gamma distribution, is comparable with a Rice and Rayleigh distribution.
Equation (1) shows the Nakagami probability density function PDFNak of the general model, where x is the direct distance between the clients. The function Γ(m) represents Euler’s Gamma function. 7 The characterizing parameter is the m-factor, which makes it possible to modify the equation to Rayleigh or Rice, with Ω the average fading power.

Because different parameters are required for the wave propagation models, a classification of cases according to interacting object was required. The classes were:
LOS, without any large objects blocking the wave propagation;
wood and wall, including interacting objects consisting of trees and walls;
buildings, including interacting objects consisting of buildings;
wood, including interacting objects consisting only of trees;
buildings and wood, including interacting objects consisting of trees and buildings; and
hill, describing a road with slopes that block wave propagation.
This classification eliminated the need for detailed modeling of the environment, including the reflectivity of objects by these rough environment classes. Equation (2) describes the general model for all cases in the project. The Car2X’s receiver sensitivity is PRX, and the transmission power is PTX. The equation contains two types of loss: system loss LS, which is constant for every case, and path loss LP.

Furthermore, equation (2) shows a comparatively simple link budget calculation. Link budget calculation describes the start point (PTX), the end point (PRX), and all losses in between. The necessary hardware specification is defined in CohdaWireless. 6 The maximum transmitted power PTX is 25 dB and the receiver sensitivity PRX is −98 dB. The system loss LS is about 3 dB. Thus, all necessary parameters are defined by the specification except of the path loss. The path loss model is defined in equations (3), (4), and (5) and is a possible interpretation of a two-ray ground model, expressed by

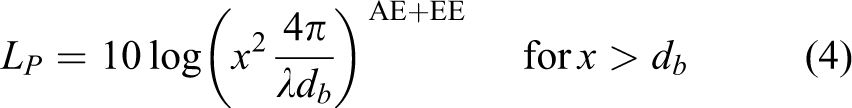

where x is the direct distance between the clients, λ is the wave length of the transmitting frequency, AE is the exponent of the different areas, EE is the exponent of the environment between the clients, db is the distance of breakpoint (two-ray ground model), ht is the height of the transmitting car’s antenna, and hr is the height of receiving the car’s antenna.
The next step was to parametrize the values of the general model. The parametrization was derived by minimizing the mean squared error using the MATLAB optimization toolbox and variations of the parameters. The mean squared error was automatically minimized by varying the parameter until the error reached a minimum.
The simulation error was calculated in two different ways. First, an absolute error e was calculated, which is shown in (6). Second, a relative error erel (7) was calculated.


where xsolid is the minimum distance without communication loss in the measurement, and xmodel is the same but calculated by the Car2X sensor model.
Tables 2 and 3 show the resulting parametrization. The m-factor of the Nakagami distribution is the distinct value which describes fading. The fading values that characterize different areas were taken from the relevant literature 17 (Table 2). In the motorway use case, Nakagami is similar to a Rayleigh distribution. If the m-factor is increased, the Nakagami is similar to the Rice distribution. The Rayleigh distribution is preferred for LOS scenarios, while Rice distribution describes NLOS fading.
Parameters AE and m-factor for the general model in different environments of the measurements.a

AE: Area exponent.
a AE and related m-factor are described, see equations (3) to (5).
Parameter EE for the general model in different environments of the measurements.a
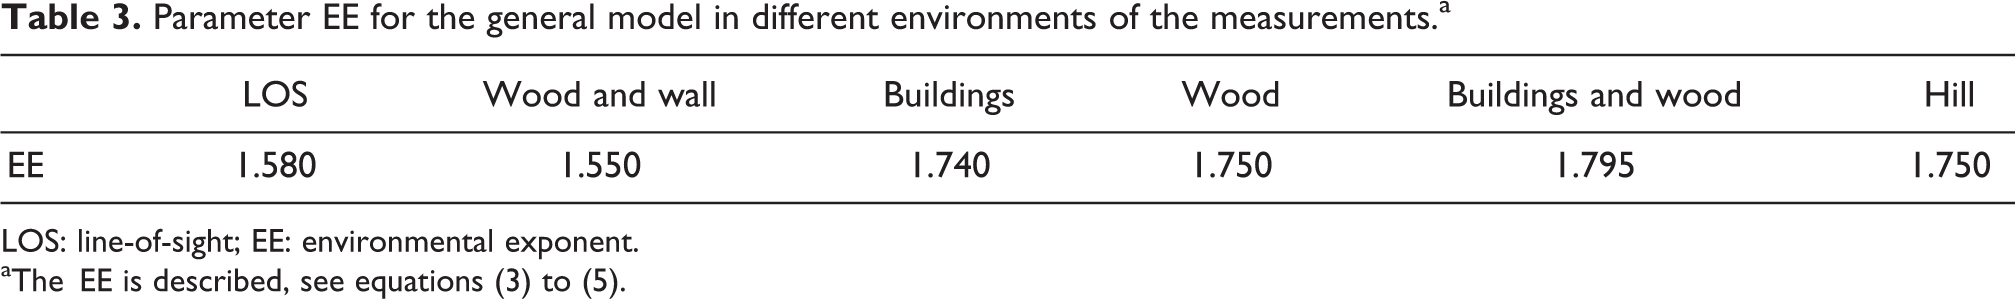
LOS: line-of-sight; EE: environmental exponent.
aThe EE is described, see equations (3) to (5).
Methodology of the intersection model
To account for reflection phenomena, intersections need a more precise geometry description. Suitable models were found in the study by Abbas et al. 18 and Mangel et al. 19 and modified for the intersection modeling approach presented here. Similar to the general model, equation (8) determines all losses between the Car2X clients. The new term within the link budget equation is iSLSU. The parameter iS is a boolean factor set to 1 for suburban modeling and set to 0 for urban modeling. In addition to this boolean value, a constant loss LSU is subtracted from the link budget for suburban scenarios due to the higher amount of wood and plants in suburban areas. 18 The technical specifications, such as transmission power PTX, receiver sensitivity PRX, and system loss LS, are equal to the general model. The path loss equations (9) and (10) are similar to the general model, with some additional geometry inputs and exponents. The breakpoint db is calculated the same as in the general model, as shown in equation (5)


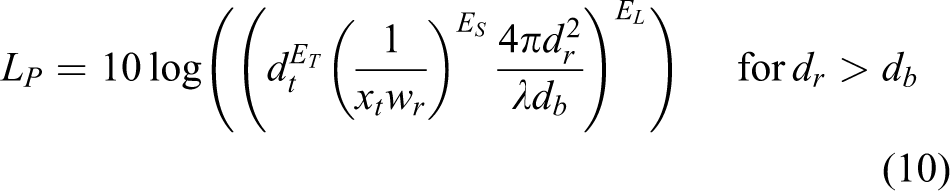
where dt is the distance between the transmitter and the middle of the intersection, dr is the distance between the receiver and the middle of the intersection, wr is the width of the receiver’s street, xt is the distance between the transmitter and the wall in the direction of the receiver, db is the distance to the breakpoint, λ is the wave length of the transmitting frequency, ET is the transmitter distance exponent, ES is the street exponent, and EL is the loss exponent.
Figure 2 is a visualization of the geometrical dependencies. The corresponding distances that are used for the model are based on the intersection’s center. Mangel et al. 19 called this VirtualSource because a fictional wireless source is created for the wireless communication instead of the transmitter. The power of the virtual source is determined by the transmitter’s position in relation to the middle of the intersection. Further simulation and explanations are performed with a nonmoving transmitter and a receiver at various distances to the VirtualSource.

Geometric model of the model. Source: Mangel et al. 19
Table 4 shows the final parametrization. The parametrization values were taken from the work of Mangel et al., 19 where the parametrization was based on the measurements in Munich. Since urban and suburban environment in Austria was assumed to be similar to Munich, no new parametrization was conducted. The calculation required a breakpoint for the distance equation. Fading was simulated by a normal distribution. For further details see the study by Mangel et al. 19
Parametrization of exponents and suburban loss, see equations (8) through (10).

Source: Mangel et al. 19
Model verification
On-road measurements
On-road measurements were conducted in different surroundings in Austria using two vehicles with Car2X equipment. The results were logged with an onboard data acquisition unit. 21 Signals such as GPS coordinates with an accuracy of about 2 cm, velocity, amount of available GPS satellites, and accelerations were provided by a combination of an inertial measurement unit and a GPS receiver with an online correction of the position data. Details of the measurement procedure and equipment can be found in Markovic. 21 The Car2X from CohdaWireless 6 hardware devices used were configured in accord with the ETSI ITS-G5 standard. Furthermore, several source code modifications were made for the measurements. 21 On every periodic transmission (TX) and receiving (RX) message, a notification was sent to the measurement unit via controller area network bus. This setup was installed in both cars. The defined scenarios were driven in different areas (e.g. motorway, rural, suburban, and urban areas). In urban areas, a special focus was placed on intersections with no LOS. The logged measured values were stored in tables, and a post-processing stage was necessary because the measured GPS coordinates had to be linked with the environmental features. Therefore, the measured data was depicted and analyzed in a special Google Earth post-processing application. 21 Several icons, which are shown in Figure 3, were created to illustrate points of interest in Google Earth. To distinguish the two cars, they are named EGO and TARGET. In addition, info-boxes were added that contain metadata such as date, velocity, and relative distance, which could be opened by clicking on the icon.

Google Earth icons created to illustrate the necessary features, the ego vehicle is depicted in red, the target vehicle in blue icons.
Figure 4 represents one example of the Google Earth post-processing. EGO and TARGET vehicles are traveling in opposite direction on the same road, and the measured distance is the longest range between the cars with no lost signals of Car2X messages.

This Google Earth illustration example shows a contraflow scenario in a rural area at the distance of solid communication with no signal loss. The measured example’s ID is 22, as listed in Table 6.
Table 5 shows all measurement results on the motorway including three different maneuvers. These maneuvers were:
Convoy: Scenario with ego and target vehicle traveling in the same direction.
Semi-static: Scenario with stopped ego vehicle and target vehicle passing by.
Contraflow: Scenario with ego and target vehicle traveling in the opposite direction.
Measurement results for motorway area in different driving scenarios as mentioned in the second column “maneuver.”a

LOS: line-of-sight.
aColumns “route” and “date” describe the date and location of the test, column “objects between” describes the presence of obstacles, columns “solid distance” and “maximum distance” the minimum distance for a solid transmission of data and the maximum distance where first transmission of data was observed.
Table 5 contains a unique ID, the type of maneuver, route, date, distances, and the objects between a direct connection. Tables 6 and 7 have the same structure, but measurement IDs are unique in the tables. Environmental conditions are shown by maneuver, route, date, and objects between the cars. Solid distance is the maximum range transmission without signal loss. Maximum distance is the last/first message of losing/establishing contact with the other Car2X client. In Table 5, the first (no. 1) and last two examples (nos 16 and 17) show similar behavior, omitting small measurement fluctuations. Therefore, contraflow and convoy scenarios were treated with the same modeling approach as well as semi-static scenarios with lower relative velocity than the aforementioned scenarios.
Measurement results for rural area, for explanation of the different columns refer to Table 5.

LOS: line-of-sight.
Measurement results for suburban area, for explanation of the different columns refer to Table 5.

Table 6 lists all of the rural measurement results. Although the performance was highly dependent on objects (i.e. buildings) between the cars, the distances were much higher than those for onboard sensors. The shortest distance of solid contact was 250 m.
Table 7 shows all scenarios measured in suburban areas. The performance dependence on relative velocity between the two cars is negligible for suburban cases. As a consequence, the maneuvers convoy, contraflow, and semi-static delivered similar results and were therefore merged into the scenario named general.
For intersections, where one car was moving and the other standing still near the intersection, a more detailed analysis is required, since the intersection’s geometry strongly influences the results. For suburban areas, this detailed analysis is also required for the subsequent model development and parametrization.
Table 8 shows a more detailed analysis for the suburban areas. This detailed analysis is also necessary for subsequent model building and parametrization. The symbols in the tables, as defined in Figure 2, are width wt of nonmoving car’s road, distance xt between nonmoving car and an object (wall, building) in the direction of the moving car, distance dt between nonmoving car and the middle of intersection, width wr of moving car’s street, distance dr between moving car and the middle of intersection with solid communication, and longest distance drmax between the moving car and the middle of the intersection.
Intersection results for suburban area.a

aThe parameter represent measurements used for the subsequent model verification, see “Verification of the general model” section.
Table 9 represents all measured urban intersection scenarios. The analysis was done in a similar manner as for Table 8 above.
Intersection results for urban area.a
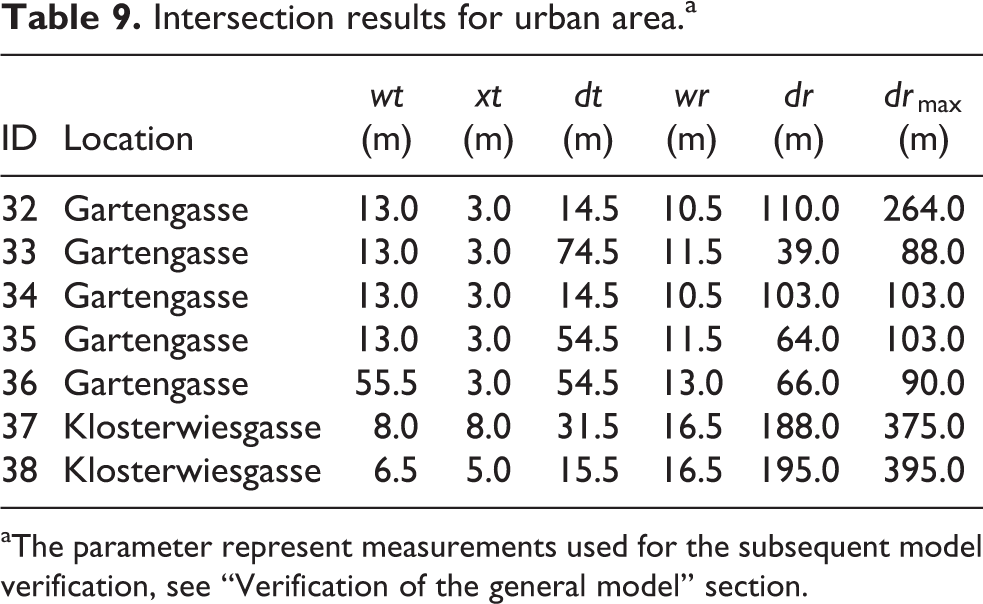
aThe parameter represent measurements used for the subsequent model verification, see “Verification of the general model” section.
To sum up the measurements results, the Car2X performance of the tested hardware under real condition was remarkably good. Due to the high dispersion of some scenarios, a universal model suitable for all scenarios is not simple to achieve.
Verification of the general model
Table 10 shows the errors of all simulated scenarios based on measurements. The corresponding real scenarios are indicated by their ID. Since the error was calculated without stochastic fading, error values are reproduceable. The model is evaluated using the relative error erel. This relative error provides comparability between the different areas. Furthermore, the model was adjusted pessimistically such that the model never predicts a received data package when there was no transmission in reality. Therefore, high absolute errors in most cases are negative, as shown in Table 10. If a negative error e is calculated, then the real measurement reached a larger distance than the model. Furthermore, to classify the model, a mean relative error, its relative variance, and a relative standard deviation of each area were determined. On motorways, the model has a mean relative error of 9.14% and a relative standard deviation of 6.8%. In rural areas, the model has a mean relative error of 11.15% and a relative standard deviation of 6.3%. Suburban simulation has a relative mean error of 16.8% and a relative standard deviation of 4.3%.
General model errors e and erel in different areas.a

aThe results show a good correlation except for suburban areas.
Although the errors seem high, the model performance has to be put in context with the influencing parameters in real measurements. Nearly every measured scenario is independent of other examples. Not only velocity and area are different but also surrounding objects. Since the model’s inputs are only area and LOS-blocking objects, the model matches real-world conditions remarkably well. Suburban areas are a special case because the environment is very difficult to describe in a deterministic manner. Suburban areas can be villages with a high or low amount of plants. In the case of abundant vegetation, the environment attenuates wireless propagation, which is remarkably higher than in areas with low vegetation. This significant environmental variability is mostly observed in suburban areas. To increase the weaker performance of suburban simulations, more input parameters and a specified suburban model are required. Nevertheless, the models presented here are well suited for the design of Advanced Driver Assistance Systems (ADAS) in an early development stage. To summarize, this model provides real-time capability and deterministic behavior (if fading is not included). Although the precision could be increased with a more complex model, this would require more input parameters, which would also increase the parametrization effort required. Additional inputs could consider the geometry of the surroundings or the electrical and magnetic behavior of objects, for example. Nevertheless, fading is a wireless propagation 7 effect that the model must consider.
Verification of the intersection model
The error was calculated in the same way as for the general model. Table 11 shows the absolute error e and the relative error erel of the intersection model.
Intersection model error in different areas with good model performance, except for suburban areas.

The model showed a relative mean error of 30.1% and a relative standard deviation of 14.8% in suburban scenarios, and a relative mean error of 13.9% and a relative standard deviation of 10.1% in urban scenarios. The intersection model’s inferior performance in suburban areas was due to the specific environment of the intersection chosen for the measurements. All four documented scenarios in suburban areas were measured at the same intersection, which had no buildings in front of the transmitting car, which enhanced the wireless propagation into the street with the receiver car. Therefore, the model for suburban areas is better suited for standard intersections with buildings on the corners. However, the model’s performance in urban areas was encouraging, despite the high number of interacting objects. The model considered the geometry of the intersection, but parked and moving vehicles were omitted. With respect to the motivation for the phenomenological modeling approach, that is, to provide a simulation tool for the conceptual investigation of automated driving functions, the accuracy of the model is acceptable. Compared to the general model approach, the higher error of the intersection model could be improved by implementating a ray-tracing approach featuring multipath wave propagation. The associated need for geometry and material properties of reflecting surfaces would require a detailed environmental model, which is beyond the scope of the present research.
Integration into full-vehicle system simulation
This section describes a possible application of the model: the conceptual investigation of a adaptive cruise control (ACC) enhanced by Car2X communication. In the future, the capabilities of a Car2X-equipped car will be manifold. The first step for Car2X market penetration will be a human machine interface notification to warn or notify the driver. Warnings could be a traffic jam ahead or an emergency vehicle approaching, or the information could deal with traffic density in the surrounding area. Once these passive solutions have been successfully introduced, Car2X will also be integrated into active systems. Although the development of ADAS tries to cover as many driving scenarios as possible, there are still some remaining situations which would lead to accidents or dangerous situations, depending on the specific system. ACC is an ADAS that controls the relative distance to a leading vehicle. Frequently, the distance is measured with a radar sensor placed in the front of the car. When driving cars with a standard ACC, dangerous situations can be the result of a target vehicle which cuts in between the ego and leading vehicles at short distance. Within this project, a new strategy was developed to handle these situations. The following explanation describes the simulation scenario from the following car’s point of view (EGO) on a two-lane motorway. EGO is driving in the left lane behind a car (TARGET) and the relative distance is controlled by EGO’s ACC. TARGET is overtaking another car (DISTURBER), which is driving in the right lane. Just before EGO overtakes the DISTURBER, DISTURBER activates the left indicator and starts to change to the left lane. EGO would crash into DISTURBER if no deceleration was initiated.
This scenario was simulated in IPG CarMaker, which is a vehicle dynamics simulation software on the full-vehicle level. IPG CarMaker provides an ACC implementation used to demonstrate the presented Car2X sensor model. Figure 5 shows a screenshot of the IPG CarMaker simulation.
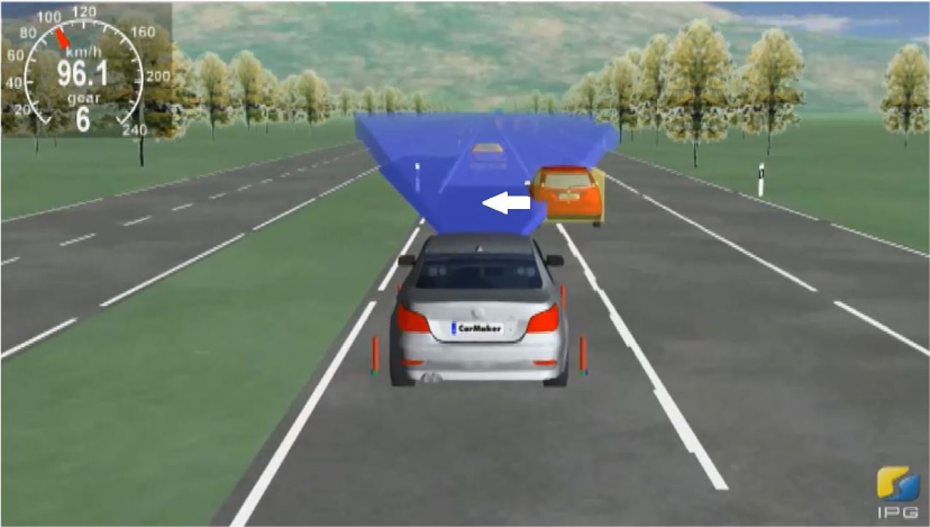
EGO is following TARGET with ACC-controlled relative distance. DISTURBER starts to cut-in. ACC: adaptive cruise control.
Based on this scenario, two different simulations were carried out. In the first simulation, the relative distance between EGO and TARGET was controlled by the EGO’s ACC. In the second simulation, this conventional ACC was extended by the Car2X sensor model, as presented in the previous sections (denoted as SmartACC below). Furthermore, TARGET and DISTURBER were also equipped with Car2X, thereby providing information on the distances between these three cars. The Car2X system of every car was transmitting vehicle position and indicator information. The transmission frequency was set to 2 Hz, which conforms with the ETSI-G5 standardization. Therefore, every involved car’s Car2X system was informed of the movements of the others within the range of the Car2X sensor model.
In the chosen scenario, the EGO vehicle was aware of the position of TARGET and DISTURBER via radar and Car2X sensor. At the start of the DISTURBER’s lane change, DISTURBER activated the left indicator. The Car2X notification of the DISTURBER now contained information about the activated indicator. EGO’s Car2X system received this notification, and EGO’s SmartACC reacted by an immediate switch of the ACC control from the TARGET to the DISTURBER. This resulted in an earlier reaction of the ACC controller because time delays were omitted from the processing of the radar sensor signals.
No accidents were caused by the DISTURBER in both exemplary simulations. However, during the first simulation, the minimum relative distance of 9.3 m between EGO and DISTURBER was dangerously short. This was due to the fact that the conventional ACC only reacted to the DISTURBER when half of the lane change had already been performed. This behavior can be explained by the target selection algorithm of the radar sensor. This later reaction may cause dangerous situations on the motorway in similar scenarios. In the case of the presented scenario, the SmartACC was able to react faster and provided important additional time for the ACC with respect to relative distance (Figure 6(a)) and accelerations (Figure 6(b)).
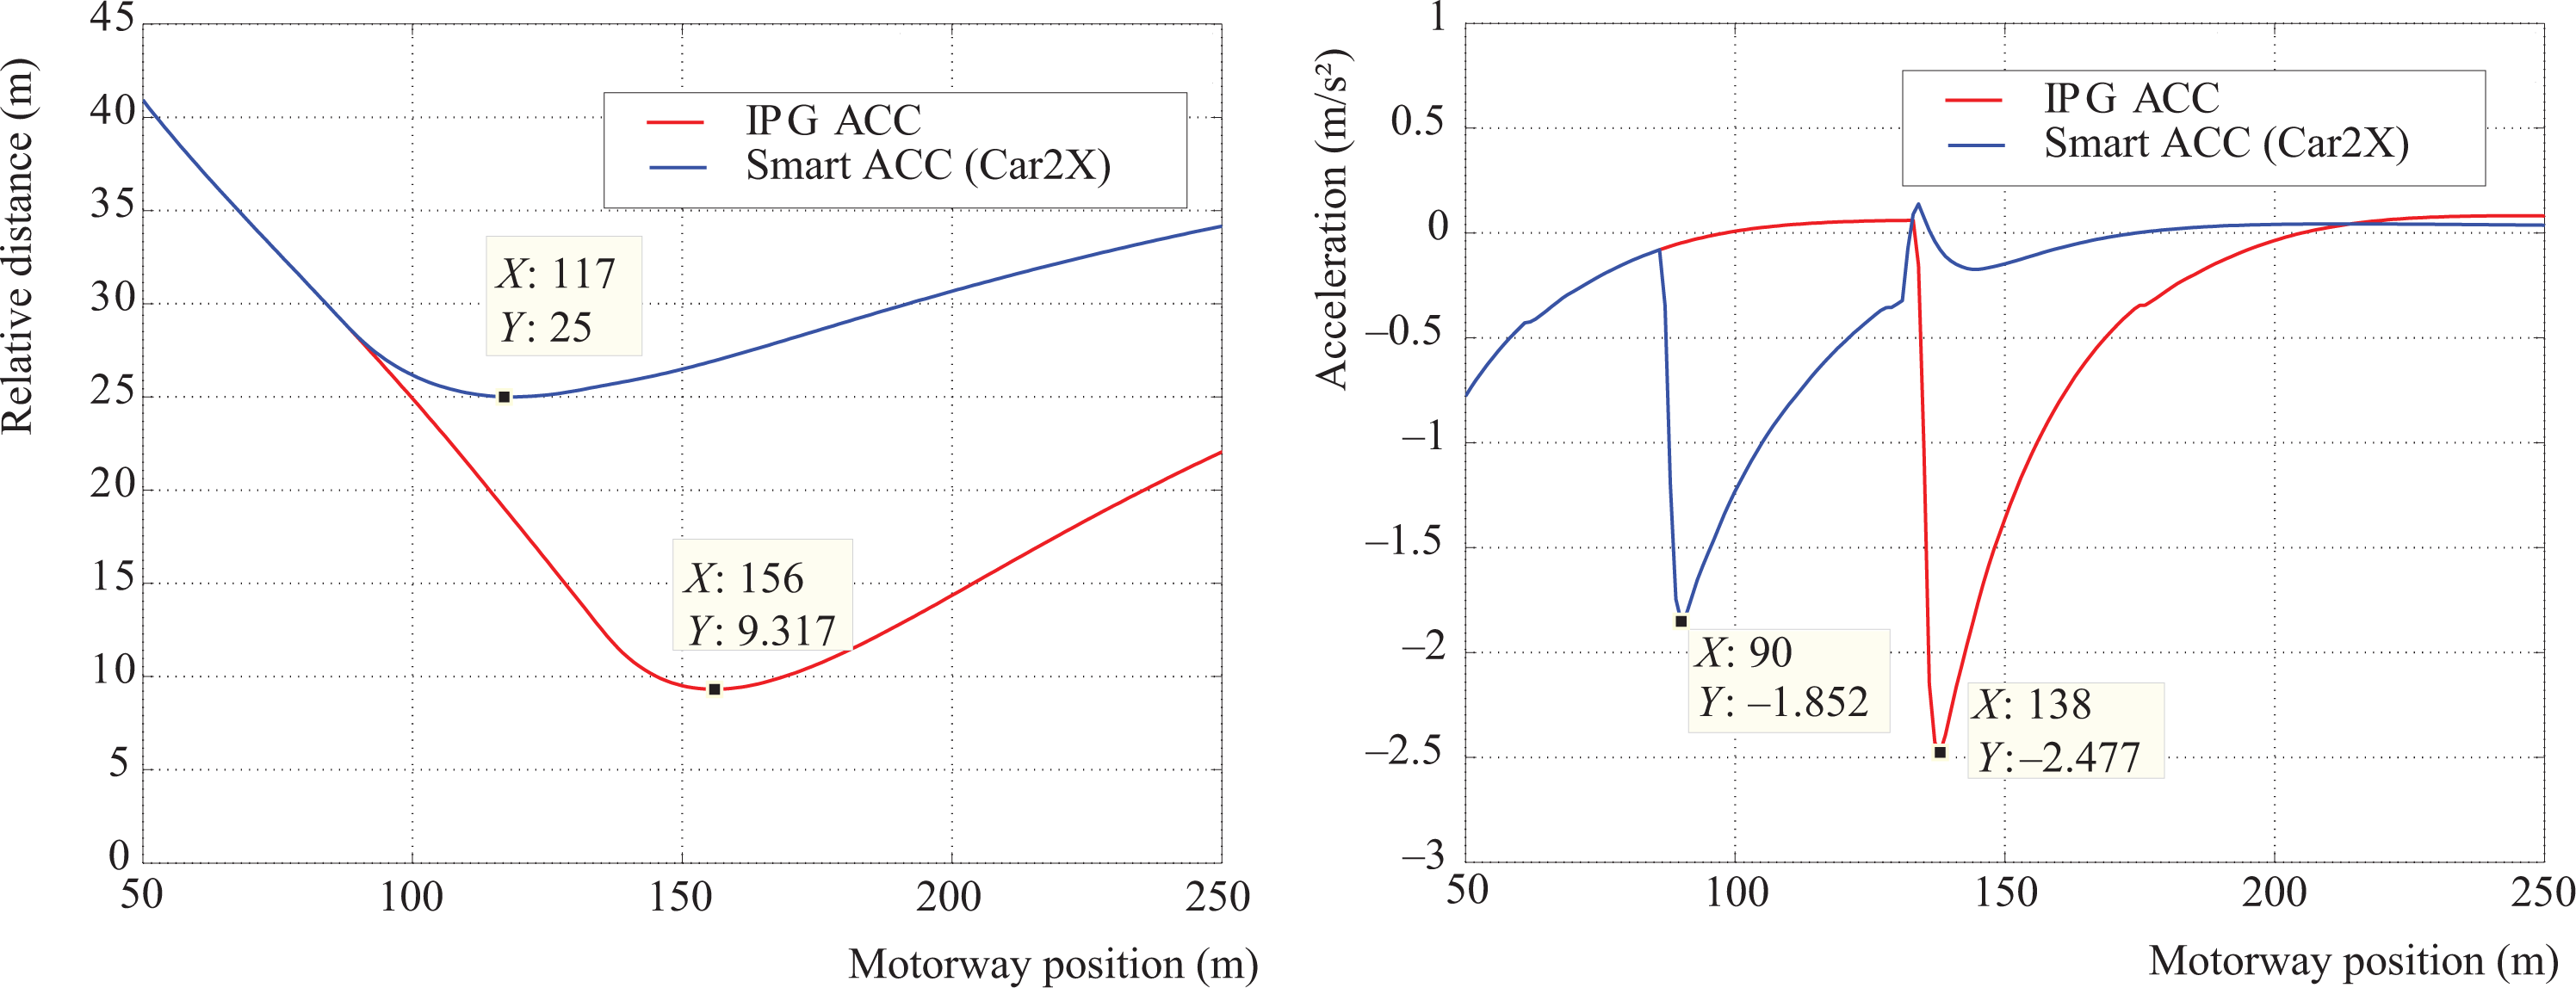
Improvements by SmartACC, the abscissae describes the position of the vehicle on the motorway during the driving scenario, the ordinate in (a) the relative distance between the vehicles (EGO and DISTURBER) and the ordinate in (b) acceleration of the ego vehicle during driving scenario. ACC: adaptive cruise control.
Figure 6(a) illustrates the relative distance between EGO and DISTURBER. It is evident that the SmartACC reacted earlier in this situation, and the minimum relative distance was 25 m, compared to 9.3 m for the conventional ACC. Figure 6(b) represents the deceleration of the EGO vehicle initiated by a conventional ACC (maximum 2.5 g) compared to the SmartACC control (maximum 1.9 g). Thus, SmartACC reacted earlier and more smoothly to defuse the situation. Not only safety was increased but comfort was also improved.
Conclusions
In order to develop new functions for automated driving, virtual simulation in the conceptual phase of vehicle development is beneficial. For Car2X applications, virtual sensor models are required which are the scope of the presented research. For this, previously measured data sets of on-road vehicle testing with Car2X sensors in different surroundings were analyzed.
Two different models for Car2X sensors were developed. The first model (general model) was made to fit general cases (e.g. contraflow, convoy, or semi-static scenarios) in different areas (e.g. motorway, rural, suburban, urban). The model was a link budget calculation with a focus on the path loss modeling. The path loss calculation was a variation of a two-ray ground model. The intersection model featured additional geometrical information for NLOS situations.
Simulations of suburban areas with different amount of plants and trees showed a weaker performance with both models due to the strong variation of the environmental surroundings. The presented models cannot be generally verified, as the results are limited to measurements in and around the city of Graz, Austria. However, a remarkably good general behavior can be assumed due to the variety of scenarios and areas used for the parametrization.
The last step was the integration of the Car2X sensor models in a vehicle dynamics simulation software. The benefit of enhancing an ACC with Car2X sensors was proven by an vehicle dynamics simulation environment. The exemplary application included information about the turn indicator, which improved the ACC performance by omitting time delays during switching between the target vehicles of the ACC controller.
Footnotes
Declaration of conflicting interests
The author(s) declared no potential conflicts of interest with respect to the research, authorship, and/or publication of this article.
Funding
The author(s) received no financial support for the research, authorship, and/or publication of this article.