
Abstract
In recent years, humanoid–biped type robots are being adopted by academic and research institutions to create an ecosystem that promotes the development of innovation and social appropriation of technology. Robot-taken decision projects on NAO robots in the field of artificial vision are more common than those ones related to auditory events for the same purpose. The main motivation for this work is to demonstrate the convenience of using an acoustic signal stage, for the classification of common wastes produced at the university. This project establishes an ideal scenario which allows taking it as reference for future projects in the acoustics field, by a methodology that enables audio signals acquisition and its real-time processing in NAO robots. This methodology consists in the robot’s programming for autonomous identification of sounds, which are sampled and saved in raw data. Then, a mathematical treatment is made in order to establish the ranges of frequency for an appropriate classification of materials. In the end, NAO robot identified and classified main wastes produced on the campus: cardboard, plastic, glass, and metal.
Keywords
Introduction
More than 40 years of research state that the foundations of object categorization are given from exploratory behaviors and sensations during human infancy. 1,2 This makes interaction, a key factor to apply in robotics for the purpose. To date, robot manipulation in simulation and in controlled environments performs well if they know the state of the world with near certainty. Since robot manipulation relies on contact between the robot and the world, perception is one of the most important challenges facing the field. Although most object categorization systems used for perception in robotics and artificial intelligence are image-based, in NAO robots, El-Yacoubi et al. 3 highlight important disadvantages presented such as dependency in the amount of light which leads to constant calibration of cameras, manual tuning on color variations, high processing resources causing delays in displaying information, and limits in storage power for image and video. For example, using visual motion and shape contours, a robot can detect a specific object such as a bottle or a teacup. 4 Because image-based systems don’t use physical interaction, the functional properties of objects cannot be learned by these systems. 5 Research in developmental robotics has shown that robots can form meaningful behavior-grounded object categories using a single exploratory behavior and a single sensory modality. 2 Auditory events in NAO robots allow us to use less processing resources which translates in real-time information display and faster tasks in the robot’s decision-making process.
This work presents a method for specific object recognition with an NAO robot. It uses the frequency’s fast Fourier transform (FFT) range values to classify main wastes on the campus. This method consists in a humanoid robot’s programming for autonomous identification of auditory events, which are sampled and saved in raw after the setting of required parameters of the input signal. With the obtained FFT value, we are able to recognize each material. As mentioned, one of the main limitations for object recognition is that traditional methods use robotic vision which cannot perceive some material properties. 5
This project also attempts to encourage environmental awareness through classifying materials that represent an important part of urban solid wastes for recycling. This work shows the convenience of classifying materials through acoustic processing as a hallmark of each type of waste. Mexico generates 42 million tons of municipal solid waste per year. 6 Mismanagement of waste causes public health problems, wrong allocation of space and resources, environmental pollution and ozone depletion, among others. 7 A strategy to encourage environmental awareness and to generate less waste is to do appropriate waste separation and reusing practices.
Background
Acoustic properties
The work presented in this article focuses on material classification using the acoustic properties of different objects. Sound is a molecular oscillation of kinetic energy moving through a medium in the form of mechanical waves. 8 When an object is hit, the energy of impact causes deformations to propagate through the object, causing its outer surfaces to vibrate and emit sound waves. 9 Therefore, material composition can be deduced by analysis of acoustic measurements 10 such as amplitude, tone, and timbre.
The amplitude of the signal is proportional to the amount of energy and its intensity is the amount of energy on an area. The tone of a wave indicates whether the sound is severe, sharp, or medium; it is determined by the fundamental frequency of the sound waves. Timbre is the quality of sound for which two sounds with the same tone differ due to overlapping of different harmonics that give its characteristic shape to the sound wave. For example, a complex sound can be formed by a sum of simple harmonics with different frequencies and intensities.
Analysis by FFT: Spectral domain
The main information of sound waves is encoded in frequency domain, but the sampled sound in electronic devices is encoded in time domain. In Fourier analysis, a complex signal is decomposed in a set of unique frequency components, as Figure 1 shows. It transforms a signal in time domain to frequency domain without changing its information; however, it does not show the moment it happened within the time range of study. Simple signal frequencies with the widest amplitude are considered relevant for analysis. 12
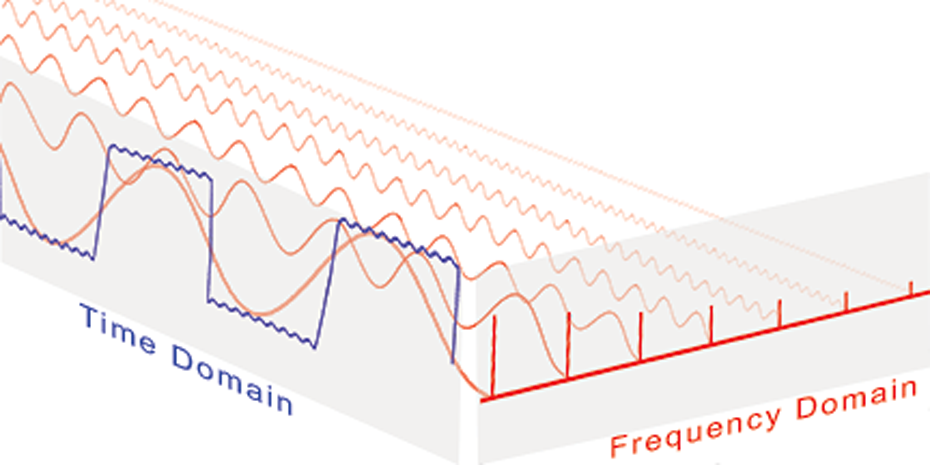
Compound vibration in time domain and frequency domain. 11
The Fourier transform is defined by equation (1) as y[k] of length N of the sequence x[n], where N is the number of samples to be analyzed
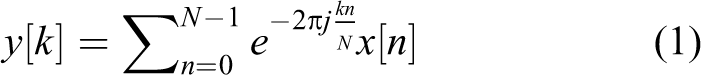
Physical signals on computer have to use finite and discrete models. When function values and the components of the Fourier transform of the signal are discrete, it is called discrete Fourier transform (DFT). The FFT obtains the same spectrum as DFT but faster with less number of calculations. 13 The FFT is defined in equation (2), as y[0] from elements y[1] to y[N/2−1]

Related work
Within the past 5 years, we have seen a rapid development in related fields such as machine learning, neurosciences, and cognitive psychology which contribute the way signals and information can be treated. 14 Nowadays, robots can do specific industrial tasks, assist humans in daily activities, and emulate human behavior, for instance, object categorization by their physical and functional properties. 5 Human–robot interaction is becoming more common; therefore, robot perception of the world has evolved into many modalities such as vision, speech, touch, among others. One example for artificial vision perception is presented by El-Yacoubi et al., 3 an autonomous assistive robotic system for human activity recognition from video sequences that integrates machine vision algorithms into an NAO robot, allowing it to recognize activities of daily life (sitting down, falling down, opening a door, applauding) performed by a person in a smart home.
Material and object classification can be through different methods, such as image detection, acoustic signal processing, haptic technology, or combinations of these. Griffith et al. 2 categorize objects with robots producing auditory and visual events by shaking blocks inside containers, in order to identify which containers are from noncontainers. This approach is made with multiple exploratory behaviors made autonomously by the robot (drop, grasp, move, shake, and flip) with data from two sources: microphones and 3-D cameras.
For instance, Gil et al. 15 use image detection utilizing RGB and HSV representation to recognize and track objects or people in video films. Brindza et al. 16 use audio processing and artificial vision for RoboCup 2012 Standard Platform League competition. It presents a localizing technique for a multi-robot team using sound communication. The goalkeeper acts as an artificial landmark by emitting a sound to inform the other robots to which goal they are defending. Griffith et al. 2 and Jivko et al. 17 use a 7-DOF Barrett WAM robot to infer the object it is interacting with from the sound generated by the object in a series of tests (pushing, grasping, and dropping).
In the study by Sinapov and Stoytchev, 18 a robot learns to recognize objects by the sound produced by different materials. Krotkov et al. 19 present a recognition method by tapping an object and interpreting its sound. In the study by Sinapov and Stoytchev, 20 a humanoid robot is trained to recognize objects by analyzing their visual and acoustic features. Audiovisual and haptic technology in the study by Nakamura et al. 21 are used to classify objects by their appearance, sound, and stiffness.
This article explores the convenience of object classification using sound, and as it is discussed in the next sections, significant benefits were found about it.
Experiment design
One of the main contributions of this project is to show the convenience on the classification of different materials (as industrial waste) by their sound characteristics, and task NAO robots can completely perform it, proving better results than traditional vision methods. With this contribution, we can help in ecological issues by the classification of municipal solid waste materials. We show the methodology that enables audio signals acquisition and its processing in real time for this robotic platform. All the steps for the classification of materials are shown in Figure 2.

Acoustic signal processing diagram.
Robot
The robot used in the experiment is a humanoid–biped type, NAO, from SoftBank Robotics Corp., Tokyo, Japan. It has tactile sensors, four microphones, two speakers, one battery, two cameras, four sonars, foot bumpers, prehensile hands, ATOM Z530 motherboard, 1.6 GHz CPU, 1 GB RAM, 2 GB Flash Memory, and 8 GB Micro SDHC. Its operating system is NAOqi, which is a cross platform for Windows, Linux, and MacOS. 22
The robot’s head is equipped with microphones that have a frequency range from 150 Hz to 12 kHz, and the microphones position is shown in Figure 3. The audio acquisition, audio treatment, and disposal routine are programmed in Python, which is an object-oriented programming language. To work in Python with NAO, it is necessary to install Python SDK, which includes APIs, modules, exceptions, dynamic typing, and classes that the robot requires. 24
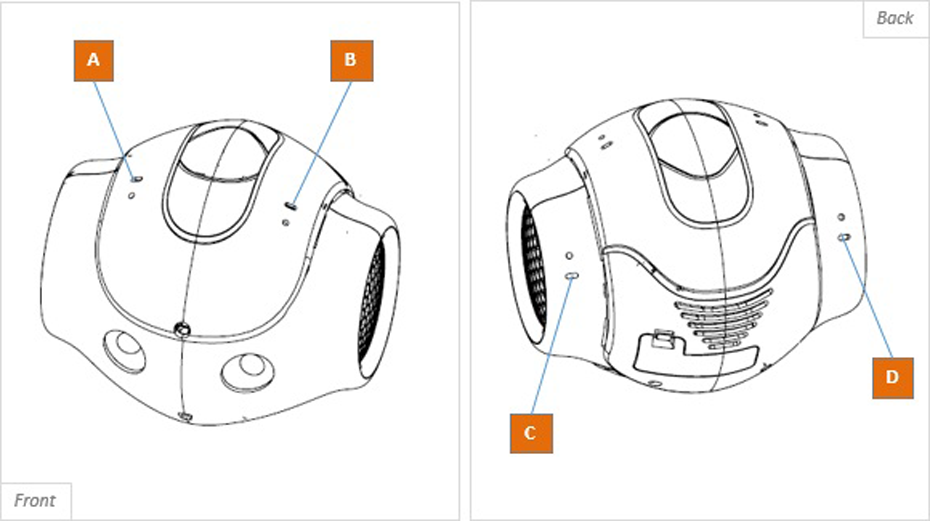
Position of front and back microphones on NAO robot version 5. 23
Objects
To encourage environmental awareness, the items selected for classification are part of municipal solid waste for recycling. The materials for classification are aluminum, cardboard, glass, paper, and plastic. The objects for each material are shown in Figure 4.

(a) Aluminum can. (b) Tetra pack. (c) Glass bottle. (d) Paper cup. (e) Plastic bottle.
The test consists in hitting each object five times, and it is repeated by hitting the same object in different points on its surface to observe variation in the audio obtained.
Processing audio signals with NAO
This work focuses on the acquisition of acoustic signals produced by different objects, their real-time processing, and their disposal routine, as shown in Figure 5.

(a) Acquisition sound routine. (b) Disposal routine.
The experiment starts with the humanoid robot standing up and waiting for an order, tap middle head sensor, to begin the object recognition routine which consists in taking an object and then hitting it to produce sound that is recorded by the robot.
Audio acquisition
The audio analysis is programmed in Python; therefore, it is necessary to have installed Python SDK on your computer. To communicate with the robot is essential to import the module “ALProxy” on the editor script, to create an object giving access to one of NAOqi modules, and to call one of its available methods. 25
NAO robot uses Advanced Linux Sound Architecture library to produce or record sound. To process data coming from the microphones on the robot is necessary to first subscribe to ALAudioDevice module. It provides other NAOqi modules with access to NAO’s audio inputs and outputs 26 as Figure 6 shows.
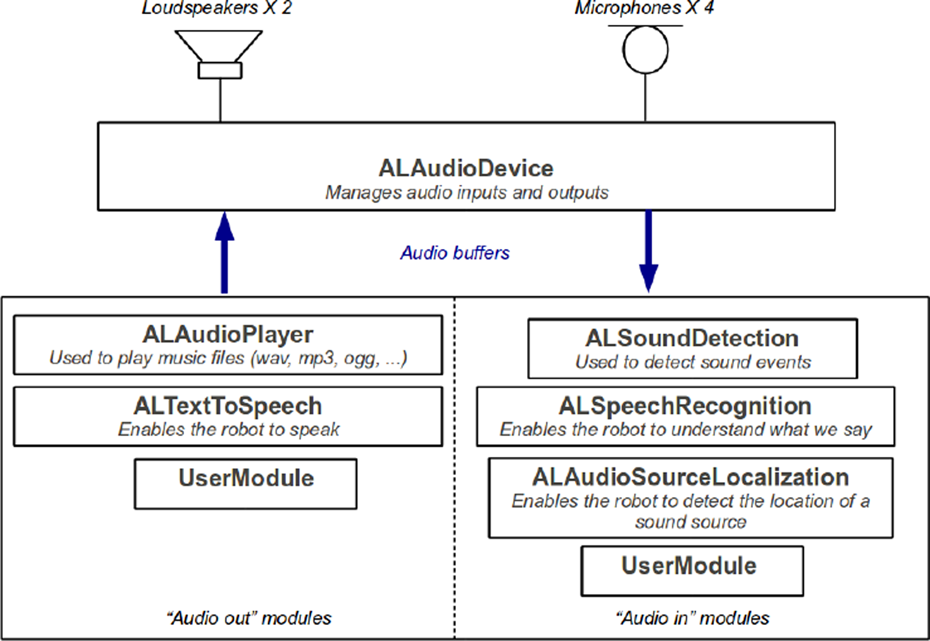
ALAudioDevice diagram. 27
In this work, we create a customer module in Python that will send calls to NAOqi to process audio data. It must contain a function that calls “SetClientPreferences” method. It specifies the format to acquire energy value from microphones, for example, specific sampling frequency, number of channels, and interleaved or deinterleaved format. The data will automatically and regularly be sent to the requesting module using one of its methods as a callback. 28 This function must be different to initialization function, otherwise it would not be sent to the requesting module.
For material classification, a signal sampling with four channels interleaved at a sampling rate of 48 kHz saved with 16 bits per sample was used. This configuration is one of the three configurations for audio acquisition established by Softbank Robotics. 28 In addition, the audio recorded is in raw data, and it does not include header information. Hence, it is easier to analyze than audio signal in WAV format because it does not require additional treatment before applying the signal treatment.
The “SetClientPreferences” method automatically calls a signal processing function which acquires the raw data. This function must be called “process” if the process is local or “processRemote” if the process is remote. In this case, the signal processing is remote because audio processing in real time takes a lot of computing resources, and if it were done locally, it can affect other demanding functions on the robot.
The advantages of processing sound remotely are that the user can optimize their sound processing algorithms with ease and that these algorithms can take more CPU load than on the robot. However, the transfer speed of the audio buffer is faster if it runs directly on NAO, 27 as we discussed in “Experimentation stage” section.
After the configuration is set, the program will start to call automatically and regularly the “processRemote” function once the subscription to the module has been made. This function will return raw data from microphones inputs. 28 To end, the process is necessary to unsubscribe the module.
Signal treatment
Once the signal acquisition is performed, we proceed to establish the spectral characteristics of the signal using FFT to compute the raw data to obtain the spectral characteristics of the signal. We use rfft from “numpy” Python library that returns one-dimensional discrete array for real input such as sound signal. The negative frequency terms are complex conjugates of the corresponding positive frequency terms; therefore, the former are redundant, and by ignoring them, it gains considerable speed boost. 29,30
The main information of sound waves is encoded in frequency domain, and after we obtain the spectral characteristics of the signal, we look for the frequency of the signal with the widest intensity to study. Figure 7 presents the process for acquisition and acoustic signal analysis in Python.

Data processing in Python.
To evaluate the performance of this analysis, we introduced acoustic signals with known frequencies to the system: 10, 4, and 1 kHz and observe the results. Python FFT scaled the values, as Figures 8 to 10 show.

Sinusoidal signal spectrum at 10 kHz with an amplitude of −15 dB. Python FFT experimental value. FFT: fast Fourier transform.

Sinusoidal signal spectrum at 4 kHz with an amplitude of −7 dB. Python FFT experimental value. FFT: fast Fourier transform.

Sinusoidal signal spectrum at 1 kHz with an amplitude of −16 dB. Python FFT experimental value. FFT: fast Fourier transform.
This prior performance evaluation was made to found error of results plotting, if any. It was found that fundamental frequencies were plotted in a value which is not corresponded to its original one. After a linear regression made with data of many tests, we were able to find a characteristic equation to correct errors in all frequencies.
A linear regression was done using the experimental data recorded, as shown in Figure 11. Using equation (3), we calculate the real frequency value, where x is Python FFT value.
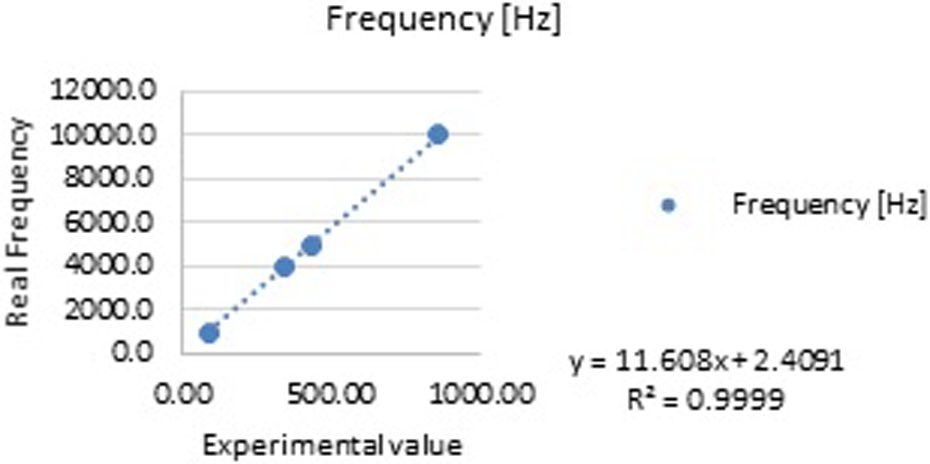
Experimental value (Python) versus real frequency.
In Table 1, we can appreciate the accuracy of the frequency values calculated by equation (3) of the 1-, 4-, 5-, and 10-kHz acoustic signals

Experimental values for linear regression.

FFT: fast Fourier transform.
For example, Figure 8 shows that the maximum amplitude experimental value is 862.283; using equation (3), we calculated the real frequency 10,012 Hz. The original frequency was 10,000 Hz. Thus, the error obtained is 0.1210%.
Experiments
For this experiment, the maximum frequency that can be sampled is 24 kHz according to our audio acquisition configuration and Nyquist–Shannon sampling theorem. 31 None of the frequencies register by the materials is over 10 kHz. The experiments consisted in five tests per object under the same conditions and duration of 10 s. All tests were made at the same environment and hit with the same tool.
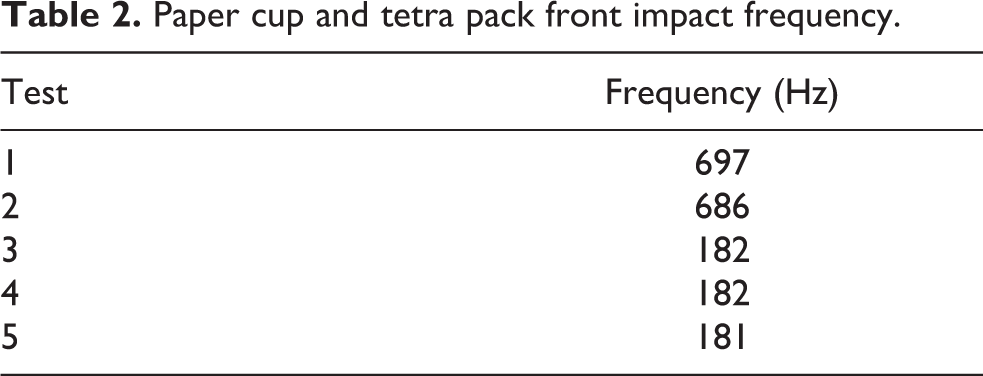
For paper cup, we made 10 tests: five front impact test. Results are shown in Table 2, where we can appreciate that these materials comprehend frequencies ranging from 181 Hz to 697 Hz. Also, for the same materials, five tests were made on the bottom, and results are shown in Table 3; its characteristic frequency ranges from 181 Hz to 914 Hz, similar to the front tests.
Paper cup and tetra pack front impact frequency.
Paper cup and tetra pack bottom impact frequency.

The frequency range for paper is 181–914 Hz. Although the cardboard frequency in most test is 181–183, some tests show frequencies around 914 Hz. This is because of the force applied in each hit. Also, the exact point where the object is hit affects the sound produce because the shape and quantity of material it is not the same in each part of the object, for example, the bottom part of a tetra pack box has more layers of cardboard.
For glass, we made five tests by hitting a bottle on its front side, and results are shown in Table 4.
Glass frequency.

The frequency range for glass is 3184–4255 Hz. The sound differs from middle height of the bottle to the bottle neck; because of this, we see some variation in the signals recorded.
For plastic, we made five tests by hitting a bottle on its front side. The results are shown in Table 5.
Plastic frequency.

The frequency range for plastic is 221–238 Hz.
For aluminum, we made five tests by hitting a can on its front side. The results are shown in Table 6.
Aluminum frequency.

The frequency range for aluminum is 1186–3715 Hz. The force applied on the impact and the place where it is hit affects the signal recorded, because the can has different thickness and shape on its surface, and sound reflects different for each surface. 32 It is not the same signal produced by hitting the bottom can and its side surface.
These patterns will be used to recognize the category to which the object belongs.
Results
All tests were performed under the same condition and have a duration of 10 s. The same procedure described in “Experiment design” section was applied for each object. After the tests, we set frequency ranges for each material. The frequency range is shown in Table 7.
Frequency ranges for material classification.
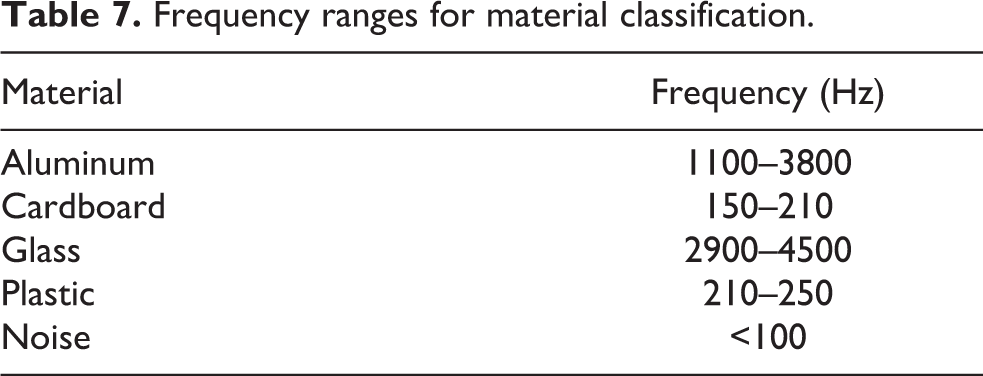
The procedure generates some frequency variations, for example the force applied in each hit or the exact point where the object is hit; these actions affect the sound produced because the shape and quantity of material it is not the same for of the object. As a result of this, frequency ranges were established for each material to reduce the error in the classification.
Experimentation stage
The methodology presented here was tested and compared with a conventional artificial vision method. The stage was the first NAO Challenge México 2016 tournament in Mexico City. The event took place at Tecnológico de Monterrey Campus Ciudad de México. There were five challenges: “¡Play with me!,” “Movie Time,” “¡NAO Boogie!,” “Cardboard, Metal or Plastic,” and “NAO entrepreneur.”
The robot participated in “Cardboard, Metal or Plastic” challenge on which objective, according to the organizing committee, was to form an environmental awareness through a challenge that dynamically encourage waste classification for recycling. 32
This challenge consisted of two phases: material identification and material classification. In the former, the NAO robot had to say which object it was looking at between a cardboard box, a metal can, or a plastic bottle. These objects were assigned specific features such as a color and a NAOMark to facilitate their identification as shown in Table 8.
Cardboard, metal, or plastic.

Material classification consisted in the robot disposing the object by taking it to the classification area with its same features, as shown in Figure 12. Both material identification and material classification had to be done within a time span of 3 min.
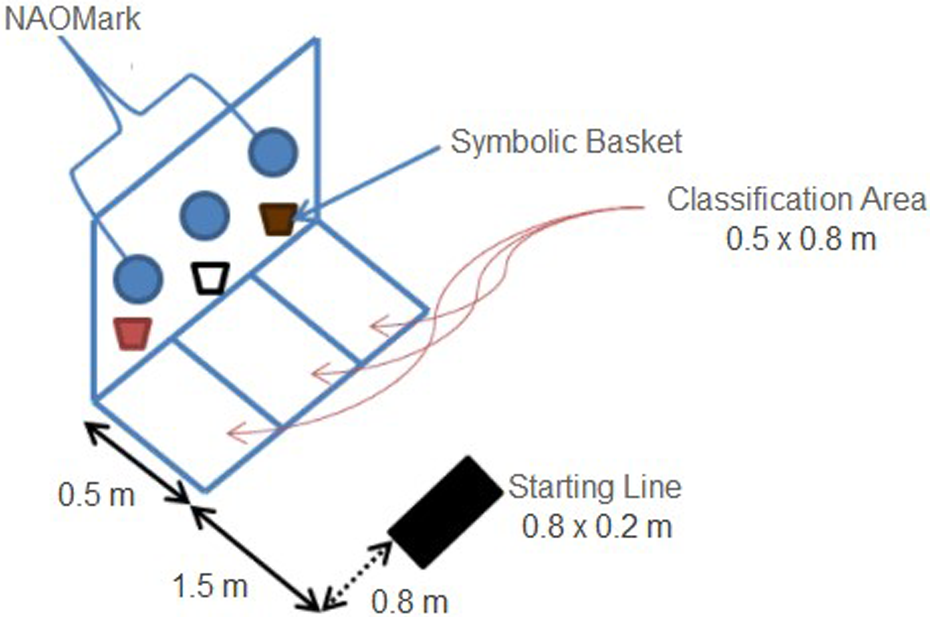
“Cardboard, metal, or plastic” challenge stage. 33
For this tournament, the method was adapted to identify certain audio signal emitted by a buzzer on each object and not by hitting each object as before. This change was made because the objects used for experimentation were damaged after many tests, and also, buzzers allow us a faster and more accurate procedure than hitting it manually. The robot can successfully recognize specific audio signals such as an emitted signal by a buzzer or by hitting the object. In addition, the audio recognition process was local.
The classification of materials by acoustic signal processing method completed the identification phase in less than 1 s. It was faster than vision methods as contour recognition and NAOMark detection, 33 becoming the fastest identification method of the challenge. The robot starts the disposal routine after the object has been identified, in this case, after analyzing its acoustic properties to determine its material composition. The challenge ends when NAO crosses the line of one of the classification areas or when the time span has ended.
The main advantage using audio processing against artificial vision during NAO CHALLENGE was the noise tolerance. Using artificial vision requires to calibrate the method according to room illumination, and one of the most common problems at the challenge was that some robots did not recognize the object once the robot was placed at the stage. Unlike other methods, this identification method did not required calibration on the stage because the robot recorded the strongest signal near it; therefore, the stage noise did not affect the audio processing. Figure 13 shows the stage for NAO Challenge México 2016 in the gymnasium at Tecnológico de Monterrey.
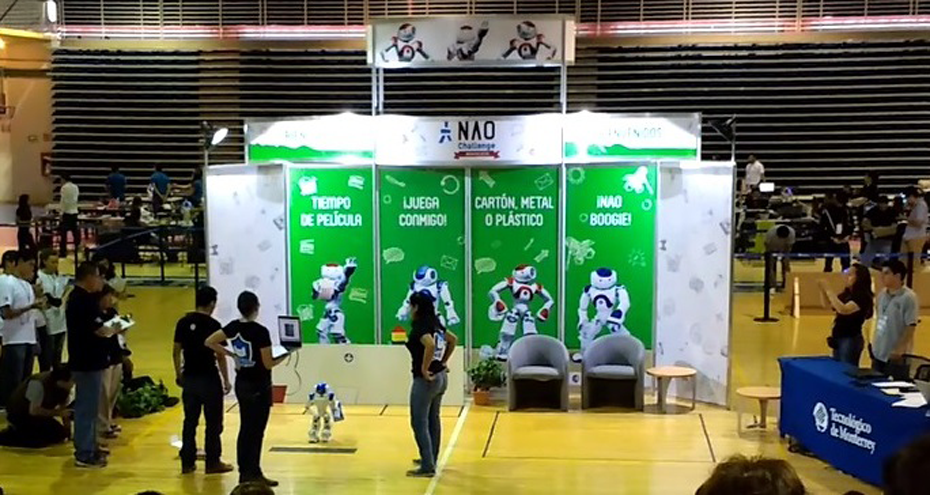
“Cardboard, metal, or plastic” challenge at NAO Challenge México2016.
Discussion of the results
We conducted a number of experiments with NAO by collecting a data set of five tests for each material, as previously mentioned. Although the robot could successfully classify these materials, limitations were found such that noise tolerance depends on the proximity of NAO’s microphone to the sound source; if this would be produced far, it would be difficult to identify it with noise in the environment. Filters then would be recommended for a better quality of the signal.
For instance, during the classification of materials in NAO CHALLENGE, the noise and echoes in the gymnasium didn’t affect the materials identification because the sound source was near the microphones (see Figure 3 to see where microphones are located).
In the tournament, we preferred to use one-channel configuration because using the four of them would add more noise to the data. The selected microphone was the rear right. As a result of this, the identification was successfully made in 84 ms being the fastest of all the 14 teams who participated in the category.
Conclusion
In conclusion, acoustic signals are rich in content and contribute to information directly from the physical properties of objects. Audio processing requires fewer processing and storage resources than image or video processing, it is also faster and cheaper, hence it becomes useful for different applications. 14
For this purpose, object recognition by an audio processing method is focused to perceive specific material properties that cannot be perceived by traditional methods.
The robot can successfully classify cardboard, aluminum, and plastic. A robotic platform as an NAO robot is not suitable to perform classification of some materials due to their similar frequency ranges such as glass and aluminum or compounded materials, for example, Tetra Pack, which is equally identified as paper, so exploring other approaches is needed.
NAO Challenge México 2016 became a great stage to test the classification of materials by acoustic signal processing method against noise, also proving to have better performance than image-based (robotic vision) method, for the same purpose.
As future work, we plan to apply this method to elementary schools for waste separation lessons. There are a number of potential applications of categorization complementing diverse processing methods (image-based, auditory, etc.). In the future, reliable categorization in real time will take place in surveillance, driver assistance, autonomous robots, interactive games as well as interaction with objects, virtual reality, and telecommunications. Other potential applications include systems for cognitive personal assistance such as user support in complex environments and basic support for elderly or disabled people making domestic tasks and activities of daily life that would be increasingly challenging and easier for them. 3,34
As the approach presented in this article works remotely, meaning that there is no need to go where the robot is to start the classification, we can think of even more potential applications that will reduce the need for the user to move as most robots will be remotely controlled using a computer or other device. 34
Footnotes
Declaration of conflicting interests
The author(s) declared no potential conflicts of interest with respect to the research, authorship, and/or publication of this article.
Funding
The author(s) received no financial support for the research, authorship, and/or publication of this article.