
Abstract
Iris recognition is proving to be one of the most reliable biometric authentication systems. Since biometric authentication systems store multiple templates per user, there is need to optimize their computational and storage complexities by creating a single reliable specimen iris template per user. In this article, we propose two majority vote-based strategies for the creation of a single iris template per user. An algorithm based on cumulative-sums grey change analysis is used to extract the iris texture features for template creation. The experimental results on the CASIA and UBIRIS iris databases show that the approach is effective and efficient, with a recognition rate of 99.6%.
Introduction
The recent advances of information technology and the increasing requirement for security have led to a rapid development of intelligent personal identification systems based on biometrics. Biometrics employs physiological or behavioural characteristics to accurately identify an individual. 1–3 Biometric systems are being developed based on various features, such as fingerprint, facial image, voice, hand geometry, handwriting, iris and retina. Among them, the iris has proved to be one of the most stable, reliable and accurate biometric traits because it is formed during gestation and the structures of its patterns are invariant. Its texture is very distinctive and does not correlate with genetic determination. Iris is well protected by aqueous humour, and it is almost impossible to modify it surgically without risk. 3–6 Furthermore, the highest density of biometric degrees of freedom, which are both stable and distinctive, is found in the iris texture patterns. 7,8
An efficient algorithm that detects the largest non-occluded rectangular part of the iris as region of interest (ROI) is investigated. Thereafter, a cumulative-sums-based grey change analysis algorithm is applied to the ROI to extract features for recognition. This method can be utilized for iris recognition based on part of the iris since it relaxes the requirement of using the whole iris to compute an iris template.
Most of the biometric authentication systems store multiple templates per user to account for variations in biometric data. Therefore, these systems suffer from storage space and computational overheads especially when searching for multiple templates of the same individual and comparing them with the candidate to be authenticated. In order to address these issues, two novel majority vote–based algorithms are proposed, which calculate a string prototype iris features code as the reliable specimen template.
The rest of the article is structured as follows. ‘Related work’ section explores the state-of-the-art of iris recognition, ‘Iris recognition system’ section describes an overall iris recognition system, ‘Experimental results and discussions’ section presents experimental results and the last section draws the conclusions and future work.
Related work
The idea of iris identification traces back to the Paris prison in the 18th century, where police discriminated criminals by inspecting their irises colour. 5 The fundamental algorithm for iris recognition systems was developed by Bachoo and Tapamo 9 and Daugman, 10 the two-dimensional (2-D) Gabor wavelet approach, which extracts discriminating information.
Wildes 11 used an isotropic bandpass decomposition derived from application of Laplacian of Gaussian filters to the iris image data. Like Daugman, Wildes also used the first derivative of image intensity to find the location of edges corresponding to the borders of the iris. The Wildes system explicitly models the upper and lower eyelids with parabolic arcs whereas Daugman excludes the upper and the lower portions of the image. These two techniques explicitly model the eyelids only without taking into account other forms of iris occlusion from elements like eyelashes. Hence, the results of these system could be improved by detecting explicitly the actual iris part of the eye without any form of occlusion.
Ma et al. 1,12 proposed two methods for iris personal identification; iris recognition based on multichannel Gabor filtering 12 and iris recognition using circular symmetric filters. 1 The multichannel Gabor filtering extracts both local and global iris features, and the iris matching is based on the weighted Euclidean distance. The circular symmetric filters extract local textural features only, and the iris matching is based on an approach called the nearest feature line. These methods of Ma et al. 1,12 extract local features in a relatively bigger local region of 8 × 8 block, which does not represent precisely the variation of the iris texture in the region. Therefore, alternative approaches that extract local features from non-occluded ROI, which represent the precise iris texture, should be investigated.
Boles and Boashsh 13 proposed an approach based on zero crossings of the one-dimensional (1-D) wavelet transform at various resolution levels. Firstly, they localized and normalized the iris using edge detection algorithms. The zero crossings of the wavelet transform are then calculated at various resolution levels over concentric circles on the iris. The resulting 1-D signals are then compared with the model features using different dissimilarity functions. Their results discussion suggests that this system can handle noisy conditions as well as variations in illumination but could not be optimized by the use of a less-noisy ROI, non-occluded iris. Furthermore, Dargham et al. 14 used thresholding to detect iris from pupil and the surroundings. The detected iris is then reconstructed into a rectangular format. Self-organizing map networks are then used for recognizing the iris patterns. The accuracy obtained by the network is around 83%. This accuracy rate could be improved by detecting the largest non-occluded rectangular part of the iris as an ROI from which iris features are extracted. A new class of a triplet 2-D biorthogonal wavelet basis was proposed for iris feature extraction. 15 The design is based on the generalized half-band polynomial and a class of the triplet half-band filter bank. The proposed method provides low computational complexity which makes it feasible for online applications. Hollingsworth et al. 16 proposed a metric called the fragile bit distance, which quantitatively measures the coincidence of the fragile bit patterns in two iris codes. Szewczyk et al. 17 focused on the analysis of the noisy iris data. A fusion approach to unconstrained iris recognition has been proposed. 18
Other recent approaches to iris pattern recognition include the independent component analysis approach by Huang, 5 the texture analysis using multichannel Gabor filtering and wavelet transform by Zhu et al., 19 the self-organizing neural network approach by Lim et al. 20 and the use of a partial iris for recognition using 1-D approach by Du et al. 21 These methods calculate the enrolment iris template by averaging various iris signatures for each iris pattern. Can majority vote techniques compute a more precise enrolment iris template than averaging various iris signatures?
Each of the above methods has its own advantages and disadvantages. Moreover, biometrics technology still presents room for improvement. In this article, a new iris recognition approach is proposed that uses the largest area axis-parallel rectangle 3 to extract the part of the iris which is not occluded by the eyelashes, skin, pupil and sclera and that calculates the iris specimen template for enrolment using two majority vote–based strategies.
Iris recognition system
An iris recognition system is made of two subsystems: the iris enrolment subsystem, which enrols the iris in the database, and the iris identification/authentication subsystem, which compares a newly input iris with the known irides in the database and decides if it is in the database. The iris recognition system architecture is depicted in Figure 1.

Iris recognition system.
The basic modules for an iris recognition system, including iris localization, normalization, feature extraction, template creation and matching, are presented in the following subsections.
Iris localization
The iris is an annular part between the pupil and the sclera. Both the pupil and the sclera of a typical iris can approximately be taken as circles. However, the two circles are usually not concentric. The inner and outer boundaries of the iris are precisely localized using the following method
1
: Project the image in the vertical and horizontal direction to approximately estimate the centre coordinates (xp, yp) of the pupil. Since the pupil is generally darker than its surroundings, the coordinates corresponding to the minima of the two projection profiles are considered as the centre coordinates of the pupil. Binarize a region cantered at the point (xp, yp) by adaptively selecting a reasonable threshold using the grey-level histogram of this region. The centroid of the resulting binary region is considered as a more accurate estimate of the pupil coordinates. Calculate the exact (xp0, yp0) centre and rp radius of the pupil and the exact
Figure 2 shows the localized iris zone.

Segmented iris part.
Iris normalization
Daugman solved the normalization problem by projecting the original iris in a Cartesian coordinate system into a doubly dimensionless pseudopolar coordinate system. 10 The iris in the new coordinate system can be represented in a fixed parameter interval. This method normalizes irises of different sizes to the same size by unwrapping anticlockwise the iris ring to a rectangular block with a fixed size. The dimensionless polar system assigns an r and θ value to each coordinate in the iris that will remain invariant to the possible stretching and skewing of the image.
For the transformation, a pair of real coordinates (ρ, θ) where the ρ value ranges in (0, 1) and the angular value θ spans the interval (0, 2π). The remapping of the iris image I(x, y) from raw Cartesian coordinates (x, y) to the dimensionless non-concentric polar coordinate system (ρ, θ) can be represented as 23
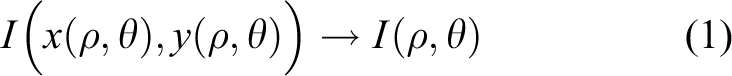
which is implemented according to the following formulae
where

and

The centre of the pupil is denoted by
Feature extraction
Region of interest
The ROI is the largest region of the image that contains the iris pattern without noise. The detection of the ROI is based on an extension of Droogenbroeck’s algorithm 24 applied on binary images. This algorithm extracts the ROI by scanning the binarized and normalized image horizontally and vertically to determine the length and the width of the region, respectively. The noise here is considered to be the skin, pupil, eyelids or sclera. Figure 3 shows accurate ROIs detected from six different images using this algorithm. The algorithm is sequenced as follows:
1. The normalized image Imn with m rows and n columns is defined as

where (i, j) is the position of the pixel (i, j, xij) and xij its grey level. Imn is binarized by transforming each xij into Bij for

where τ is the threshold calculated as follows

where σ and μ denote the standard deviation and mean of the original normalized image, Imn, respectively; k1 and k2 are real numbers chosen between 0 and 2, depending on the resolution quality.
25
In our case, an optimum binarization is achieved when k1 = 0.25 and k2 = 0.25. The resulting binary image is Bmn. 2. An algorithm based on 4-connectivity is applied to find the connected components of Bmn as classes of related pixels resulting in Cmn which is defined as

where 3. The foreground component of the image, Cmn
is scanned horizontally from right to left resulting in matrix HOR, filled with the distance of each pixel contained in a foreground component to the right border of that foreground component. 4. VER is the matrix whose elements are calculated by comparing the values in the columns of HOR, that is, VER[i, j] is the length of the vertical segment of HOR in column j and within the successive neighbourhood of i that has all its value greater or equal to HOR[i, j]. 5. HOR[i, j], VER[i, j], is the pair of elements representing the segments of an axis-parallel rectangle Rij
, defined as

where HOR[i, j] and VER[i, j] denote the length and width of Rij, respectively. The rectangle Rij with the maximum area is the largest area axis-parallel rectangle LRij, defined as

6. LRi,j denotes the largest area axis-parallel rectangle with top left coordinates (i-c, j) and bottom right coordinates (i + VER[i, j] − (c+1), j + HOR[i, j] − 1), where c is the total number of neighbouring rows to row i in column j where HOR[i, j] ≤ HOR[k, j], when k = [i−1, i−2,…,0].

Detected regions of interest (the largest area axis-parallel rectangular ROI without occlusions). ROI: region of interest.
Feature extraction using cumulative sums
A cumulative-sums-based analysis method
26
is used to extract features from the rectangular ROI. The contrast of the extracted ROI is improved by a histogram stretching method, which results in a well-distributed image. The different sized regions of interest shown in Figure 3 are resized by averaging pixel values to N(row) × M(col) pixels size. The extraction of features is sequenced as follows
26
: Divide the normalized iris image into basic cell regions for calculating cumulative sums. For instance, one cell region has 3(row) × 10(col) pixels size (N = 3 and M = 10). An average or median grey value is used as a representative value of a basic cell region. Basic cell regions are grouped horizontally and vertically as described in the study by Ko et al.
26
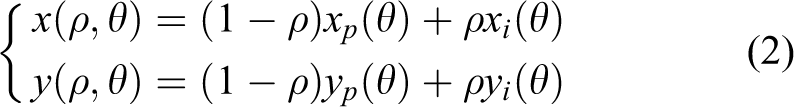
Empirical experiments are conducted to determine the optimum way of grouping the cells. In our case, three cells are grouped horizontally, and five cells are grouped vertically. Calculate cumulative sums over each group as defined in equations (11) and (12). Generate iris feature codes as shown in Figure 4.
Example of the iris code generation. (a) Darkness to brightness. (b) Brightness to darkness. 26
The cumulative sums in step 3 are computed following a sequence of steps. Suppose that

where

where Si is the cumulative sum over each group with a constraint S0 = 0.
Feature coding
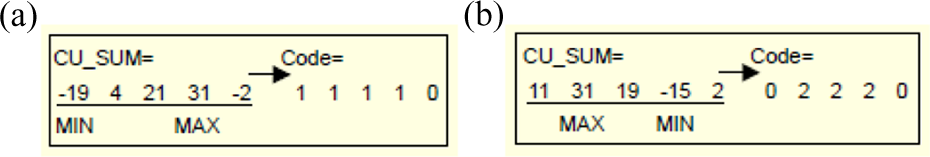
The iris codes are generated horizontally and vertically for each cell region by analysing the cumulative sums (equation (12)), which describe the variations in the grey values of iris patterns. Algorithm 1 shows how the iris codes are generated vertically. An upward slope of cumulative sums (Figure 4(a)) means that the iris pattern changes from darkness to brightness, while a downward slope (Figure 4(b)) means the opposite. Figure 4 shows the examples of iris codes generated. For instance, in Figure 4(b), the cumulative-sums values change from maximum to minimum, which means that the variations in the grey values of iris patterns change from brightness to darkness. Therefore, the cumulative-sums values within the interval of the positions of the minimum and maximum, [pos(MIN), pos(MAX)], are coded 2, and all other values outside the interval are coded 0.
This cumulative-sums-based feature extraction method is efficient in terms of computational complexity, since the cumulative sums are calculated by addition.
Iris code generation – vertically
Template creation
After extracting iris features from various instances of the same iris taken in different contexts such as light intensity and distance, a prototype code or a representative iris feature code is calculated using the majority vote strategy. The extracted features are in the string format. An example of these iris features extracted in the string format is shown in Figure 5.

Example of the extracted iris feature codes in the string format.
Let S = {0, 1, 2} represents the gradient direction of the grey level, that is, 1 is upward slope, 2 is downward slope, as shown in Figure 4(a) and (b), respectively, and 0 is no slope. Each iris instance is represented by a string feature code

such that for all

Let

or

where equation (15) computes the majority vote and adopts no variations in the grey values of iris patterns as code 0, (0 ∈ S), when there is no majority vote, and equation (16) computes the majority vote and adopts undefined variations in the grey values of iris patterns as symbol # when there is no majority vote.
The function ψ that calculates the prototype code of the iris is defined as
such that
where

Example of the iris prototype code of an individual (with code 0 when there is no majority vote).

Example of the iris prototype code of an individual (with undefined code
Iris matching
To verify the similarity of two iris codes, Hamming distance (HD) based on the matching algorithm 10,26 is used. The smaller the HD, the higher the similarity of the compared iris codes.

only when

where Ah(i) and Av(i) denote the enrolled iris code over horizontal and vertical directions, respectively; Bh(i) and Bv(i) denote the new input iris code over the horizontal and vertical directions, respectively. N is the total number of cells, and ⊕ is the XOR operator.
Experimental results and discussions
The experiments were carried out using eye images obtained from the CASIA iris database 27 with data from 108 people. Seven iris images of the same individual were obtained from a set of 108 individuals. Further experiments were also carried out using the noisy visible wavelength iris image databases (UBIRIS). 28 Firstly, the ROI detection algorithm, which extracts the largest possible axis-parallel rectangular iris region from the images tested, was applied to all seven irides of the 108 individuals. Figure 3 shows how the algorithm detects accurately the ROI from six different iris images. The ROI with more than 80% of the valid iris patterns hidden mainly by eyelids and eyelashes is rejected.
Secondly, the cumulative-sums technique is used to extract iris features from the detected ROI which is not occluded by obstacles like eyelashes, skin, pupil or sclera. Thus, non-iris pattern areas are completely discarded. On the other hand, the cumulative-sums algorithm is used to extract iris features from the whole iris image without excluding any occlusions from eyelashes, skin, pupil or sclera. Figure 8 shows the genuine acceptance rate (GAR) versus the false acceptance rate (FAR) of Iris recognition using cumulative sums applied on non-occluded ROI and applied on ROI with occlusions. The curve shows that the cumulative-sums algorithm performs better when applied to non-occluded iris regions of interest than when applied to ROI with occlusions. The variations in the grey values of iris patterns are well defined in non-occluded ROI; hence, the cumulative-sums technique achieved a high recognition performance rate of 98.4%. Therefore, cumulative-sums algorithm obtained an improved accuracy rate when performed on a non-occluded ROI.
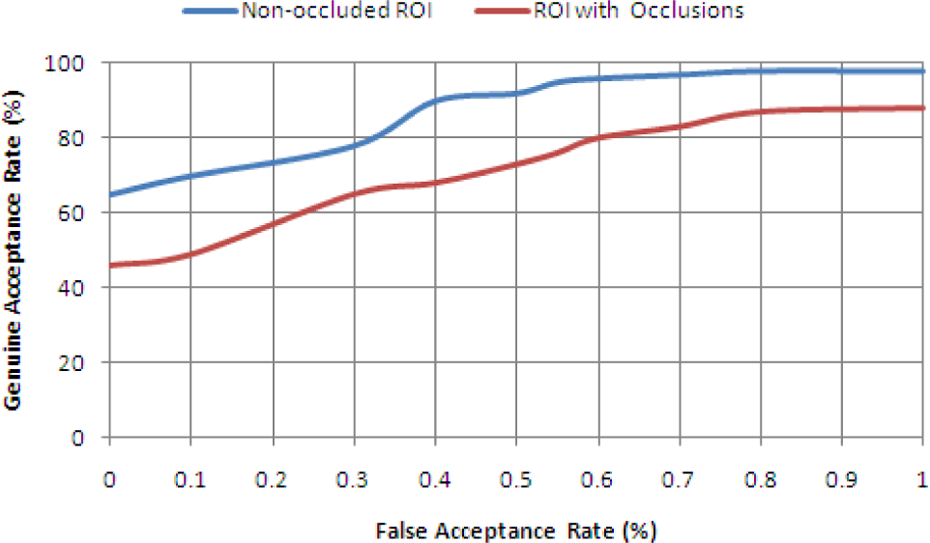
ROC curves: cumulative sums applied on non-occluded ROI versus cumulative sums applied on ROI with occlusions. ROI: region of interest; ROC: Receiver Operating Characteristic.
Thirdly, the two majority vote–based strategies for creating the specimen iris templates, defined in ‘Template creation’ section, are used to create two prototype feature codes per individual. The first template is computed by applying the majority vote–based technique which uses non-variation in the grey values of iris patterns, when there is no majority vote, as defined in equation (15). The second prototype feature code is computed by applying the majority vote–based technique which adopts an undefined variation in the grey values of iris patterns, when there is no majority vote, as defined in equation (16). The latter majority vote–based technique slightly outperformed the first technique, as shown in Figure 9. This figure shows the GAR versus the FAR curves, of the cumulative sums applied on the ROI with occlusions, using the majority vote algorithm which adopts no variation in case of no majority vote and an undefined variation in case of no majority vote. Furthermore, Figures 10 and 11 show that a prototype feature code calculated from five instances of the same iris of an individual, using the two different databases CASIA and UBIRIS, respectively, has an optimum true positive rate of ≈99.6%. Therefore, the performance rate of an iris recognition system based on the cumulative sums has improved to 99.6% when the specimen iris template is created using the majority vote–based technique which adopts an undefined variation in the grey values of iris patterns, when there is no majority vote. Further comparisons of the cumulative-sums-based change analysis approach, with the results of other iris feature extraction techniques in the literature, are shown in Table 1. The cumulative sums achieved a recognition rate of 99.6% when it is implemented on the non-occluded ROI. The non-occluded iris ROI has proved that it can bolster the recognition rate of iris-based systems.

ROC curves: majority vote algorithm (adopts no variation in case of no majority vote) versus majority vote algorithm (adopts an undefined variation in case of no majority vote) cumulative sums applied on ROI with occlusions. ROI: region of interest.

True positive rate of 25 people with a specimen template with 1 instance, 3 instances and 5 instances each iris (CASIA; with an undefined variation).

True positive rate of 25 people with a specimen template with 1 instance, 3 instances and 5 instances each iris (UBIRIS); with an undefined variation).
Comparative table of recognition rates.

Lastly, the results obtained using the two data sets (CASIA and UBIRIS) are almost identical, and the detection rate of the non-occluded ROI is ≈100% in both data sets. This ratifies the authenticity of our investigative approach that the proposed approaches could be implemented on any iris bench mark data set.
Conclusion
We have presented two efficient approaches based on majority vote to create a single specimen iris template for an individual. The first majority vote–based technique implements non-variation in the grey values of iris patterns, when there is no majority vote, while the second technique uses an undefined variation in the grey values of iris patterns, when there is no majority vote. The proposed majority vote–based strategies obtained a success rate of 99.60%, which is an improvement compared to the system based on multiple iris templates. Further investigation of the effect of the proposed techniques with other different biometric modalities is envisioned.
Footnotes
Acknowledgement
Portions of the research in this article use the CASIA iris image database collected by the Institute of Automation of the Chinese Academy of Sciences and UBIRIS noisy visible wavelength iris image database collected by the Soft Computing and Image Analysis Group, Department of Computer Science, University of Beira Interior, Covilhã Portugal.
Declaration of conflicting interests
The author(s) declared no potential conflicts of interest with respect to the research, authorship, and/or publication of this article.
Funding
The author(s) received no financial support for the research, authorship, and/or publication of this article.