
Abstract
The article deals with the design of embedded vision equipment of industrial robots for inline diagnosis of product error during manipulation process. The vision equipment can be attached to the end effector of robots or manipulators, and it provides an image snapshot of part surface before grasp, searches for error during manipulation, and separates products with error from the next operation of manufacturing. The new approach is a methodology based on machine teaching for the automated identification, localization, and diagnosis of systematic errors in products of high-volume production. To achieve this, we used two main data mining algorithms: clustering for accumulation of similar errors and classification methods for the prediction of any new error to proposed class. The presented methodology consists of three separate processing levels: image acquisition for fail parameterization, data clustering for categorizing errors to separate classes, and new pattern prediction with a proposed class model. We choose main representatives of clustering algorithms, for example, K-mean from quantization of vectors, fast library for approximate nearest neighbor from hierarchical clustering, and density-based spatial clustering of applications with noise from algorithm based on the density of the data. For machine learning, we selected six major algorithms of classification: support vector machines, normal Bayesian classifier, K-nearest neighbor, gradient boosted trees, random trees, and neural networks. The selected algorithms were compared for speed and reliability and tested on two platforms: desktop-based computer system and embedded system based on System on Chip (SoC) with vision equipment.
Introduction to smart vision and embedded systems in manufacturing
Industrial machine vision systems are usually implemented in automation systems in mass production of automatized lines with manipulators or industrial robots for inspection, identification, diagnosis, measurement, counting, and product tracking. Current trends in product quality inspection are smart vision systems. Smart vision systems are embedded systems with image acquisition, image processing, automated decision of product quality, and digital output for the next processing. They replace human verification in many different production areas. 1 The main problem of commercial smart vision system is that these devices are not open source with preprogrammed graphical function. Implementation of new algorithms is not possible, and standard vision libraries don’t provide support for machine learning algorithms. Current computing power of embedded systems increases several times a year. This progress gives opportunity to use embedded system for vision tasks including implementation of clustering and classification algorithms. Embedded systems have native database support suitable for storing data obtained from clustering algorithm. The main idea of the article is to study the methodology of implementation of two main data mining algorithms: clustering and classification and their usability for diagnosis of similar error in mass production. We provide experiments with simple and advanced algorithms from both groups. The introduced methodology was verified on metal parts with polyurethane color with simulated defects, for example, scratches, peeled paint, and thin coat. The first chapter deals with the description of available and used clustering and classification methods. The main chapter describes in detail the proposed methodology for automated error look up and description of used embedded hardware and vision library. The last chapter compares mainly the performance of all algorithms on ARM-based embedded system with standard ×86 desktop computers.
Overview of machine learning algorithms (clustering and classification)
In machine vision field specialized for diagnosis of similar errors in continuous mass production, we cannot create clusters by clustering algorithm for any new part. The clustering algorithms are processor intensive, with an increasing amount of data. The presented methodology uses the combination of the two methods, namely, clustering and classification. Clustering creates automatically a basic set of similar errors to classes as input for teaching. Classification creates model of class distribution after teaching. Second part of classification predicts new error competence to existing class. Teaching and clustering can be realized in background, for example, on second core of processor and update model with new errors. Prediction based on the actual class model is very fast and can real-time categorize errors to existing classes.
Algorithms for clustering
We select three major algorithms from each field of unsupervised clustering: Fast library for approximate nearest neighbors (FLANN) (hierarchical algorithm), K-means (statistical method), and density-based spatial clustering of applications with noise (DBSCAN) (density-based method). For the selection of a suitable method, we compare performance and reliability of the basic and advanced algorithms. It is supposed that clustering algorithms provide finer distribution of errors to classes like manually fixed supervised conditional setup of parameters.
K-means (K-means clustering) is one of the simplest unsupervised learning algorithms. The main idea of this procedure is to classify data acquired from image processing to a finite number of clusters (K clusters). The algorithm principle is to define optimal K centroids, one for each cluster. Simplified procedure is to create an initial group of K centroids into the space and assign each object to the group that is closest to the centroid. When all objects have been assigned, the positions of the K centroids have to be recalculated. Repeat until the centroids no longer move. The algorithm aims at minimizing an objective function, that is, a sum of squared errors according to equation (1)

where xi (j) is the data point and cj are the cluster centroids.
The naive implementation of the algorithm is significantly sensitive to the initial randomly selected cluster of centroid, and there is no general theoretical solution to find the optimal number of clusters for any given data set. 1 in the update step, the new means to be the centroids of the observations in the new clusters are calculated, according to equation (2)

Since the arithmetic mean is a least squares estimator, this also minimizes the within-cluster sum of squares, and some research about the usability of K-means was published in the literature. 2,3
Hierarchical cluster analysis is a clustering method that builds hierarchy trees (forest). Hierarchical clustering is divided into two groups: agglomerative and divisive approach. Simplified agglomerative description of algorithm is that every point in the space has its own cluster, to find the “most similar” pair of clusters and merge it into a parent cluster, and to repeat the last step until you have merged the whole data set into one cluster. We use the nearest neighbor initialization FLANN instead of basic hierarchical clustering modified version. FLANN is a library that contains a collection of algorithms optimized for fast nearest neighbor search in large data sets and for high-dimensional features. Hierarchy merges and splits are determined by greedy algorithm. The results are usually presented in a dendrogram. Agglomerative clustering is preferred to large data set, because complexity of algorithm is O(n)2 in comparison to O(2)n for division approach. FLANN uses only Euclidean metric according to equation (3)

where a and b are coordinates of two clusters. Detailed descriptions about the usability of these algorithms were described in the papers by Flynt and Dean 4 and Pi et al. 5
DBSCAN is suitable especially for nonlinear distributed clusters. We need not specify the fixed number of clusters before we start the clustering process with specific data set. DBSCAN in comparison with other algorithms need only two parameters. It is necessary to define only minimum cluster size and the maximal distance of points. This algorithm also knows to isolate noise elements from created classes. The work by Kumar and Reddy 6 deals with a detailed description on this algorithm. The other improved versions of DBSCAN are GDBSCAN, OPTICS, and HDBSCAN. Principles of clustering algorithm are shown in Figure 1.
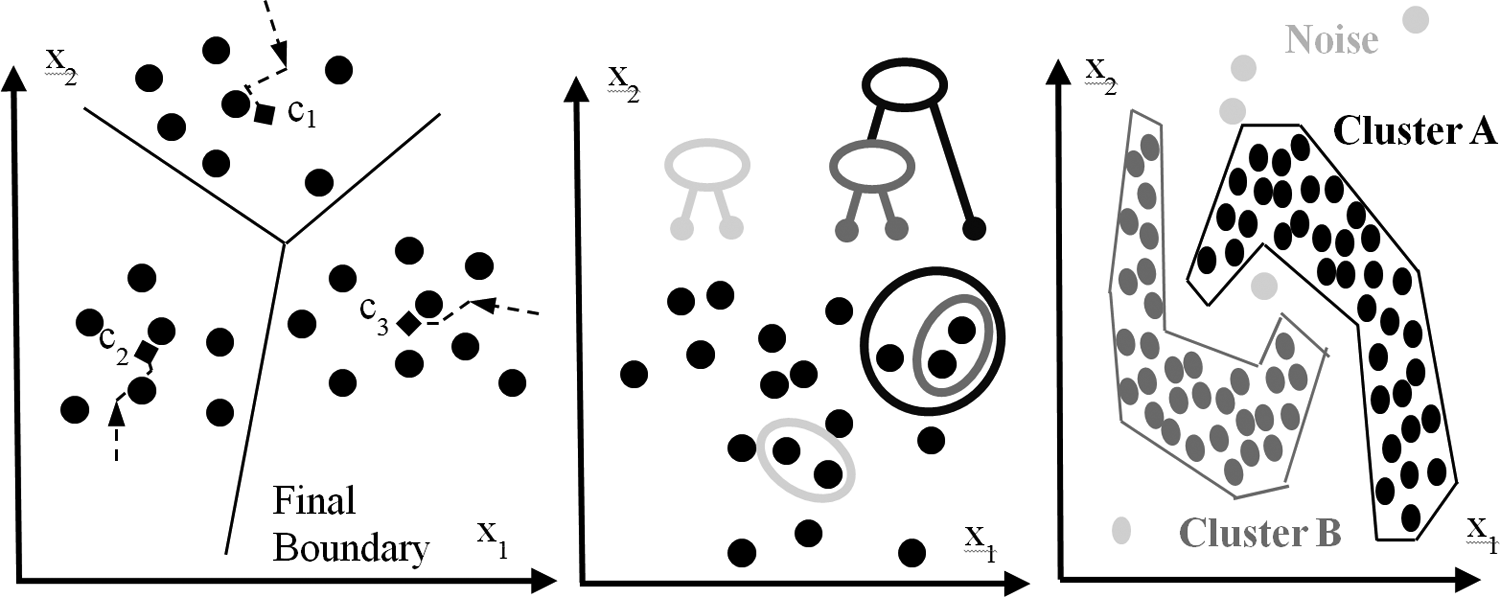
Principle of K-means vector, FLANN hierarchical, DBSCAN density clustering. FLANN: fast library for approximate nearest neighbors; DBSCAN: density-based spatial clustering of applications with noise.
Algorithms for classification
We selected six major methods/algorithms from all fields of classification: statistical, neural networks (NNs), trees of decision, linear algorithms, etc. This chapter describes briefly all selected algorithms, their usability, and comparison.
Support vector machine (SVM) is the oldest method for clustering data set. The idea is to find the optimal boundary for dividing data into clusters. Ideal boundary for two clusters is shown in Figure 2(a). Equation (4) simply describes this boundary line that creates equal space between outer element

Support vector machines for two classes and K-nearest neighbors.

where b and m are designate constants (parameters). This method can be improved from line to polynomial element, which is suitable for specific cluster distribution. This improvement is known as soft-margin SVM and introduces nonnegative slack variables ξi, which measure the degree of misclassification of the data xi according to equation (5)

The objective function is then increased by a function that penalizes nonzero ξi; if the penalty function is linear, the optimization problem occurs. The SVM algorithm implementation in industrial process area is described in the work of Bhat et al., 7 and other usabilities are described in the study by Kremic and Subasi. 8
K-nearest neighbors (KNN) is a simple algorithm that is mainly controlled by K parameter, which defines the number of neighbor elements to compute weight. For a high-dimensional data set, the improved algorithm was designed as, for example, approximate nearest neighbor (ANN) and locality-sensitive hashing. Performance of the method can be significantly improved by supervised learning (NCA, LMNN). 9,10 Figure 2(b) shows the principle of a simple KNN algorithm.
Naive Bayes classifier (NBC) is based on the statistical theory of probability Gaussian element distribution. Training uses the estimated means vector with the covariance matrix. 9 The major feature is very low number of collected teaching data to estimate the basic parameters. Basic theorem is the conditional probability, and it can be decomposed as equation (6)
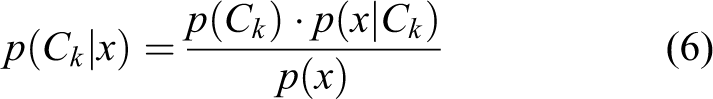
where p(x/Ck ), p(Ck), and p(xk ) are calculated using the training data. When dealing with continuous data, a typical assumption is that the continuous values associated with each class are distributed according to a Gaussian distribution. Improved version of normal Bayes classifier with multivariable normal distribution was published in literature. 11,12
Random trees (RT) is based on randomly created structures “forests or trees” of training data by “bootstrap” algorithm. We can then evaluate these structures and select the best of them. 13,14
Gradient boosted trees (GBT) is an improved algorithm by Jerome Friedman, which implements feature for differential loss. This optimization is provided by “greedy” algorithm. This optimization provides better precisions but higher computational load. 15
NN is the most used methods from computational intelligence for data classification. Basic parameters are number of neurons for input, output, and hidden layers. The main disadvantage is the high demands for the amount of memory in learning process if we choose a large number of neurons in a hidden layer (Figure 3). 16

Setup of input and output parameters in neural network for error classification.
Basic methodology description for error clustering/classification/prediction
Presented methodology has to provide information to interrupt production if similar errors reach previously defined pieces amount or errors in products increased in very small time interval. Acquired information can be used for prediction of production equipment maintenance, before reaching a critical or dangerous operating condition. The algorithm for data clustering is performance demanding and cannot be executed in very small interval on a desktop computer nor on an embedded system. The clustering is usable only in combination with classification and prediction. The classification algorithm with training data creates a model for prediction. The classification model can classify and then predict any new error to existing class almost in real time.
We define three levels of methodology to continuously detect similar errors during manipulation process by industrial robots: To acquire and process image (thresholding, detection of contour, parameterization) To categorize the detected defects under similar error groups with clustering methods, create data set for teaching process, and store the database To generate YAML model by classification algorithm and test reliability by prediction function.
Image acquisition with other low-level image processing methods (thresholding, contour detection) to detect element parameterization of error is explained in detail in the study by Židek and Rigasová. 17
Figure 4 explains the theory of classification data, storing model, and prediction of any new defect caused during the production process.

Flowchart algorithm of errors recognition, clustering, and training.
The classification (teaching/prediction) methodology is the same for all tested classification algorithms, and a simplified flowchart is shown in Figure 5.

Flowchart principle of error teaching and prediction.
The three-level methods of error diagnostics can be simply shown as a timing diagram. Whole algorithm of error diagnostics is shown as a delay diagram (Figure 6).
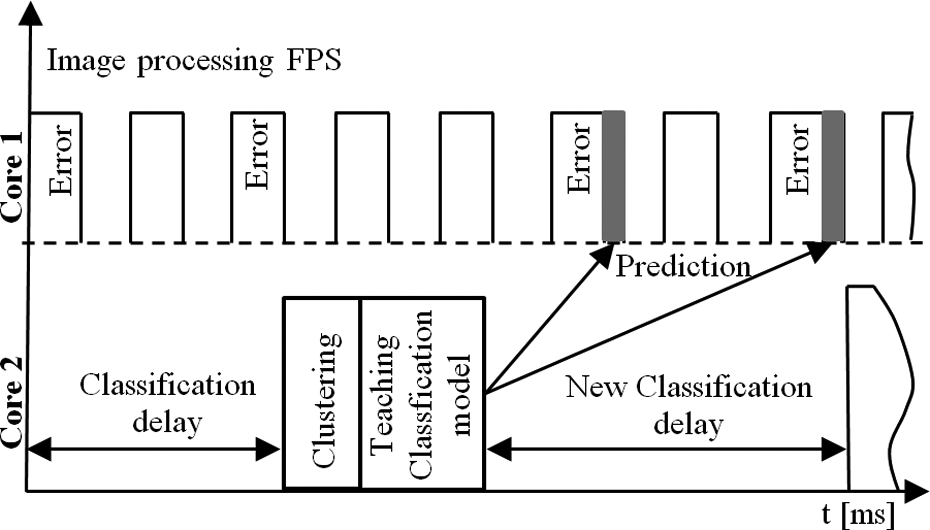
Timing diagram for product error diagnostics.
We can divide the whole automated process into multicore processors because the basic image processing can be independent of machine learning process. We can create groups of dependent parameters and divide them into separate layers as shown in Figure 7. We define the three basic groups using this methodology: positions, dimensions, and orientation. Extended group can be defined as volume, circuit, and shape or majority of color defects. Similar defects can be successfully clustered in a small variation range. Algorithms can track increasing or decreasing defect size or quantity and predict the critical status in the production process.

Extraction of parameters to partially dependent layers.
Industrial robot and vision equipment
The connection of vision equipment to the industrial robot is shown in Figure 8 (left). Vision equipment can be placed near the robot gripper and grab image before grasping of the product. Figure 8 (right) shows tested embedded platforms and final robot equipment with a cover made by rapid prototyping. 18
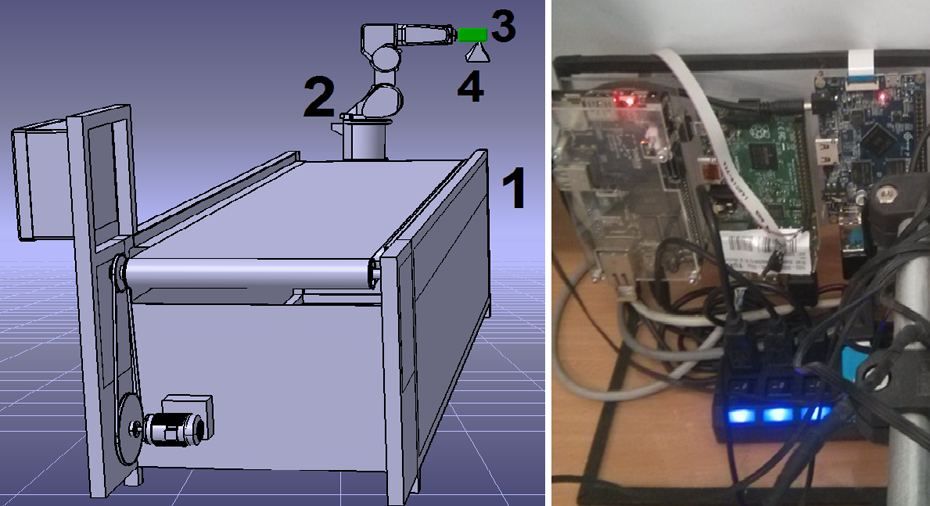
Industrial robot with embedded vision equipment.
The complex methodology of systematic error detection was implemented in several embedded boards with SoC ARM architecture: Raspberry PI, Raspberry PI 2 (OS Raspberrian), Cubieboard (ARM Arch Linux OS), and Orange PI (Armbian OS) with web camera and Camera Serial Interface (CSI) vision equipment. We compare these systems with standard desktop computers with Intel processor ×64 architecture: Virtual KVM CPU (Ubuntu OS), Xeon ×64 (Cent OS) with Firewire vision equipment. A scheme of the embedded vision device based on Raspberry PI board is shown in Figure 9.
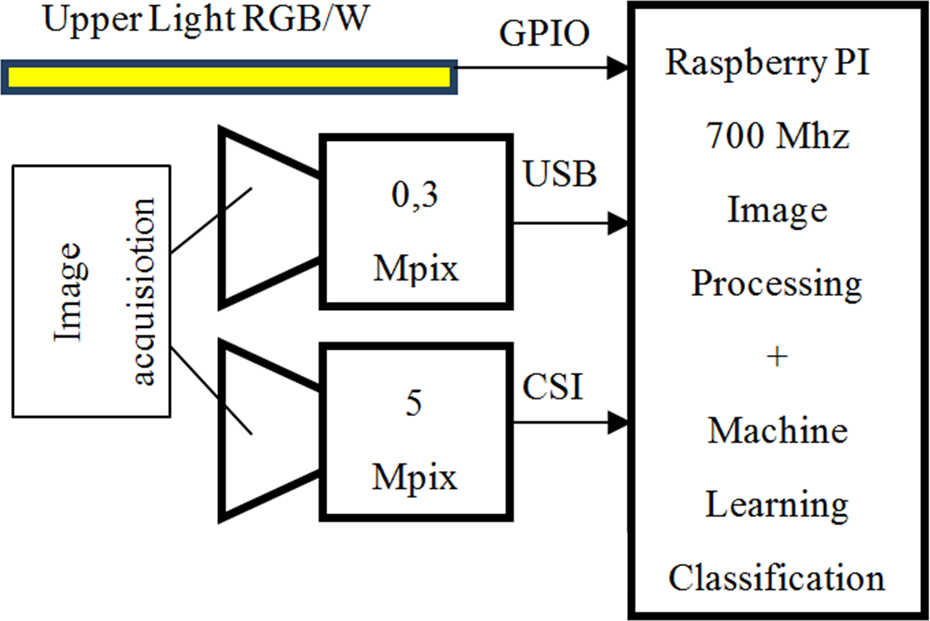
Block scheme of embedded vision system with Raspberry PI.
The CPU in the embedded boards show lower performance as the standard desktop computers. We need to select a high-performance library. The best solution was OpenCV framework, because it has many advantages: coded in fast C++ language, open source for commercial project, and it is very popular in vision developer’s community. The main advantage is C++ implementation for some clustering methods and many classification algorithms from machine teaching. Acceleration of image processing algorithms on ARM processors is under intensive development with the help of Compute Unified Device Architecture (CUDA) and Open Computing Language (OpenCL) libraries. Next step will be parallelization of dual, quad, and octal processor with OpenMP library. The designed software uses two layers: low-level image processing and clustering/classification algorithms are processed in C++, upper level is web interface to set up parameters and result visualization that uses web technology of HTML5/AJAX with PHP. Software is optimized for Linux OS distribution. Web interface provides simple remote connection from any computer on network and via OpenVPN from Internet. A sample web page of the graphical interface embedded system is shown in Figure 10.
Web interface for graphical representation of error detection and parametrization.
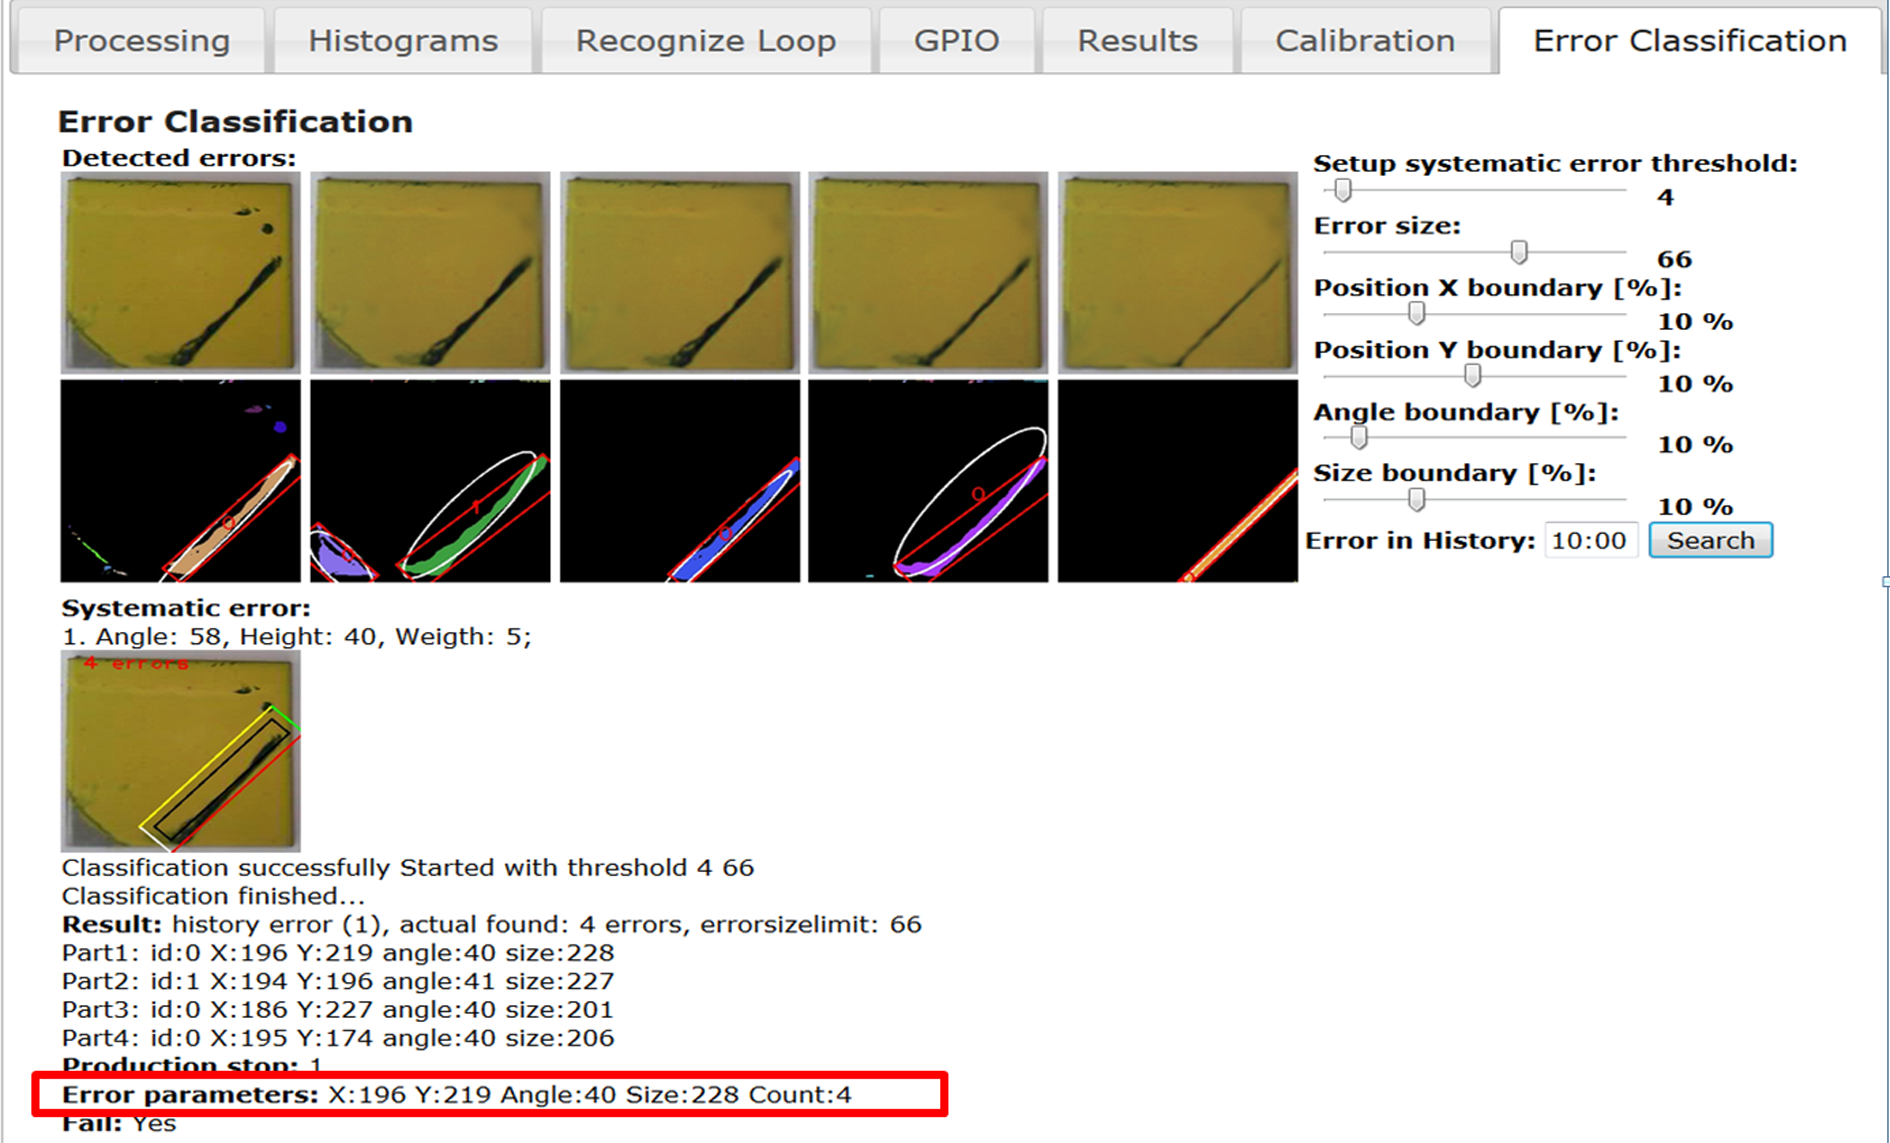
All parameterized error data must be available for three processes at the same time: clustering process, teaching process, and prediction. This problem is solved by simplified SQL database interface SQLite3. Any parameterized data are stored using this technology and can be accessed simultaneously. Web interface for clustering and advanced classification is shown in Figure 11. The classification model is stored in the device as YAML file format, and for larger data set, it can be generated remotely.

Web interface for setup parameters of classification (teaching/prediction) algorithm.
Experiments with different clustering and classification algorithms
The parameterization of defect was tested on square metal sheets of 35 × 35 mm with yellow polyurethane color. Recognized errors were divided into four clusters: A to D. These groups contain a bad basic material overlap, circle defects, peeled color paint, etc. These defects can be created during bad manipulation before successful color drying. Some examples of these defects are shown in Figure 12.

Paint-coated patterns with similar errors.
We assume that the classified errors have two dimensions (e.g. size width and height [w, h]), position on the product [x, y], and its orientation as angle in 2D plane. All five parameters are stored in data string separated by comma as shown in Figure 13.

Sample error parameters, training data set example.
Graphical representation of the tested example for clustering (position parameters of error [x, y]) is shown in Figure 14. Result of clustering for all three algorithms is shown in Figure 15.
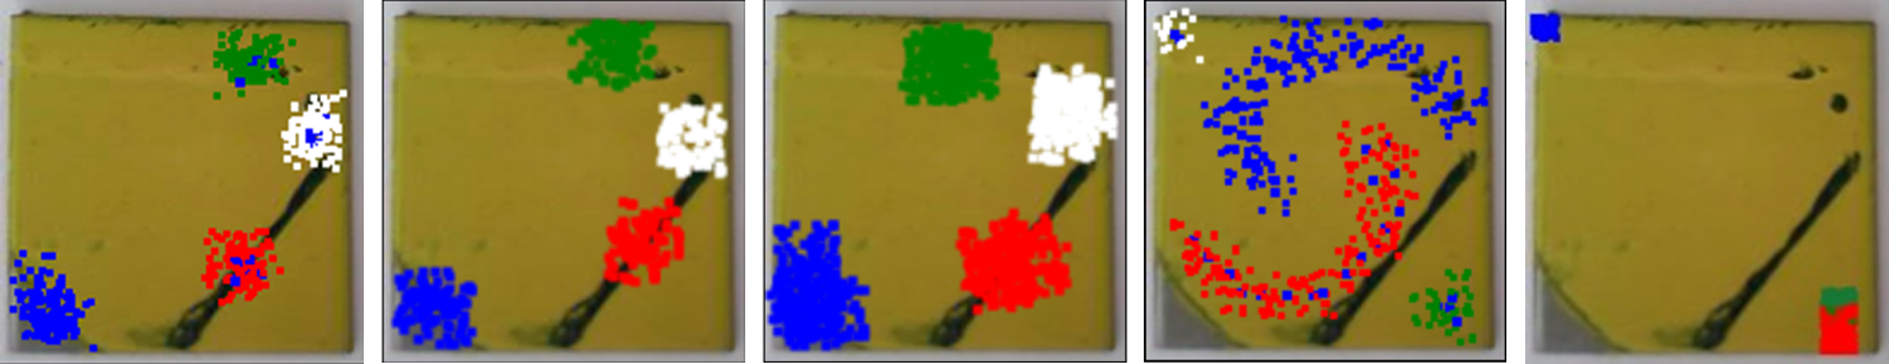
Sample input for clustering: 140, 400, 1000 samples, specific error distribution, two classes in the same position.

Cluster of points: (a) raw data set, (b) K-means, (c) FLANN, (d) DBSCAN performance comparison of used data clustering methods is shown in Table 1. FLANN: fast library for approximate nearest neighbors; DBSCAN: density-based spatial clustering of applications with noise.
The used FLANN algorithm doesn’t provide information about the radius of the cluster but provides only the centroid point with the same size of radius for all groups. The tests were measured on embedded system Raspberry PI B+ with CSI camera. Performance comparison of used data clustering methods is shown in Table 1.
Performance comparison of clustering algorithms on different platforms.

FLANN: fast library for approximate nearest neighbors; DBSCAN: density-based spatial clustering of applications with noise.
The graph in Figure 16 represents clustering algorithm complexity for small and large data sets. DBSCAN algorithm doesn’t need initial definition of cluster count; but for very large data set, it is unusable because of computational complexity. For specific error distribution K-means, FLANN fails, but DBSCAN solves all specific distribution reliably. DBSCAN algorithm is unusable when two classes are in the same spatial position because it is implemented only for two dimensions.
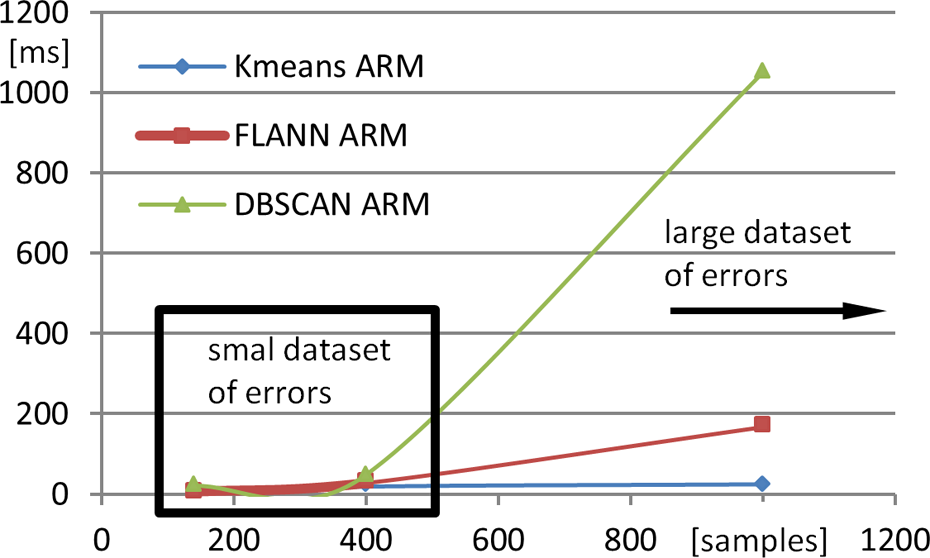
Clustering algorithm complexity comparison (Raspberry PI ARM).
We must check clustering repeatedly for the next set of three or five parameters [h, w, a] or [h, w, a, O, S] after position clustering. Graphical representation of error parameters can be realized by a radar diagram (Figure 17).

Graphical representation of error parameters by a radar diagram.
This second level of clustering can find subgroup of errors with the same position but with different parameters and remove random error from class (noise). Separated group can be indexed as A0, A1, A2, … An. We divide the basic set of data to two classes: first set are training data and we use 80% from 1000 samples, and the second set are used for prediction and evaluation of teaching precision. The performance and reliability measurement of machine learning classification methods is shown in Table 2.
Comparison of machine learning classification methods.

The result of classification for tested data set is that algorithms that are trees based (GBT) are very reliable, with almost 100% reliability for teaching and 96% for prediction. The artificial NNs have high reliability, but their speed of teaching and prediction is not suitable for embedded systems. 19 The fastest learning was achieved by KNN with adequate precision in the next prediction. In continuous production process, the learning is not time critical, but prediction delay is very important for fluent production. This condition satisfies two algorithms: KNN and RT. A particular result from classification was published in Židek et al. 20 Graphical comparison of classification algorithms is shown in Figure 18. ANN algorithm requires more memory that could provide a built-in system for learning. Teaching was done on ×86 computer and transferred to embedded system.

Teaching and prediction comparison of classification methods.
Tested NNs use 5 input neurons (error parameters), 100 neurons on two hidden layers, and 26 neurons on output layers (groups of similar errors). Parameters were set as MSE 0.001, maximum iteration to 300, sigmoid activation function, and backpropagation learning algorithm.
Measured reliability of clustering and classification methods for 1000 samples is shown in Figure 19 (left), and the reliability in percentage (y axis) for specific error distribution is shown in Figure 19 (right).

Teaching and prediction reliability comparison for 1000 samples and specific distribution.
Conclusions
The article describes the design of vision equipment of industrial robots for inline error detection based on machine learning and clustering algorithms. Introduced methodology implemented in software solution recognizes surface defects in compact autonomous embedded system and produces database classes for similar errors. The basic task of vision system is image parameterization. The experiments were conducted with major methods of clustering, for example, DBSCAN, FLANN, and K-Means. The result of clustering experiments according to error distribution was that hierarchical algorithm FLANN or K-means is suitable for simple error distribution, because it was accordingly fast for small and big classes. DBSCAN (density-based clustering) is a suitable solution for specific class distribution, but the only disadvantage is significantly increased delay for large data sets. The second set of experiments was the comparison of the main classification methods: SVM, GBT, RT, NBC, KNN, and NN. The most CPU performance and memory were consumed by NN teaching algorithm with a reliability of approximately 98% and the best teaching time was acquired by KNN algorithms with similar precision of approximately 98%. The results are not directly dependent on the number of tested samples but on the distribution in user space. This decision was verified on three sets of 140, 400, 1000 samples. In real-time solutions, it is the most suitable to use RT and KNN. These algorithms reach lowest delay in both section (prediction and classification) and high precision. All parameterized error data were stored in SQL database and are ready for the next statistical analysis, for example, of production efficiency. Further development suppose implementation of next advanced machine learning algorithms. The designed embedded vision system can be adapted from industrial robot to mobile robot, because it can be battery powered and has small dimensions. 21 Proposed methodology for similar error searching can be used for any other error distribution, but the performance and reliability of used machine clustering and teaching algorithm can change in some interval.
Footnotes
Acknowledgments
The research work was supported by the Project of the Structural Funds of the EU, entitled “Research and development of intelligent nonconventional actuators based on artificial muscles,” ITMS code 26220220103, also it is supported by Grant VEGA 1/0822/16 “Research of intelligent manipulator based on pneumatic artificial muscles with three degrees of freedom” and research project No. KEGA 048TUKE-4/2014.
Declaration of conflicting interests
The author(s) declared no potential conflicts of interest with respect to the research, authorship, and/or publication of this article.
Funding
The author(s) received no financial support for the research, authorship, and/or publication of this article.