
Abstract
The article deals with the issue of the impact of parasitic dynamics caused by vibroisolation on the performance of the positioning system in low- and high-frequency regions. Based on the simplified structure of the positioning system and passive vibroisolation system with one degree of freedom, a new structure of the positioning system is created taking into account the impact of vibroisolation system. By utilizing this structure of the positioning system based on the simulation, the impact of the ratio of the weight of the actuator to the frame weight and the damping factor on the performance of the positing system in low- and high-frequency regions is demonstrated.
Introduction
For the mechatronic systems is specific that they may contain modules that are responsible for carrying out mechanical movement with precise positioning under different environmental conditions (e.g. temperature in the range of 300–400°C), the terms of the user (e.g. use of portable product during physical activities or driving) and manufacturing tolerances. From the point of view of positioning accuracy and performance, an important role is played by interaction of dynamics of mechanical part with the positioning system. The economic success of manufacturers of such positioning modules is determined by several factors, which mainly include positioning speed and positioning accuracy. Positioning module designers are so constantly confronted with the growing demands for higher operating speeds and greater positioning accuracy. In designing these positioning systems, it is necessary to consider the negative impact of dynamics of the mechanical subsystem on the performance of the positioning system, as the following phenomena may manifest negatively: The mechanical resonance may affect the stability of the positioning system thus limiting its properties, vibrations of the mechanical system, which are caused by actuated value, can cause a deterioration of quality.
The most important mechanical symptoms listed above can be caused by actuator compliance, limited mass and stiffness of the frame of mechatronic system.
This article deals with the issue of vibration of the mechanical system caused by actuated value, which are due to limited mass and stiffness of the frame of mechatronic system. In contrast to many textbooks of mechanics and machine dynamics and also the practice in the positioning systems is not always reflected the current action of the driving force acting on the movable part of the actuator and its reaction acting on the frame of the positioning system. However, in general, the frame of the positioning system has neither an infinite mass nor is it connected to the surroundings by infinite stiffness. Therefore, the frame of the positioning system will be characterized by vibrations that are excited by the force of the reaction, and as a result, the performance is seriously affected. In this article, we expect the final weight of the frame of the positioning system and also the final stiffness by which the frame is attached to the surroundings. The final stiffness is represented by passive vibroisolation device. 1 –4
Inclusion of vibroisolation device into the regulation structure of the positioning servomechanism
In order to study the effect of vibroisolation on the performance, the vibroisolation system must be included into the positioning servosystem. In the block diagram of Figure 1, the force FA (t) generated in the direct current (DC) motor affects the moving part of the DC motor whose stator is fixed to the frame. As a result, the reaction force FA (t) labelled FR (t) affects the frame plus all parts connected to the frame. Reaction of force FR (t) thus affects the vibroisolation device and forms in terms of control a part of the positioning servomechanism that clogs up the positioning system with parasite dynamics. Let us define the initial transfer function of the mechanical part of the DC motor, namely not considering the vibroisolation system as G 1(s).
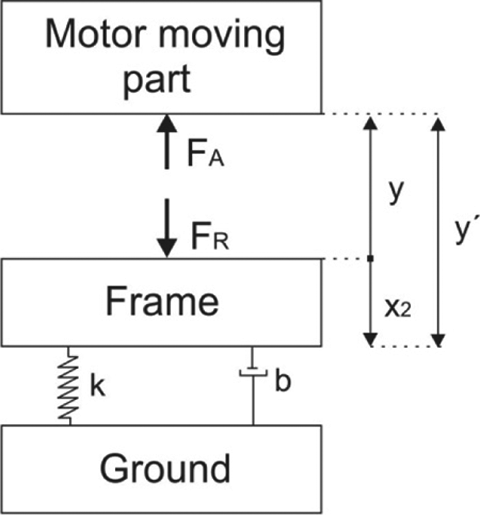
Representation of mechanical part of DC motor in the model of active vibroisolation system. DC: direct current.
If we consider also the effect of the reaction force FR (t), then it will be necessary to correct the process variable y(t) by the amount of displacement of the frame x 2(t).
The corrected process variable Y*(t) we can formally express by relationship

which we further develop to form

wherein G 2(s) = X 2/FR (s) is the transfer function reflecting the effect of vibroisolation device on the transmission of the mechanical part of the DC motor. If the forces FA and FR have a disagreeing orientation, we can express the transfer function G 2(s) also as G 2(s) = X 2(s)/F A(s). Equation (2) then takes the form

and consequently the transfer function of the mechanical part of the DC motor is

The transfer function G 2(s) for the case of passive vibroisolation system has the form

The block diagram of the positioning servomechanism taking into account the effect of the vibroisolation device is shown in Figure 2.

The scheme of positioning servomechanism taking into account the impact of vibroisolation device.
Determination of the transfer function representing the parasite dynamics
As shown in Figure 2, vibroisolation system in terms of control together with the mechanical part of DC motor forms a parallel structure. The reduction of this parallel structure gives the following transfer function
where

For reasons of further analysis, the last transfer function will be factorized as follows

where

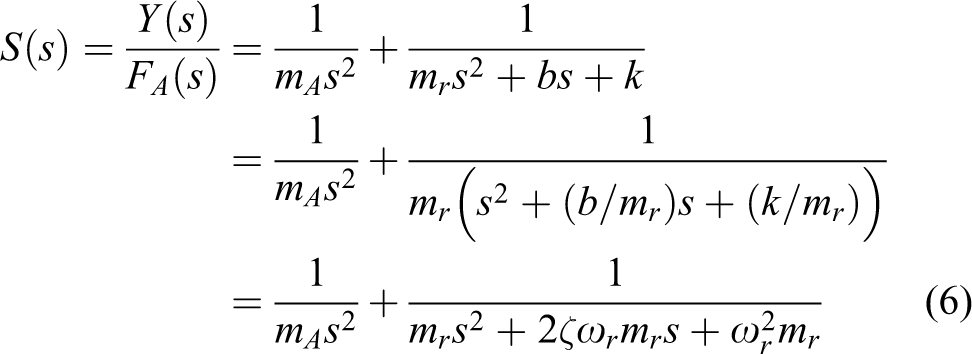
is the ideal transfer function of the positioning servomechanism and Ss (s) is the part representing the sprung mass of the frame which is given by relationship

Function Ss (s) represents the effect of the parasitic dynamics of vibroisolation system. The last transfer function S(s) for a change forms the series structure of transfer functions of the mechanical part of DC motor and the transfer function taking into account the effect of vibroisolation system. We will adjust the transfer function representing the effect of vibroisolation system Ss (s) (parasitic dynamics) to a standard form

where
Between the anti-resonance and the resonance angular frequency, the following relationship is valid

The transfer function Ss (s) representing the parasite dynamics thus can be expressed also in the form

In terms of the dynamic properties, the transfer function Ss (s) represents a system with a phase lead. Asymptote inclination of amplitude frequency response changes at angular frequency ω = ωa and ω = ωr . The precise course of the Bode diagram depends on the damping factor ζ.
Figure 3 shows the Bode diagram of the transfer function Ss (s) for three different values of damping factor ζ.

The Bode diagram of transfer function S(s) representing the effect of vibroisolation system.
We can notice that the lower is the value of damping factor ζ in the narrower frequency band where the phase lead occurs and its value is greater. Even in case of magnitude diagrams is noticeable the effect of the damping factor ζ only in a certain area of angular frequency ωr . Outside of this ‘limited’ area, the effect of damping factor is negligible. In the magnitude diagram part is reflected only the effect of variable α, which acts in relationship of an additional gain which is given by limit:
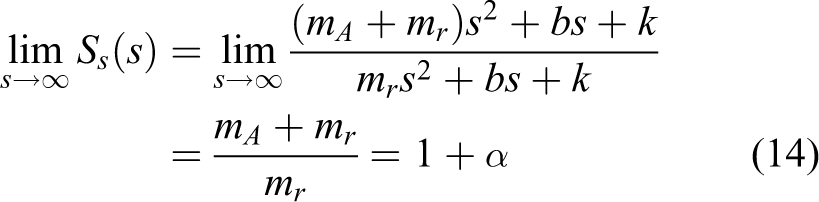
Table 1 shows the upper and lower frequency bands relative to ωr in the units of decade where the influence of the damping factor ζ with an error of more than 1% both for the magnitude and the phase diagrams is reflected. The damping factor was considered in the range ζ (0.02–0.7). Angular frequencies ωhA and ωdA are related to the magnitude part of the Bode diagram and angular frequencies ωhF and ωdF to the phase part. The relationship of these angular frequencies ωr in graphical form is shown in Figure 4. From Table 1, it results that the upper frequency band of phase characteristics has the largest bandwidth for phase α = 1, the width of which is almost 2.2 decades. The lower frequency band of phase characteristics in turn has the smallest bandwidth, and for α = 1, it represents 0.75 decade. Both bands of magnitude diagram are almost identical and their value is approximately one decade.

The impact of the dynamics of vibroisolation system on mechanical part of DC motor for the damping factor for ζ = 0.02 (a) and for ζ = 0.7 (b). DC: direct current.
The values for the upper and lower frequency bands relative to ω r in the units of decade where the influence of the damping factor ζ is reflected.

From what has been said so far, it is clear that the dynamics of vibroisolation system can influence the mechanical part of the DC motor through the damping factor ζ, and also through the influence of additional gain 1 + α. The impact of damping factor is reflected only in a limited frequency band whose width for specific value α is given in Table 1. The impact of additional gain manifests itself always as far α > 0 and at frequencies greater than the resonant frequency ωr . The situation is graphically shown in Figure 4(a) (for ζ = 0.02) and (b) (for ζ = 0.7) where Si is the transfer function of DC motor and S(s) = Si (s). SS (s) is the transfer function of DC motor with consideration of the impact of vibroisolation system. Over the angular frequency ωr and after the effect of the damping factor ζ, the magnitude part of the Bode diagram of transfer function S(s) is shifted by the value of additional gain 1 + α with respect to the transfer function Si (s). The phase parts of the Bode diagram of the aftermath of the impact of damping factor are almost identical. That is, if the resonant frequency of the vibroisolation system ωr is in a sufficient distance from the frequency band responsible for the dynamic properties of the positing system, then the impact of the damping factor ζ on these properties is minimal.
Demonstration of impacts of the value α of damping factor ζ on the performance of the positioning system
In the parasitic transfer function given by the relationship (13) there occur three parameters ωr , α and ζ, which together have an impact on the performance of the positioning system. With respect to the fact that the analytical expression of representative parameters of performance such as functions ωr , α and ζ is impossible (the characteristic equation is of the fifth degree), these dependences were investigated by simulation. As controller is used, the correction member with phase lead whose transfer function is in the form

This correction member has the largest gain max|G(jω)| = K in the high-frequency region. The largest phase lead
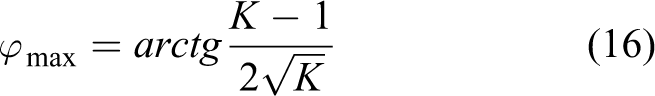
occurs at an angular frequency
The phase lead increases with value K, but is always less than 90°.
In order to investigate the influence of value α and the damping factor ζ on the performance of the positioning system, the frequency region was divided into three areas: low-frequency region, intermediate-frequency region and high-frequency region. As a criterion for this division serve the breakpoints of the Bode diagram of open idealized positioning system (Figure 5). The breakpoints ω 1 and ω 2 are determined by zero and the pole of the transfer function of the controller.
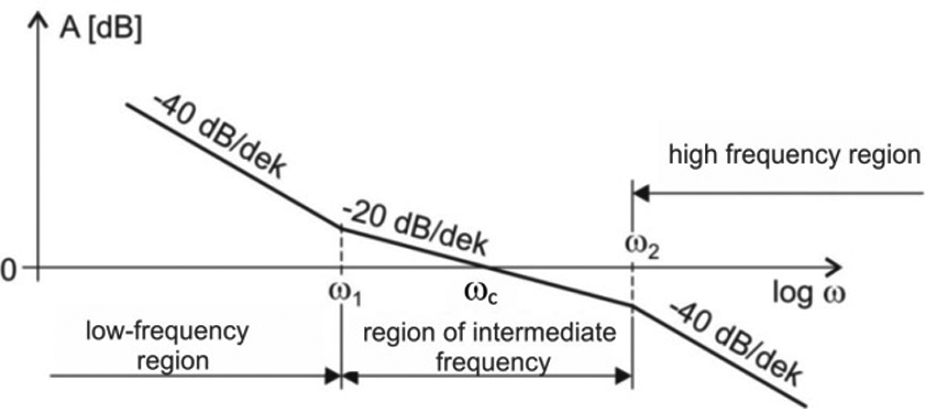
Division of frequency region into three parts.
When designing the controller, we will come out of the presumption that the specification for the positioning system is given by crossover frequency ω = ωc and by phase margin ϕ = ϕ*. To obtain the phase margin, the controller must ensure the phase lead

It is also necessary to set the amplification of the controller so that the magnitude of the frequency response of the open positioning system in ωc will be equal to the unit.
We chose the following indicators of performance: phase margin ϕ, maximum overshoot σ max. In this article, we carried out simulations in order to obtain dependences of phase margin and maximum overshoot on value α and damping factor ζ. These indicators of performance were examined for different values of ωr .
Low-frequency region
In Figure 6 are shown dependences of phase margin for three different angular frequencies ωr , that is, ωr = 0.1 rad/s (Figure 6(a)), ωr = 0.4 rad/s (Figure 6(b)) and ωr = 3.9 rad/s (Figure 6(c)).
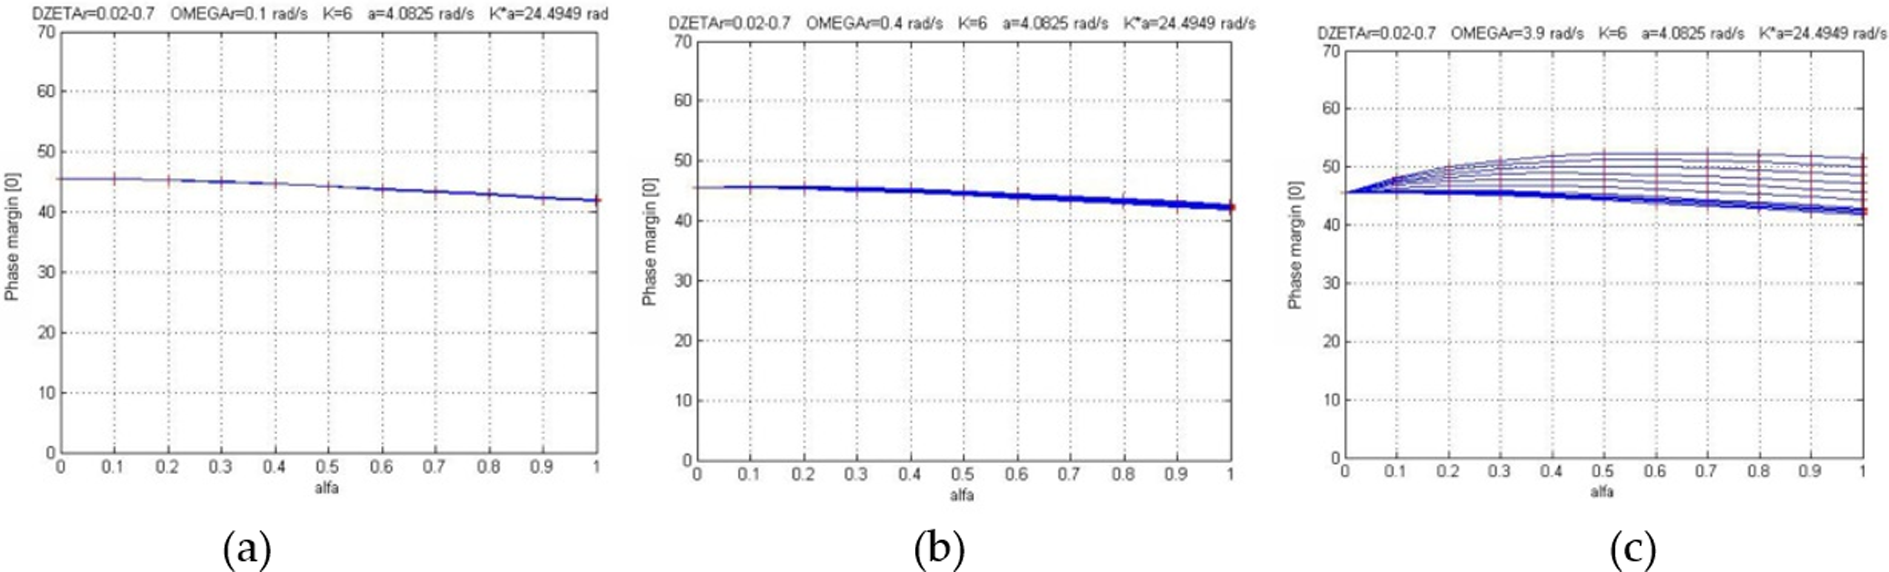
Dependence of security in phase on value α for three different frequencies ωr .
From the assessment of these dependences it results that at frequency ωr = 0.1 rad/s, the phase margin decreases with increasing value α and is almost independent of the damping factor ζ. It is quite understandable because the parasite dynamics has very little effect on phase diagram in medium-frequency region which therefore remains unchanged. Due to increasing value α occurs the shifting of crossover frequency ωc towards higher values and thus the reducing the phase margin. Percentage change of phase margin at the change from α = 0 to α = 1 is 8.1%. If α < 0.6, then the change of nominal phase margin will be below 5%.
Dependency of phase margin on the dumping factor ζ is higher when the angular frequency ω r is closer to mid-frequency region. Figure 6(c) shows the dependence of the phase margin on α = mA /mr for ωr = 3.9 rad/s. This dependence is highly parameterized by damping factor ζ, therefore we will examine only the extreme values. For ζ = 0.02, the phase margin with an increasing value α decreases to a value 41.8° at α = 1 (8.3%). For ζ = 0.7, the phase margin approximately until α = 0.6 increases and then decreases. The percentage difference between the maximum phase and minimum phase is approximately 15%. For the worst case (ζ = 0.7), the 5% change in nominal phase margin is ensured if α < 0.1. From this results that the lower is the damping factor ζ the less deformed is the phase diagram, the consequence of which is reduction of phase margin with α. For ζ = 0.02, this dependence is almost identical to the case where ωr = 0.1 rad/s.
From the performed simulations, it can be stated that if the frequency ωr of non-modelled dynamics is situated from the first breakpoint farther than one decade, then the phase margin with respect to nominal phase margin is 5%, if α < 0.6. If ωr of non-modelled dynamics is situated in the region of one decade from the first breakpoint, then the nominal change of the phase margin will be less than 5%, if α < 0.1. This applies for the worst case, that is, for ζ = 0.7. For other values of the damping factor, the nominal change of phase margin will be lower.
In the region of low frequencies, it is explicitly true that the smaller is the phase margin, the greater is the overshoot of complementary sensitivity function of closed positioning system which is in fact a step response of the positioning system if the input is the reference signal and the output is the process variable.
High-frequency region
Phase margin with increasing value α mildly grows for all damping factors ζ except ζ = 0.02. For ζ = 0.02, there is a significant reduction in the phase margin from a certain value α, which depends on angular frequency ωr . Parameterization by ζ is negligible if ωr ≥ 10ωc.
Overshoot of complementary sensitivity function in the area of one decade over frequency ωc is not as clear as that of low frequency, but is a complex function of the variables α, ζ and the phase margin.
Conclusion
Based on the performed analysis, it results that the dynamics of vibroisolation system can influence the mechanical part of DC motor via damping factor ζ as well as by impact of additional gain 1 + α. Impact of the damping factor is reflected only in a limited frequency band whose width for a certain value α as is given in Table 1. Impact of additional gain is reflected always if α > 0 at frequencies greater than the resonance frequency ωr . Above this resonance frequency and after the effect of damping factor ζ, the magnitude part of the Bode diagram of transfer function S is shifted by the value of additional gain 1 + α with respect to transfer function Si . The phase parts of the Bode diagram of the aftermath of the impact of damping factor are almost identical. That is, if the resonance frequency of vibroisolation ωr is in sufficient distance from the frequency band responsible for dynamic properties of the positioning system, the effect of the damping factor ζ on these properties will be minimal.
The study of the effect of mechanical part of the positioning system on its features is an important issue and is likely to remain so also in the future as the requirements for accuracy and performance are continuously increasing. Taking into account these mechanical phenomena in the design process of the positioning system requires applying a mechatronic approach under which the process of design of mechanical structures and positioning system is integrated. This requires an understanding of the dynamics of the mechanical system, the operation of the positioning system and their interaction. 5 –8
Footnotes
Acknowledgements
This contribution is a result of the project Slovak Grant Agency – project VEGA 1/0872/16 ‘Research of synthetic and biological inspired locomotion of mechatronic systems in rugged terrain’ and project KEGA 048TUKE-4/2014 ‘Increasing of knowledge base of students in area of application of embedded systems in mechatronic systems’.
Declaration of conflicting interests
The author declared no potential conflicts of interest with respect to the research, authorship, and/or publication of this article.
Funding
The author(s) received no financial support for the research, authorship, and/or publication of this article.