
Abstract
Background
The diagnostic value of six tumor markers was investigated and the appropriate combinations of those tumor markers to discriminate small cell lung cancer was explored.
Methods
Patients suspected with lung cancer (1938) were retrospectively analyzed. Candidate tumor markers from carcinoembryonic antigen (CEA), squamous cell carcinoma-related antigen (SCC), cytokeratin 19 fragment 21-1 (CYFRA 21-1), neuron-specific enolase (NSE), tissue polypeptide antigen (TPA), and progastrin releasing peptide (ProGRP) were selected to construct a logistic regression model. The receiver operating characteristic curve was used for evaluating the diagnostic value of the tumor markers and the predictive model.
Results
ProGRP had the highest positive rate (72.3%) in diagnosed small cell lung cancer, followed by neuron-specific enolase (68.3%), CYFRA21-1 (50.5%), carcinoembryonic antigen (45.5%), tissue polypeptide antigen (30.7%), and squamous cell carcinoma-related antigen (5.9%). The predictive model for small cell lung cancer discrimination was established, which yielded the highest area under the curve (0.888; 95% confidence interval: 0.846–0.929), with a sensitivity of 71.3%, a specificity of 95.0%, a positive predictive value of 49.0%, and a negative predictive value of 98.0%.
Conclusions
Combining tumor markers can improve the efficacy for small cell lung cancer discrimination. A predictive model has been established in small cell lung cancer differential diagnosis with preferable efficacy.
Introduction
Lung cancer has been considered the most common malignancy, and the global leading cause of death from cancers for decades.1, 2 Although it only accounts for 13%–20% of all lung cancers, SCLC is an aggressive and rapidly growing neoplasm with a poor prognosis, and has usually metastasized by the time it is diagnosed.2–4 Compared to non-small cell lung cancer (NSCLC), treatment strategies of SCLC are quite different and progress has been stagnant for decades. Not only are there still no approved targeted drugs for SCLC, but also surgery is only appropriate for a few patients (2%–5%) with surgically resectable stage I SCLC. In spite of its high sensitivity to chemotherapy and radiotherapy, the 5-year survival rate is less than 7%.5, 6 Thus, the histological diagnosis of lung cancer, especially the differential diagnosis between SCLC and NSCLC, is crucial for both therapeutic and prognostic reasons. Currently, pathological diagnosis is the golden standard for the clinical diagnosis of lung cancer by means of image-guided percutaneous transthoracic needle biopsy and bronchoscope. However, the invasive pathological tissue biopsy limits the prevalence of the above approaches as screening tools. Moreover, the inadequate specimens from needle biopsy always render low accuracy. 7 Therefore, developing a non-invasive method for differentiating SCLC from NSCLC prior to biopsy or surgery has become an urgent need. Tumor markers (TMs) have been extensively studied in lung cancer for decades 8 ; however, no specific marker for SCLC has been identified.9, 10 Neuron-specific enolase (NSE) has been widely used in clinical practice for therapy monitoring and prognosis detection of SCLC. 11 However, previous literature has suggested that raised NSE concentrations were also observed in patients with NSCLC as a result of low specificity for SCLC diagnosis.12, 13 In recent years, some researchers have reported a promising tumor marker: pro-gastrin-releasing peptide (ProGRP), which is more sensitive and specific than NSE for the diagnosis of SCLC.14, 15 The diagnostic performance of ProGRP and NSE individually seemed better than other conventional tumor markers for SCLC; however, there are still some deficiencies.16–18 Some researchers attempted to improve their diagnostic efficacy in combination with other tumor markers including CEA, TPA, TPS, SCC, CA125, CA19-9, HE4, and CYFRA 21-1, etc.9, 19–25 However, no consensus has been reached with respect to tumor markers’ combined pattern in SCLC diagnosis. Also, the expression level of tumor markers is closely related to cancer stage. However, few studies focused on TMs’ diagnostic value in different stages. Therefore, we retrospectively investigated the following items: (a) a comparison of serum levels of six TMs (CEA, SCC, CYFRA 21-1, NSE, TPA, and ProGRP among SCLC, NSCLC, and benign lung disease (BLD); (b) an evaluation of the diagnostic efficacy of six TMs, respectively, in patients with SCLC and NSCLC subdivided by tumor node metastasis (TNM) stage; (c) an exploration of appropriate TM combined panels for SCLC discrimination and SCLC early detection.
Materials and methods
Patients
We retrospectively analyzed the clinical records of 2878 patients with suspected lung cancer admitted to our center from January 2015 to September 2018, and 1628 patients were finally included. The diagnosis of lung cancer was confirmed by histopathology from fiberoptic bronchoscopy, fine-needle transthoracic aspiration, and/or surgical resection in all patients. All patients were naïve to previous malignancy or antineoplastic therapy before lung cancer diagnosis. A more detailed description of inclusion and exclusion criteria were given in Figure E1. Histological subtypes and pathological stages were determined according to the 2015 WHO classification 26 and the criteria of the 8th edition of Cancer Staging Manual of the American Joint Committee on Cancer, 27 respectively.
Methods
Before any anticancer treatment, serum samples were obtained by venipuncture in all participants. Serum tumor markers including CEA, CYFRA 21-1, NSE, and TPA were measured by a commercial electrochemiluminescent assay (Roche Diagnostics, Mannheim, Germany), and the serum level of SCC and ProGRP was analyzed by ARCHITECT automated assay (Abbott Laboratories, Chicago, IL, USA).
Cut-off values
The following thresholds were recommended by corresponding manufacturers as the upper limit value of normal range: CEA, 3.2 (ng/mL); SCC, 2.0 (ng/mL); CYFRA 21-1, 3.0 (ng/mL); and NSE, 16.3 (ng/mL). A slight adjustment for TPA and ProGRP thresholds was made during the time included in our investigation. Receiver operating characteristic (ROC) analysis was then applied to get moderate thresholds of TPA and ProGRP as 130.0 (U/L) and 66.0 (pg/mL), respectively, which were approximately equal to recommended thresholds. In addition, parallel tests were performed of these TMs, referred to as TM combined panels. For example, NSE ≥16.3 (ng/mL) or Pro-GRP ≥66.0 (pg/mL) was considered abnormal.
Statistical analysis
Statistics descriptions included mean ± (SD) or median (interquartile range) for continuous variables, and frequency (n%) for categorical variables. As skewed distributed data, TM levels were compared using non-parametric test (Mann–Whitney U test (two samples); or Kruskal-Wallis one-way ANOVA (k samples)), while normally distributed data were compared using parametric tests (Student's t test). The χ 2 test was used to evaluate differences in categoric variables. In univariate analysis, factors with p < 0.20 28 will move on to multivariate analysis. Factors with p < 0.05 to multivariate analysis were considered as candidate risk factors for logistic regression model construction. Statistical significance was set as p < 0.05 in all analyses. Sensitivity, specificity, positive predictive value (PPV), and negative predictive value (NPV) were calculated to estimate the validity and reliability of the diagnostic test. Sensitivity was considered as 100% × (the number of SCLC with positive tumor marker/total number of SCLC patients). Thus, in the analysis of positive rates of TMs, positive rates and sensitivity were numerically equal. Areas under curve (AUC) derived from the ROC curves were also performed to evaluate the diagnostic efficacy. Statistical analysis was conducted using SPSS version 20.0 (IBM Co.; New York, USA) and GraphPad Prism software version 7.00.
Results
Patient characteristics
As shown in Table 1, 1505 patients had NSCLC, 101 had SCLC, 8 had large cell neuro-endocrine carcinoma (LCNEC), 8 had atypical carcinoid or typical carcinoid (AC/TC), 6 had other neuro-endocrine carcinoma (NEC). A total of 310 patients with pulmonary nodules were confirmed to have BLD (including lung abscess, sarcoidosis, organizing pneumonia, tuberculosis, pulmonary aspergillosis, hamartoma of lung, pulmonary sclerosing hemangioma, and pulmonary granulomas). Mean age (± SD) in NSCLC patients was 61.3 ± 10.2 years old, and 63.7 ± 10.0 years old in SCLC patients. More than half of the NSCLC patients were at an early stage at the time of diagnosis, while most of the SCLC patients were at an advanced stage.
Patient characteristics.
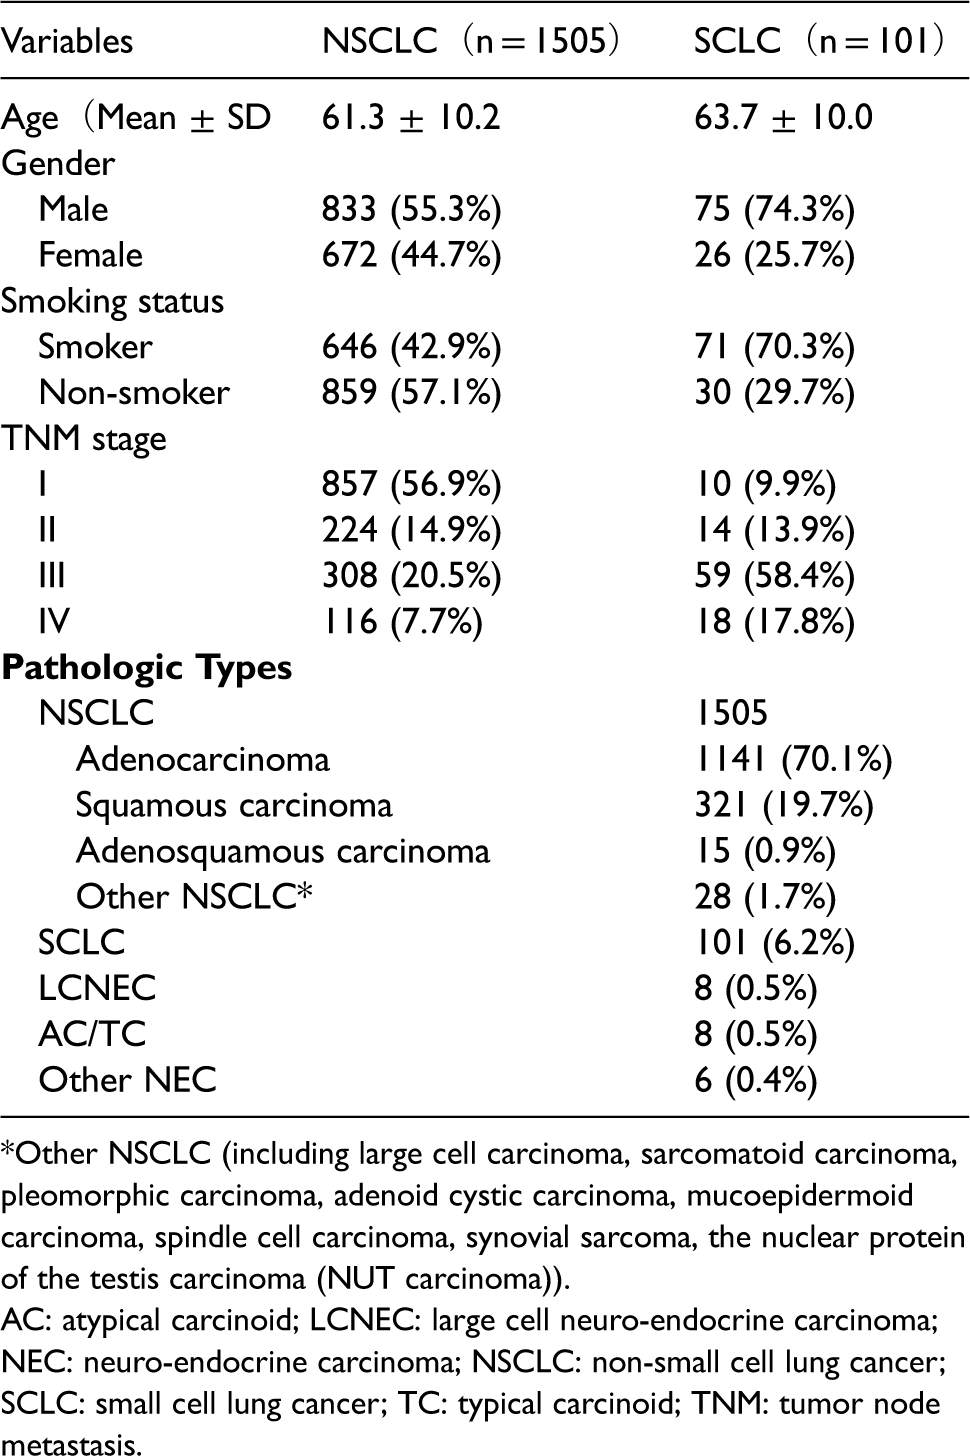
*Other NSCLC (including large cell carcinoma, sarcomatoid carcinoma, pleomorphic carcinoma, adenoid cystic carcinoma, mucoepidermoid carcinoma, spindle cell carcinoma, synovial sarcoma, the nuclear protein of the testis carcinoma (NUT carcinoma)).
AC: atypical carcinoid; LCNEC: large cell neuro-endocrine carcinoma; NEC: neuro-endocrine carcinoma; NSCLC: non-small cell lung cancer; SCLC: small cell lung cancer; TC: typical carcinoid; TNM: tumor node metastasis.
TM levels between NSCLC and SCLC according to TNM stage
Table E1 shows that levels of CEA, NSE, TPA, and ProGRP were significantly higher in the SCLC group compared to those of the NSCLC group. CYFRA21-1 was also insignificantly higher in the SCLC group. As shown in Table E2, in stage I + II subgroup, SCLC was significantly higher in the expression of CEA, NSE, and ProGRP; in stage III + IV subgroup, SCLC was associated with significantly higher median serum levels of NSE and ProGRP, but lower median serum levels of CEA, SCC, and CYFRA21-1. TPA was higher in SCLC than that in NSCLC both in stage I + II and stage III + IV subgroups without statistical significance. According to the Spearman correlation analysis, tumor stage was significantly correlated with CYFRA21-1 (p = 0.018; r = 0.138), NSE (p < 0.001; r = 0.476), TPA (p < 0.001; r = 0.294), and ProGRP (p < 0.001; r = 0.278) levels in patients with SCLC. As for patients with NSCLC, tumor stage was significantly correlated with CEA (p < 0.001; r = 0.300), SCC (p < 0.001; r = 0.119), CYFRA21-1 (p < 0.001; r = 0.323), NSE (p < 0.001; r = 0.183), and TPA (p < 0.001; r = 0.273) levels.
Positive rates of TM values higher than cut-off value and TM values twice as high than cut-off value in patients with SCLC, NSCLC, and BLD
Figure 1 and Table E1. indicated that positive rates of CEA, CYFRA21-1, and TPA levels higher than the cut-off value in the NSCLC group were 40.5%, 41.9%, and 23.4%, respectively, while 45.5%, 50.5%, and 30.7% in the SCLC group, which was slightly higher in the SCLC group than that in the NSCLC group. The positive rates of CEA levels twice as high than the cut-off values shared a similar result between the SCLC (17.6%) and NSCLC (18.8%) groups, as did CYFRA21-1 (11.9% for NSCLC; 12.7% for SCLC). Of note, positive rates of NSE levels higher than the cut-off value was much higher in the SCLC group than that in the NSCLC group (68.3% for SCLC; 18.3% for NSCLC), as in ProGRP (72.3% for SCLC; 8.8% for NSCLC). In addition, positive results of NSE and ProGRP were often seen in patients with SCLC or NSCLC, but levels twice as high than the standard cut-off values were rarely observed in patients with NSCLC (< 2%). Abnormal SCC values, especially twice as high than the SCC cut-off value, were very rare in SCLC (1%).
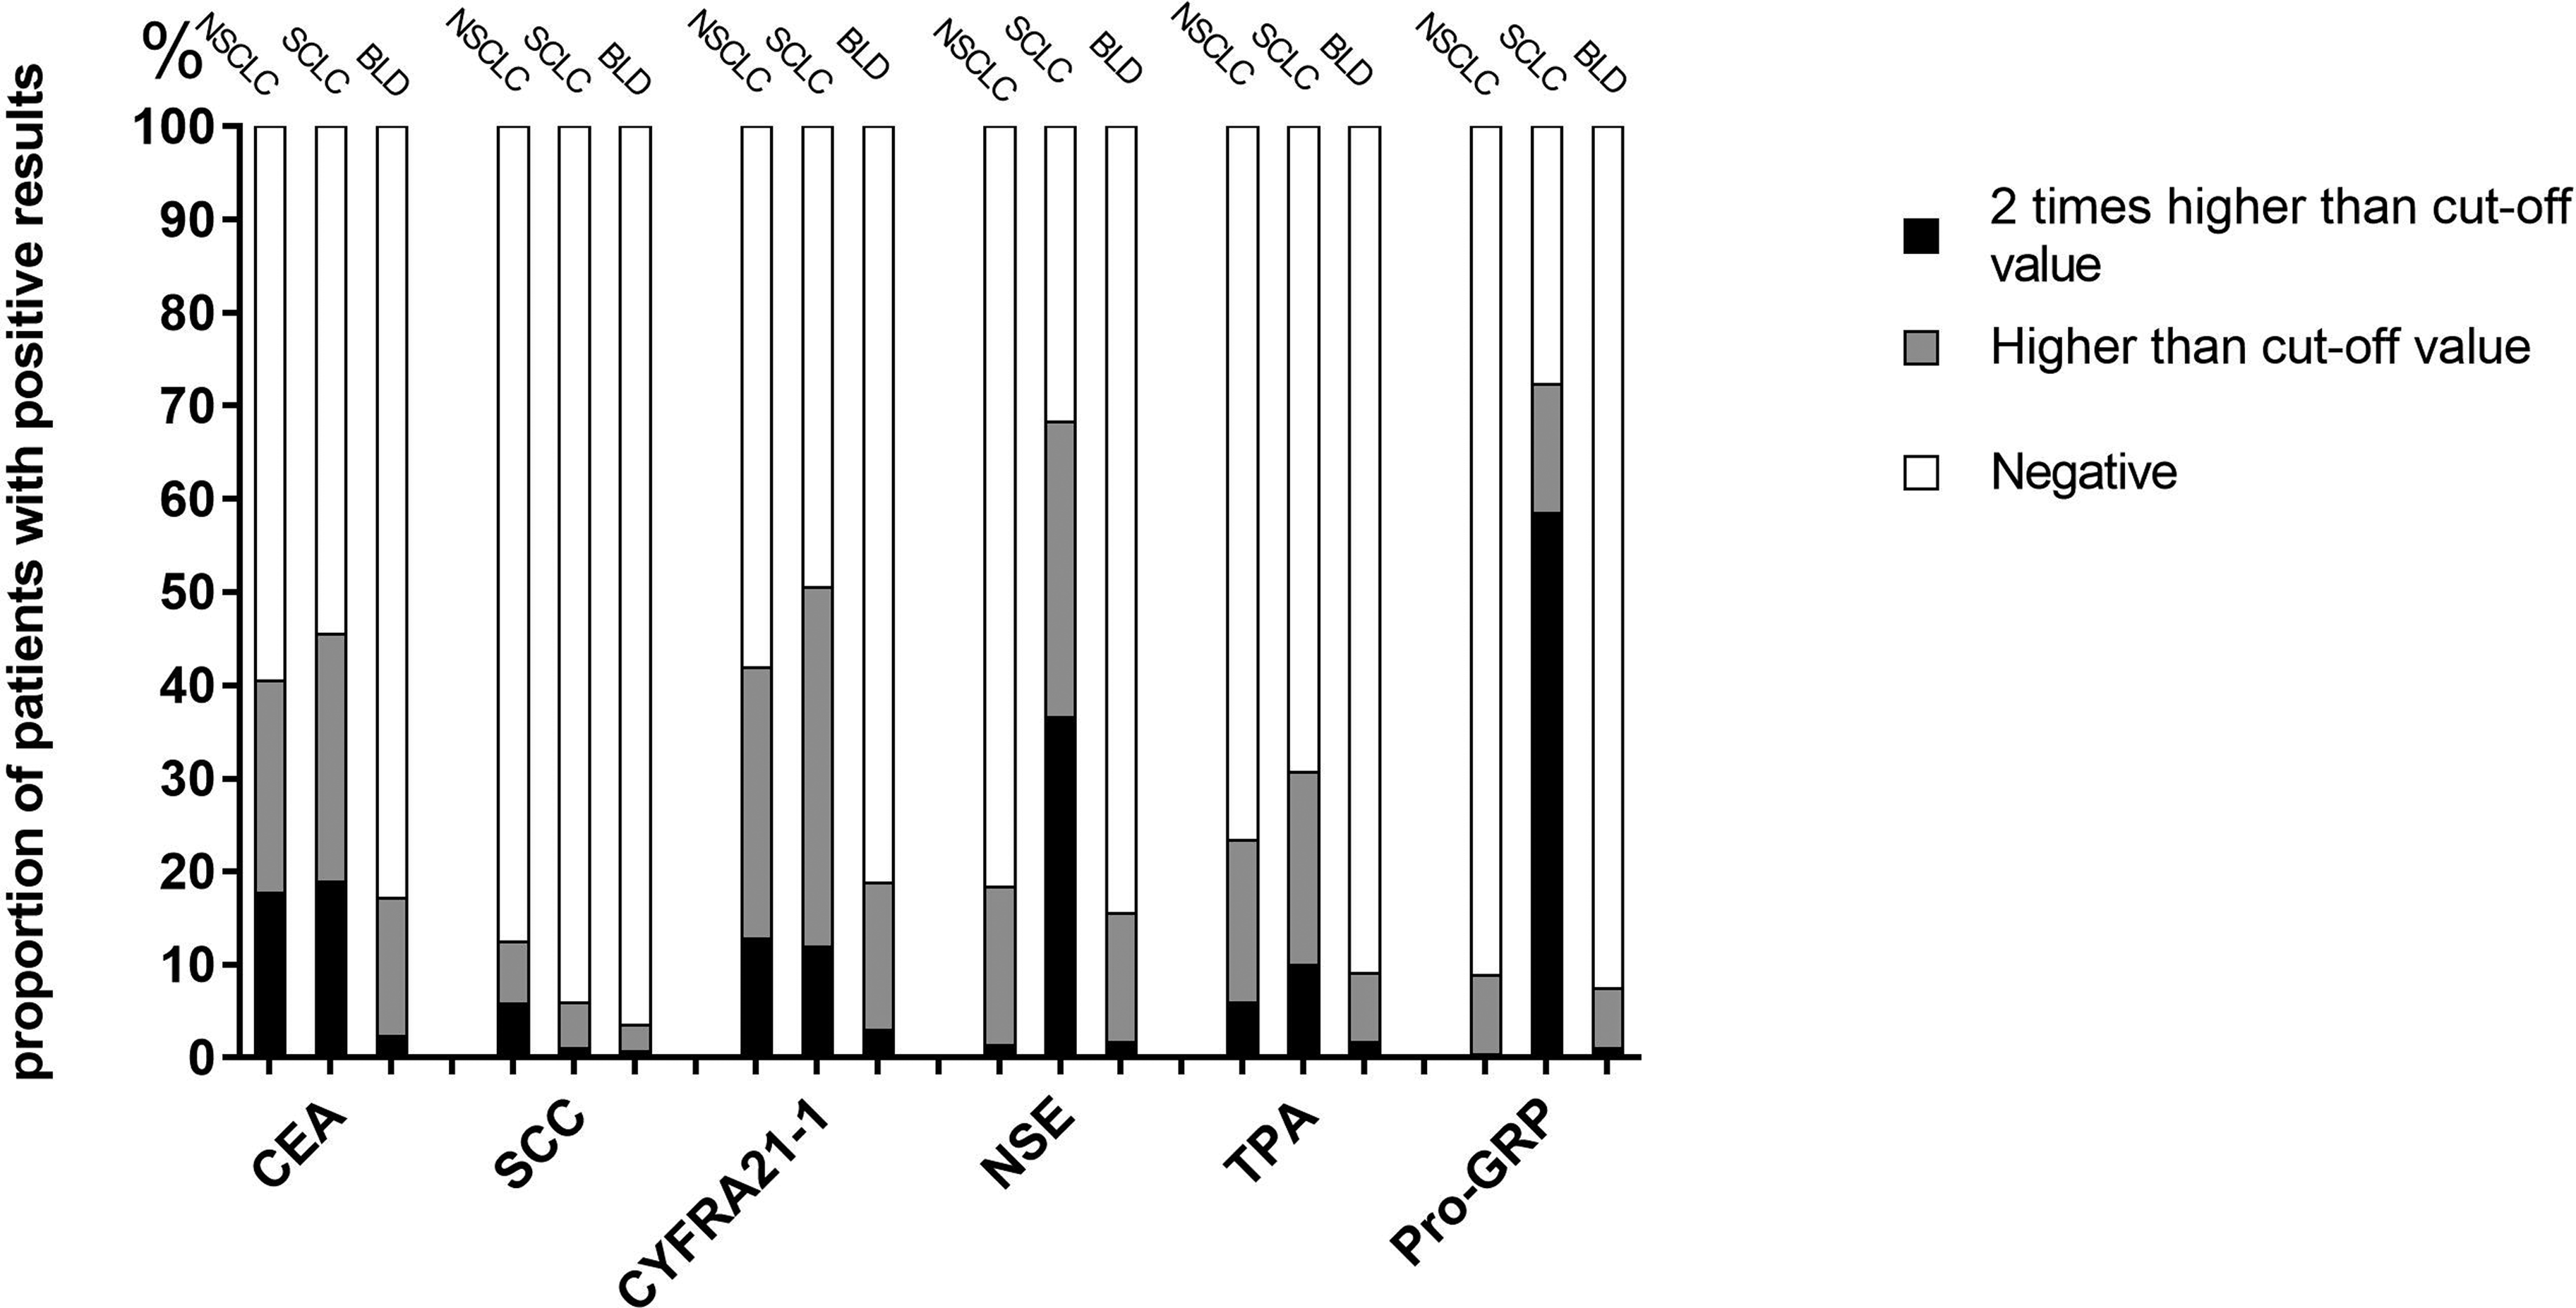
Positive Rates of TM values higher than cut-off value and TM values 2 times higher than cut-off value among patients with NSCLC, BLD and SCLC.
Positive rates of TM according to TNM stage in patients with SCLC
Figure 2 displays the positive rates of TM according to the TNM stage in patients with SCLC. The positive rates of NSE, ProGRP, and the TM combined panel of NSE + ProGRP showed increasing trends with the progress in TNM stage.
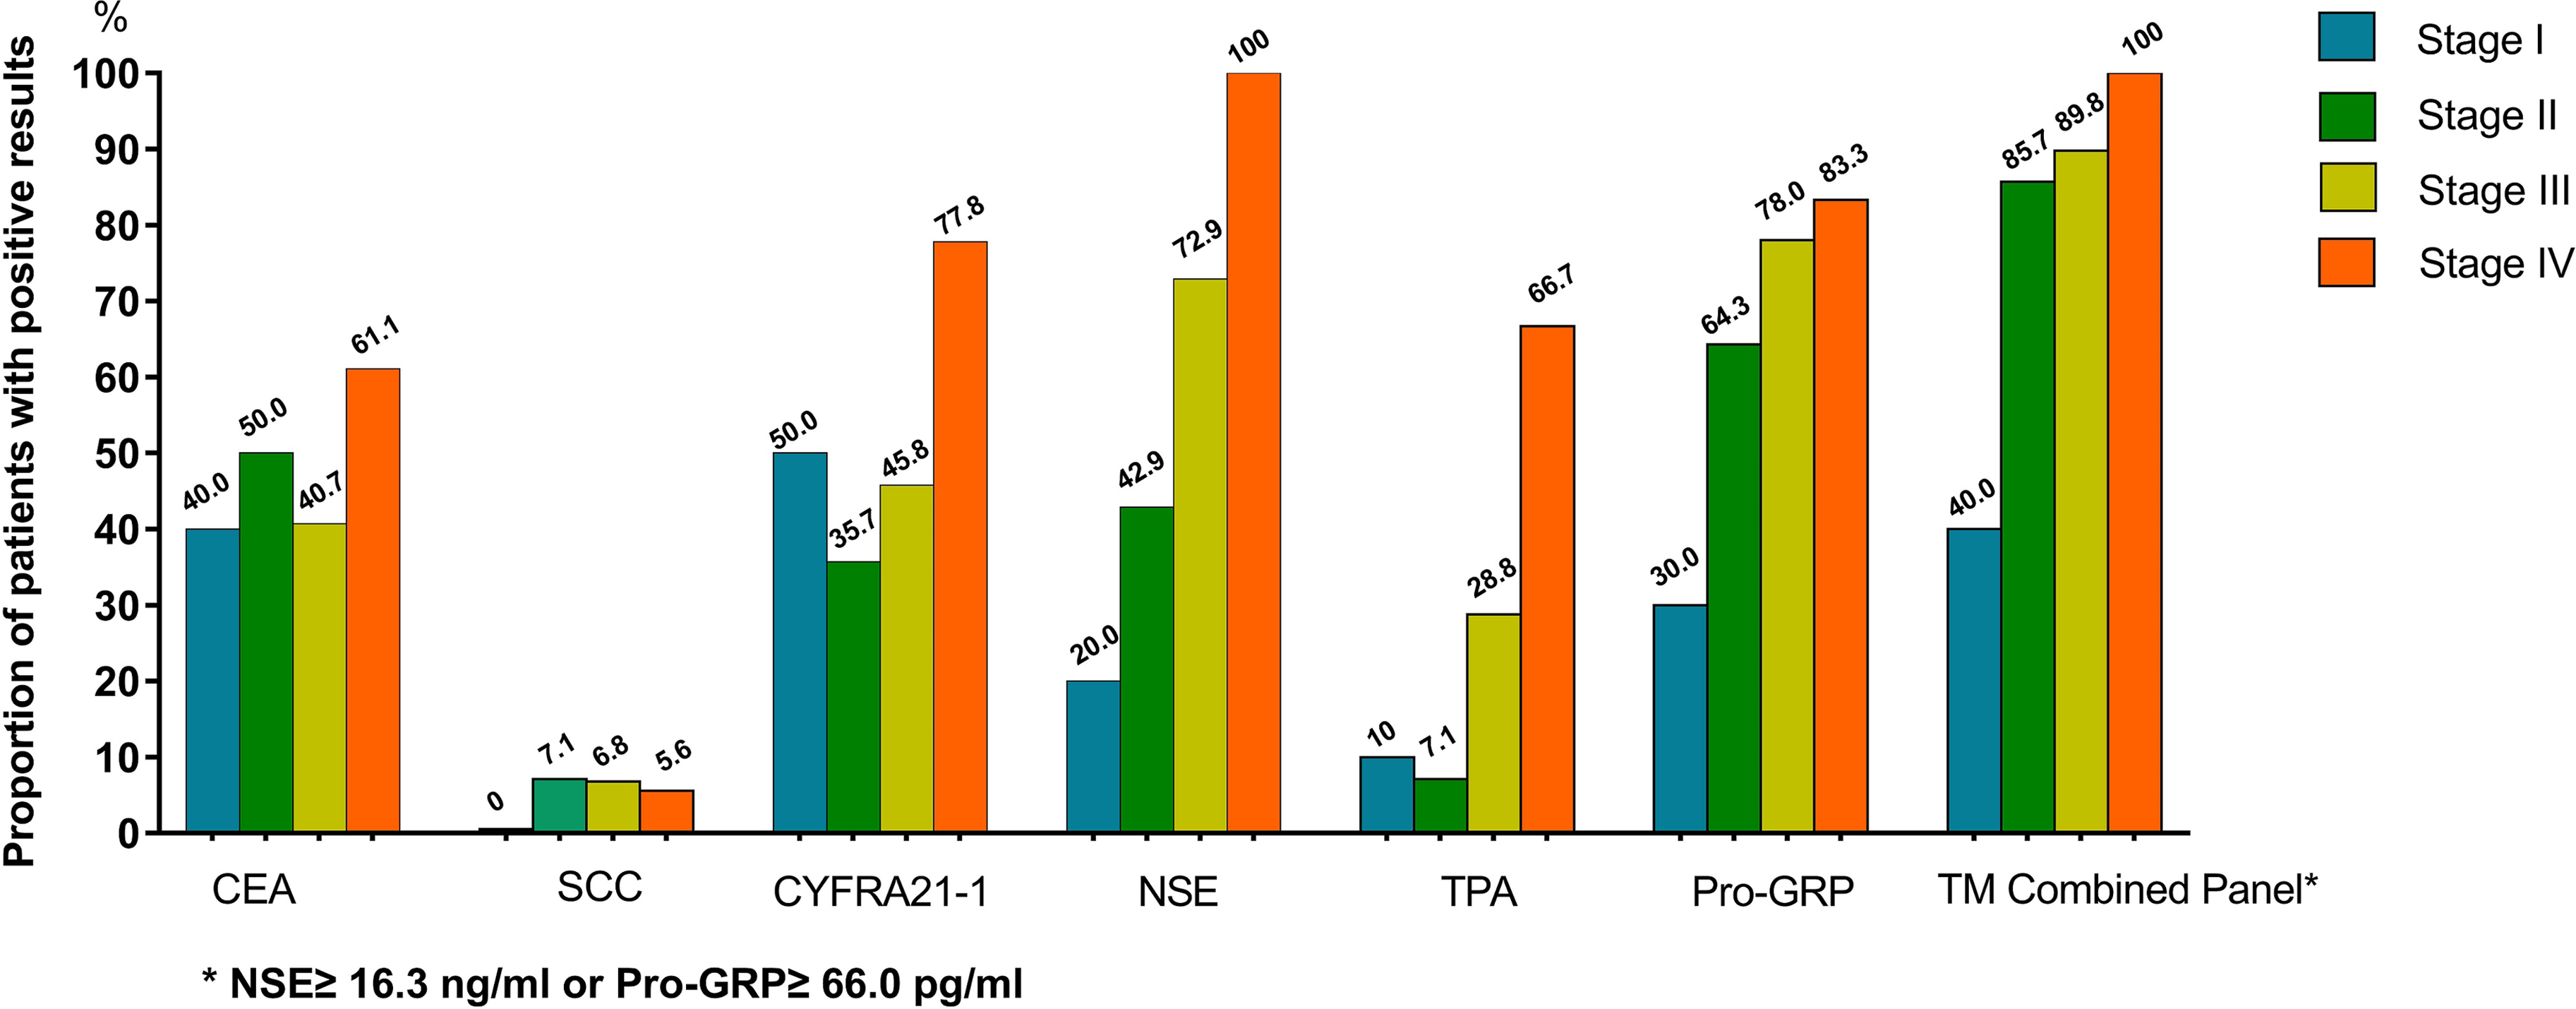
Positive Rates of TM according to TNM stage in patients with SCLC.
Logistic regression predictive model for discriminating SCLC from NSCLC
In Table E3, univariate analysis revealed that four out of six TMs included in the analysis differed significantly between SCLC and NSCLC as follows: CEA (OR: 1.000; 95% CI: 1.000–1.001), SCC (OR:0.757; 95% CI: 0.579–0.991), NSE (OR: 1.098; 95% CI: 1.075–1.121), and ProGRP (OR: 1.009; 95% CI: 1.007–1.011). In the multivariate analysis, SCC, NSE, and ProGRP were proved to be independent factors to discriminate SCLC from NSCLC. The selected factors were further applied to constructing the logistic regression predictive model. According to the regression coefficients, a predictive model for discriminating SCLC between NSCLC can be described as follows: logit P = ln = −4.317 + 0.008 × ProGRP − 0.496 × SCC + 0.070 × NSE.
A ROC curve was performed to assess the accuracy of the predictive model, a TM combined panel of NSE + ProGRP and six individual TMs (Figure 3).
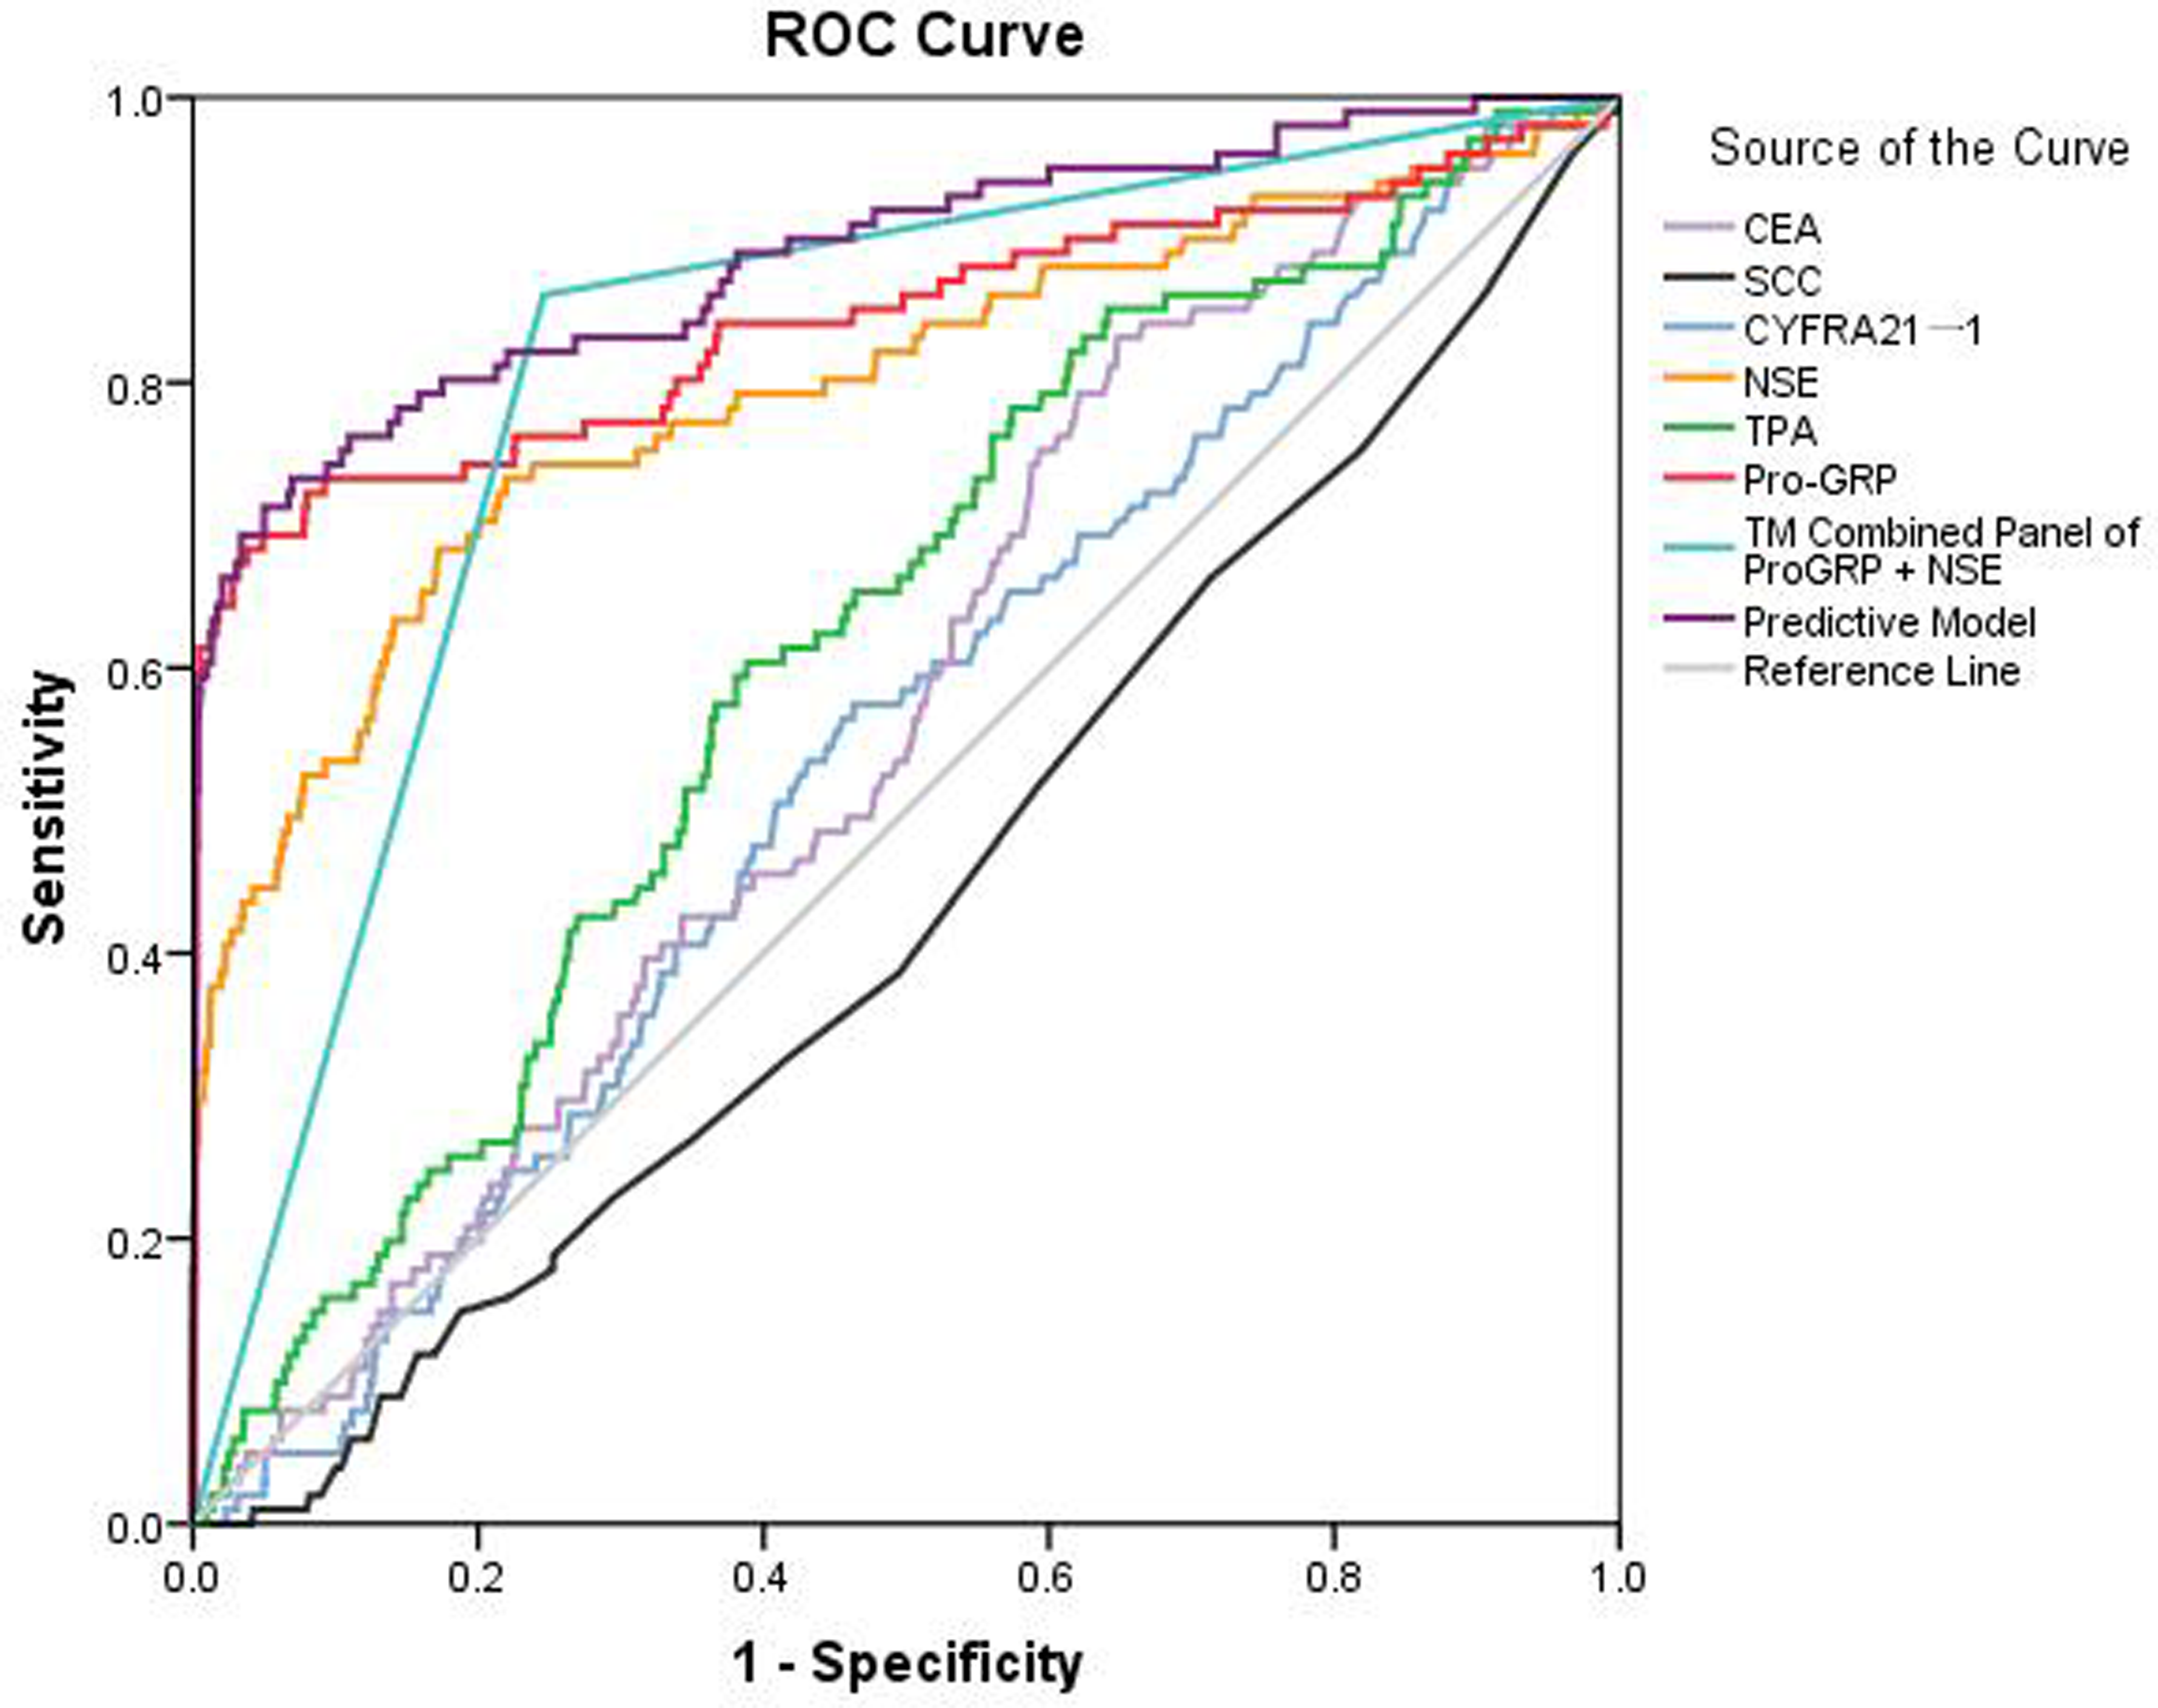
ROC of Predictive Model, TM Combined Panel and each of 6 individual TM for discriminating NSCLC from SCLC.
Validity, reliability and efficiency of the diagnostic test for discriminating SCLC from NSCLC
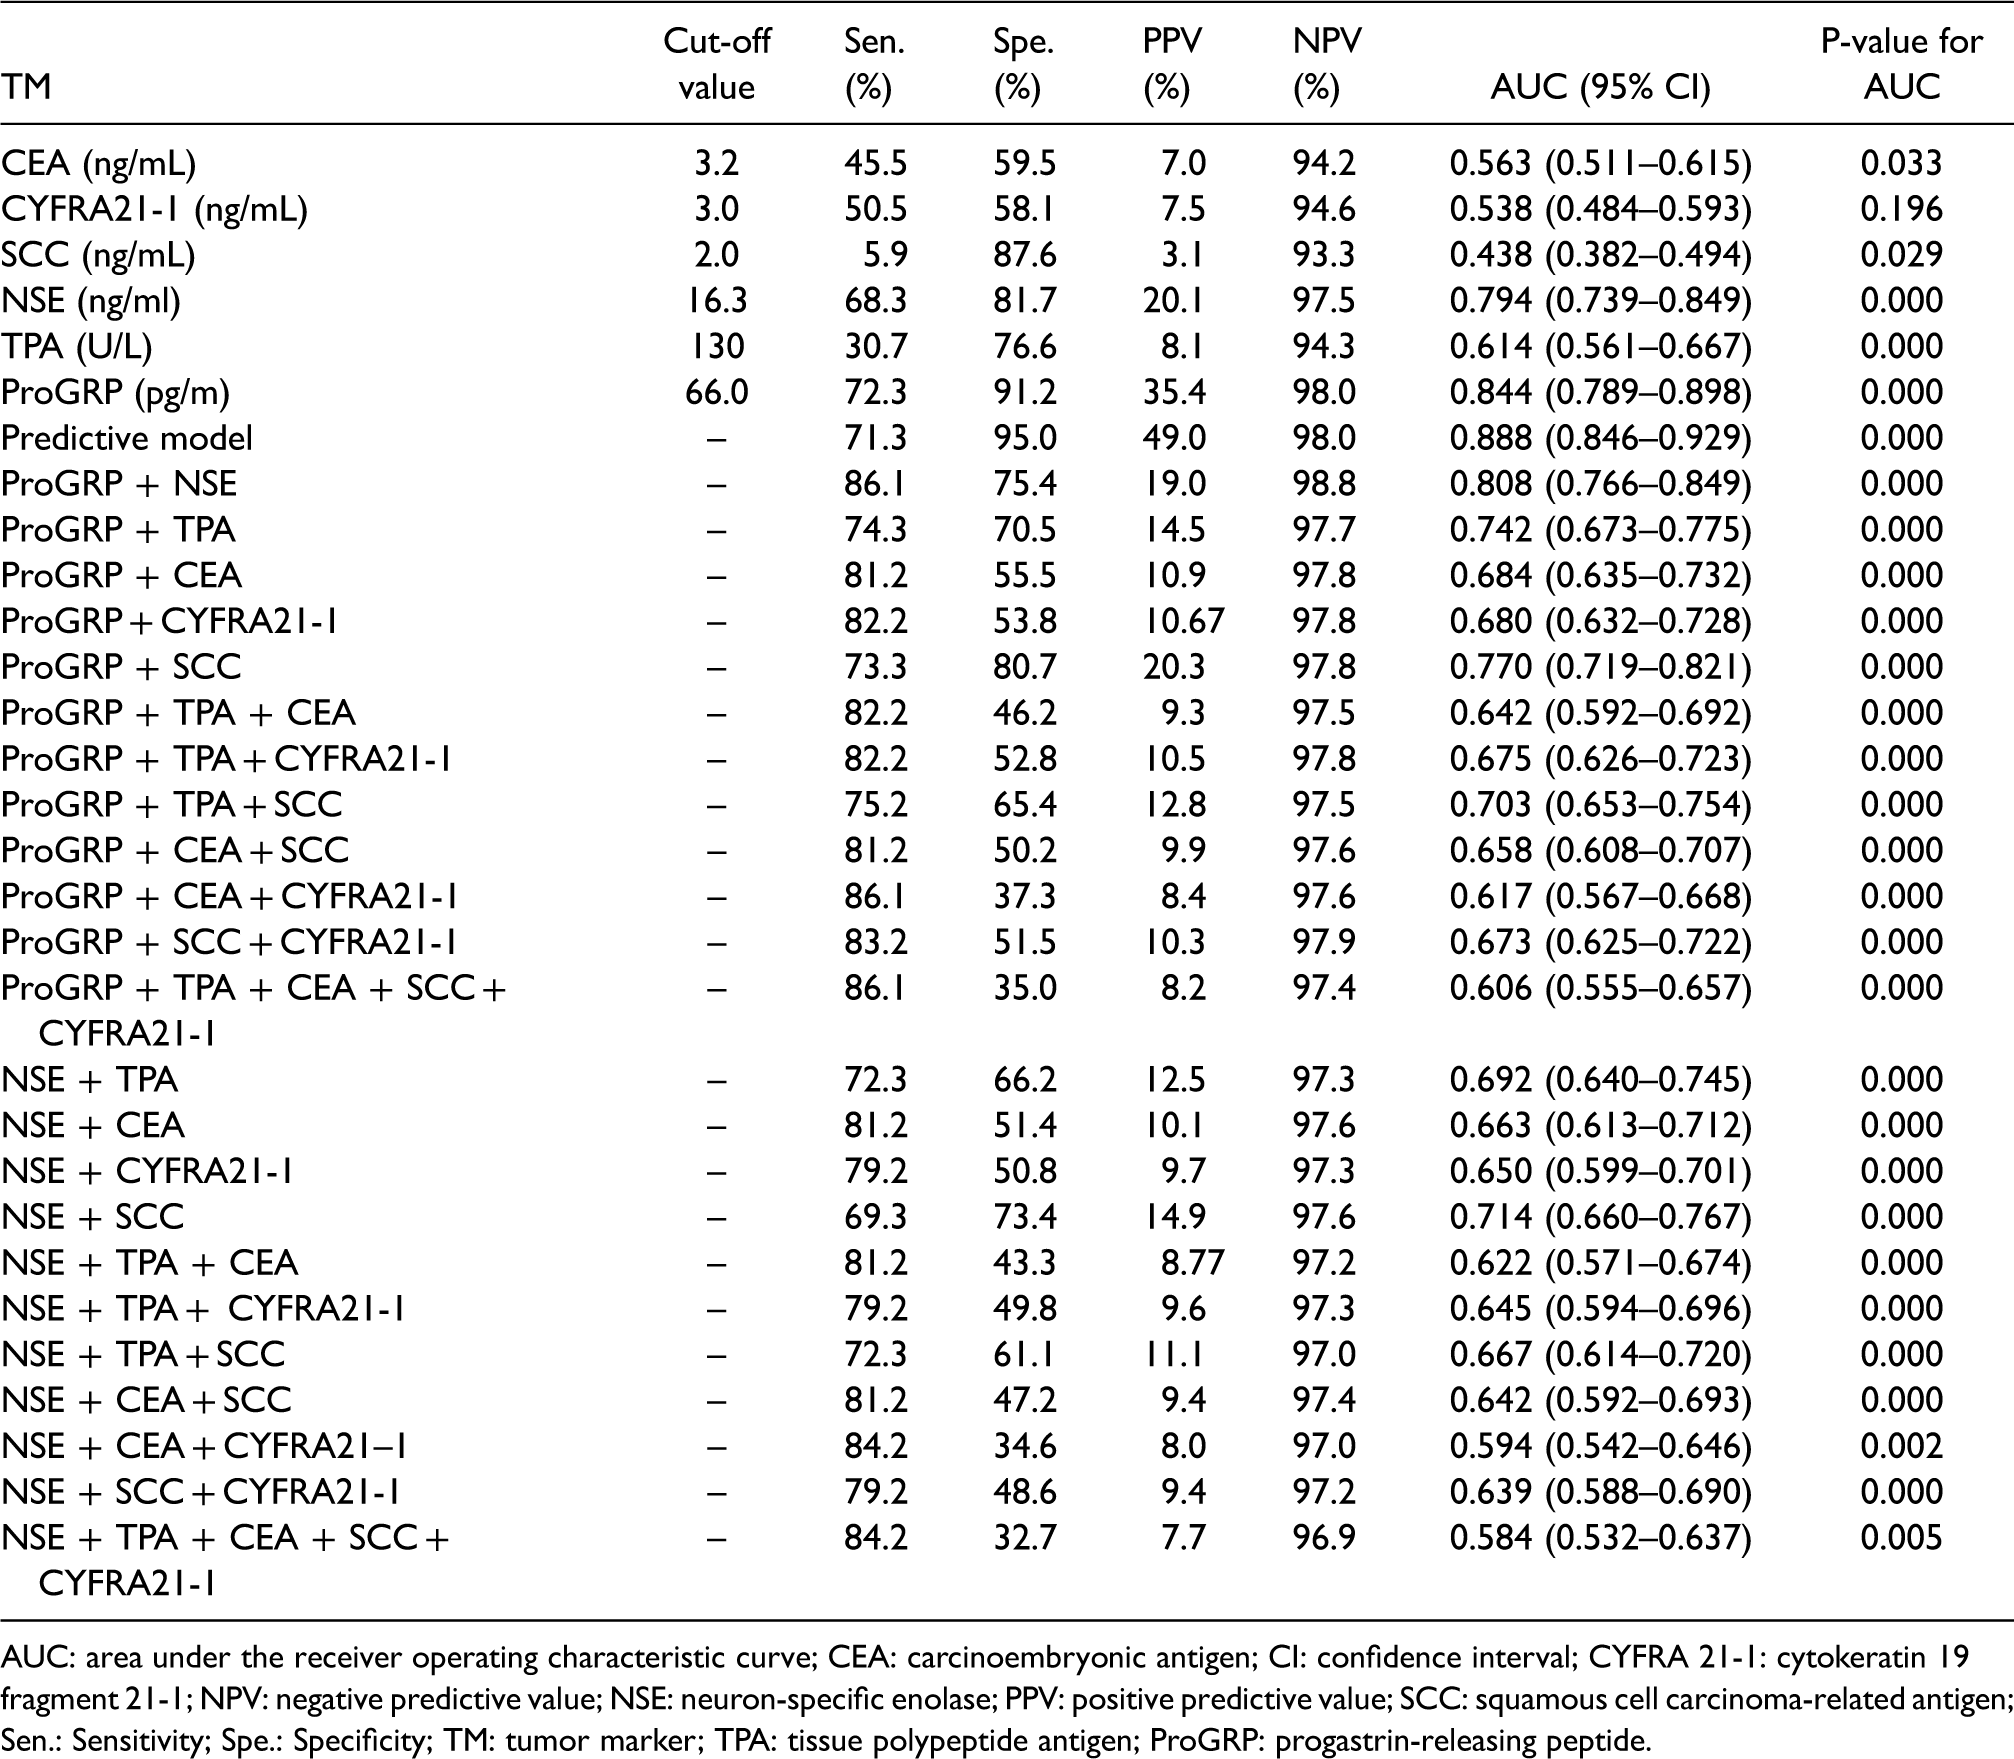
Table 2 presents the sensitivity, specificity, PPV, NPV, and AUC of each individual TM, TM combined panels, and the predictive model for discriminating SCLC from NSCLC. ProGRP and NSE performed better than the other four TMs in detecting SCLC individually. PPV of the TM combined panel of ProGRP + NSE was 98.8%, which was the highest in all the diagnostic tests included. The TM combined panel containing one of the two TMs (ProGRP or NSE) did not show remarkable improvement compared with these two TMs individually. The predictive model yielded the highest AUC (AUC: 0.888; 95% CI: 0.846–0.929) among individual TM and TM combined panels, whose sensitivity and specificity was 71.3% and 95.0%, respectively. The sequence of AUC in discriminating SCLC from NSCLC was the predictive model (0.888) > ProGRP (0.844) > TM combined panel of ProGRP + NSE (0.808) > NSE (0.794) > TPA (0.614) >CEA (0.563) > CYFRA 21-1 (0.538) > SCC (0.438).
Performance of each individual TM, TM combined panels and binary logistic regression model for differentiating SCLC from NSCLC.
AUC: area under the receiver operating characteristic curve; CEA: carcinoembryonic antigen; CI: confidence interval; CYFRA 21-1: cytokeratin 19 fragment 21-1; NPV: negative predictive value; NSE: neuron-specific enolase; PPV: positive predictive value; SCC: squamous cell carcinoma-related antigen; Sen.: Sensitivity; Spe.: Specificity; TM: tumor marker; TPA: tissue polypeptide antigen; ProGRP: progastrin-releasing peptide.
Discussion
SCLC is a rare malignancy with rapid progression. However, the early detection modalities are still insufficient. This study attempted to improve the diagnostic efficiency of tumor markers and the early diagnosis of SCLC through various TM combined panels. This study also revealed that CEA, CYFRA21-1, NSE, TPA, and ProGRP were significantly higher in the SCLC group than those in the BLD and NSCLC groups. Previous studies showed that higher levels of CEA, CYFRA21-1, and TPA were associated with NSCLC.8, 10, 23–25 However, significantly higher levels of CEA, CYFRA21-1, and TPA were observed in the SCLC group than in the NSCLC group. As shown in Table 1, the proportion of advanced stage in SCLC patients (stage III + IV: 76.2%) was much higher than that in NSCLC patients (stage III + IV:28.3%), which indicated that the distinction of TNM stage proportion between SCLC and NSCLC accounted for this observation. Molina et al.18, 23 showed that significantly higher TM concentrations were observed in patients with advanced tumors, which may confuse the results of histological diagnosis. Therefore, histological diagnosis of lung cancer derived from tumor marker levels should consider the proportionality of tumor stage. Different cut-off values for different tumor stages will be indispensable. 15 Positive rates of NSE and ProGRP levels higher than cut-off value was much higher in the SCLC group than that in the NSCLC group, which indicated that SCLC patients were closely correlated with the high levels of ProGRP and NSE (Figure 2, Table E1, and Table E2). We found that ProGRP (sensitivity: 72.3%; specificity: 91.2%; AUC: 0.844) demonstrated the best performance in discriminating SCLC from NSCLC, followed by NSE (sensitivity: 68.3%; specificity: 81.7%; AUC: 0.794). A meta-analysis 29 containing 5146 subjects suggested that the sensitivity, specificity, and AUC of ProGRP was 0.716, 0.921, and 0.9236, respectively, which were obviously higher than 0.602, 0.875, and 0.8213, respectively, for NSE. In our study, positive results for NSE and ProGRP were both seen in patients with SCLC and NSCLC, which was similar to previous reports.17, 18 In addition, levels higher than twice the standard cut-off values were rarely observed in patients with NSCLC (<2%), while positive rates of NSE (36.6%) and ProGRP (58.4%) in patients with SCLC still remained high in this circumstance. Thus, high levels of NSE and ProGRP (especially higher than twice the standard cut-off values) strongly indicated that the patient had SCLC rather than NSCLC. However, the level of NSE and ProGRP may not be elevated in early-stage SCLC. In stage I SCLC, both NSE and ProGRP had a low positive rate (20.0% and 30.0%, respectively), while CEA (40.0%) and CYFRA21-1 (50.0%) had a higher positive rate, which suggested that the former two TMs had limited value in early detection for SCLC, while CEA and CYFRA21-1 might play a complementary role in SCLC early diagnosis (see Figure 3). When NSE ≥16.3 ng/mL or ProGRP ≥66.0 pg/mL were assessed as a combined panel, positive rates were improved remarkably in all stages, compared to the assessment ofeach of the two TMs (Figure 3).
A positive result of TPA was rarely observed in patients with stage I (10.0%) or stage II (7.1%) SCLC, while the positive proportion rose to 66.7% in stage IV, suggesting that abnormal TPA revealed a high possibility of advanced stage SCLC.30–32 Compared with individual TM, the TM combined panel of NSE + ProGRP resulted in the highest sensitivity (86.1%) but a lower specificity (75.4%) in discriminating SCLC from NSCLC (Table 2). To enhance the diagnostic efficiency of TMs, several TM combined panels as well as varieties of algorithms for TMs were explored in previous literature. Yang et al. 21 combined tumor markers including CEA, CYFRA21-1, NSE, CA125, and SCC for lung cancer screening in healthy subjects. By using logistic regression and ROC curve analyses, CEA + CA125 was the best combination with a sensitivity of 75.5%, a specificity of 79.1%, and an AUC of 0.863. An algorithm established by Molina et al. 23 obtained the sensitivity (79.5%), specificity (99.6%), PPV (98.6%), and NPV (92.8%) for discriminating SCLC from NSCLC in the cohort with 175 SCLC and 472 NSCLC. However, why such criteria was applied to the algorithm was not mentioned, which may limit its scope for clinical application. In addition, PPV varied by prevalence 33 due to the high proportion of SCLC (175/627) in their study; its PPV was higher than other previous publications.15, 20 Molina et al. 24 combined six serum TMs (CA15.3, CEA, CYFRA 21-1, NSE, ProGRP, and SCC) as a panel (>1 abnormal TM value; parallel test) obtained a sensitivity, specificity, NPV, and PPV of 96.6%, 82.0%, 99.1%, and 52.1% for the diagnosis of SCLC, respectively. However, our results with more combined TMs did not display better diagnostic efficacy, and the feasibility of this diagnostic panel required further assessment of cost-effectiveness analysis. Mauro et al. 16 ran a multivariable logistic regression analysis to quantify the added value of ProGRP to other conventional markers including ProGRP, NSE, CEA, and CYFRA 21-1, but no markers improved the performance of ProGRP in the diagnosis of SCLC with respect to benign lung disease. In our study, the logistic regression predictive model including SCC, NSE, and ProGRP obtained a preferable efficacy (AUC: 0.888; 95% CI: 0.846–0.929; sensitivity: 71.3%; specificity: 95.0%).
In conclusion, this large-scale retrospective study confirmed that ProGRP had the best performance in discriminating SCLC from NSCLC, followed by NSE. The TM combined panels of ProGRP + NSE could elevate sensitivity remarkably, but decrease specificity to some extent. Parallel tests that added ProGRP or NSE to other conventional markers including CEA, SCC, CYFRA 21-1, NSE, and TPA did not show remarkable improvement in SCLC discrimination compared with individual TMs. In contrast, the logistic regression model was an essential tool to improve the efficacy for discriminating SCLC from NSCLC. Moreover, we had established a predictive model in SCLC differential diagnosis, which obtained a preferable efficacy and would be recommended in clinical practice. However, there are still some limitations in this study. First, we investigated the medical records and collected data retrospectively; therefore, selection bias was inevitable. Further prospective studies are required to validate the efficacy of these models. Second, most of the lung cancer patients in our center were at the early stage, and patients with stage I accounted for 53.3% of all lung cancer, which was one of the main reasons for lower sensitivity and AUCs of TMs in this study. Finally, though the predictive models improved diagnostic performance by AUCs, the problem of low sensitivity of TMs remained to be resolved. As an important aspect of lung cancer screening, computed tomography (CT) imaging exhibits very high sensitivity than tumor marker screening; however, the specificity of CT is poor, which indicates that CT imaging may play a complementary role with tumor markers in lung cancer diagnosis and even in distinguishing SCLC from NSCLC.24, 33–36 Therefore, it can be concluded that the combination of CT and tumor markers is promising and deserves more attention for future study.
Footnotes
Acknowledgments
This research did not receive any specific grant from funding agencies in the public, commercial, or not-for-profit sectors. The authors appreciate Meixia Shang,M.D. (Department of Medical Statistics, Peking University First Hospital, Beijing, China), and Xueyan Han, M.P.H. (Department of Medical Statistics, Peking University First Hospital, Beijing, China), for their help with data analysis.
The authors appreciate Yuanxi Xu (Shanghai Hengchang Education Technology Co., LTD) for linguistic editing and proofreading for this manuscript.
Author contributions:
Conception and design: Shijie Zhang, Xiangzheng Liu; provision of study materials or patients: Shijie Zhang, Zhimao Chen; collection and assembly of data: Zhimao Chen, Xiangzheng Liu, Xueqian Shang, Kang Qi; data analysis and interpretation: Zhimao Chen, Xiangzheng Liu, Kang Qi; manuscript writing and final approval: all authors.
Declaration of conflicting interests
The author(s) declared no potential conflicts of interest with respect to the research, authorship, and/or publication of this article.
Ethical statement
This retrospective study was approved by the ethics committees of Peking University First Hospital for exemption of informed consent.
Funding
The author(s) received no financial support for the research, authorship and/or publication of this article.
Supplemental material
Supplemental material for this article is available online.
References
Supplementary Material
Please find the following supplemental material available below.
For Open Access articles published under a Creative Commons License, all supplemental material carries the same license as the article it is associated with.
For non-Open Access articles published, all supplemental material carries a non-exclusive license, and permission requests for re-use of supplemental material or any part of supplemental material shall be sent directly to the copyright owner as specified in the copyright notice associated with the article.