
Abstract
Introduction:
Hypoxia inducible factors (HIF) and prolyl hydroxylase domain (PHD) enzymes play a central role in tumor progression in clear cell renal cell carcinoma (ccRCC). However, there are currently no data regarding the behavior of this pathway (HIF/PHD) in a large number of benign renal tumors, the oncocytomas. The aim of the present study was to compare the expression levels of these factors between ccRCC and oncocytoma tumors.
Material and methods:
A total of 56 fresh frozen specimens from patients with ccRCC and 14 oncocytoma specimens were analyzed via reverse transcription-quantitative polymerase chain reaction in order to assess the expression levels of HIF-1α, HIF-2α, PHD1, PHD2, and PHD3. The analysis involved both fresh frozen tumor samples as well as adjacent normal kidney tissues.
Results:
In ccRCC, HIF-1α and HIF-2α levels were upregulated in 65.5% and 71.4% of cases, respectively. PHD3 was downregulated only in 15.4% of the ccRCC cases, in contrast with oncocytoma cases, which exhibited low expression levels in the majority. The upregulation of PHD3 messenger RNA (mRNA) levels in ccRCC when compared with oncocytoma was statistically significant (P<0.001). No other comparisons (HIF-1α, HIF-2α, PHD1, and PHD2) were significantly different. HIF-2α and PHD3 mRNA expression levels were negatively correlated with Fuhrman Grade (P=0.029 and P=0.026, respectively) in ccRCC.
Conclusion:
To the best of our knowledge, this is the first time that the HIF/PHD pathway was compared between ccRCC and a common benign tumor, identifying the upregulation of PHD3 as the possible underlying factor guiding the difference in the behavior of ccRCC.
Introduction
Clear cell renal cell carcinoma (ccRCC) is the most common variant of kidney cancer, accounting for ~80% of total cases. 1 The key oncogenic event appears to be the loss of the Von-Hippel Lindau (VHL) tumor suppressor gene, leading to loss of function of the VHL protein and accumulation of the hypoxia inducible factor α (HIF-α). HIF-α then translocates to the nucleus, and dimerizes with HIF-β, creating a complex that acts as a transcriptional factor for the activation of several genes that promote tumor progression. 2 The central role in the regulation of HIF is mediated by the prolyl hydroxylase domain (PHD) protein family. PHD enzymes (PHD1, PHD2, and PHD3) hydroxylate HIF-α in its oxygen-dependent degradation domain at two pro-line residues (P402 and P564), leading to binding with the VHL suppressor protein and subsequent proteolytic degradation. Under hypoxic conditions, HIF-α is stabilized due to PHD inactivation. 3
Although the relevance of HIF (HIF-1α and HIF-2α) has been extensively studied in ccRCC, the exact role of the PHD has not been yet been fully elucidated. In addition, little is currently known about the hypoxia pathway in other kidney tumors, such as in a large group of benign kidney tumors: the oncocytomas. The aim of the present study was to compare the expression differences in the HIF/PHD pathway in ccRCC and oncocytomas, and investigate any correlation with clinicopathological parameters of patients that underwent surgical kidney tumor removal. This was performed via reverse transcription-quantitative polymerase chain reaction (RT-qPCR) for HIF-1α, HIF-2α, PHD1, PHD2, and PHD3 in fresh frozen tissue samples.
Material and methods
Patients
This prospective study included 70 specimens from patients who had undergone partial or radical nephrectomy for a suspected renal tumor, and their histology confirmed either ccRCC or oncocytoma. All operations were performed in the Department of Urology in Gennimatas General Hospital of Thessaloniki (Thessaloniki, Greece), between December 2010 and October 2012. All patients provided written informed consent for their samples to be used, and the study protocol was approved by the institutional ethics committee of the aforementioned hospital.
Pathological analysis
Only conventional ccRCCs and oncocytomas were considered for analysis (according to the Heidelberg classification system for RCCs). 4 The slides (formalin-fixed paraffin sections, stained with hematoxylin and eosin) were reviewed by two pathologists (VG and VK) and any controversies were resolved by consensus. The tumor characteristics assessed were tumor size and T stage according to the tumor-node-metastasis (TNM) classification, Fuhrman grade of differentiation, and the presence of necrosis and the presence of sarcomatoid elements.4, 5
Tissue sample management
Samples were collected directly during surgery when the specimen of radical or partial nephrectomy was removed. The central part and periphery of the tumor, as well as the adjacent normal kidney tissue were selected under the guidance of the pathologist (distance between the cancerous and non-cancerous tissue at least 0.5cm). These areas were cut into small pieces of 5×5 mm maximum volume then immediately frozen in liquid nitrogen and stored at −80oC.
RNA and cDNA preparation
For isolation of RNA, the frozen tissue samples were homogenized and transferred to a lysis buffer for overnight lysis at 56°C. Each sample was a mixture from the two selected areas of tumor and adjacent normal kidney tissue. After incubation in the proteinase K buffer and subsequent liquid phase extraction, RNA extraction was performed using TRIzol® (Invitrogen; Thermo Fisher Scientific, Inc., Waltham, MA, USA). Then, the concentration and purity of the RNA were assessed via photometry. Complementary (c) DNA was obtained from total RNA via SuperScript® III Reverse Transcriptase (all reagents from Invitrogen), according to the manufacturer’s protocol. 6 Amplification of cDNA was not successful in seven samples due to messenger RNA (mRNA) degradation.
qPCR assay
Samples were processed and run in duplicates in an ABI 7900HT system under default conditions (denaturation: 10 min to 95°C, annealing to 60°C, extension to 72°C), in 384-well plates, using the following (FAM) dye-labelled TaqMan-MGB probes (Applied Biosystems; Thermo Fisher Scientific, Inc.):
HIF1α (Hs00153153_m1; NM_001243084.1; exons 4-5; 76 bp)
HIF2α (Hs01026149_m1; NM_001430.4; exons 7-8; 70 bp)
PHD1 (Hs00363196_m1; NM_053046.3; exons 5-6; 77 bp)
PHD2 (Hs00254392_m1; NM_022051.2; exons 1-2; 70 bp)
PHD3 (Hs00222966_m1; NM_022073.3; exons 3-4; 62 bp)
As an endogenous control and for the normalization of cycle threshold (Ct) values, an assay targeting β-glucuronidase mRNA was used (Hs00939627_m1; NM_000181.3; exons 8-9; 96 bp) (Figure S1). 7
Quantification of mRNA expression
Relative quantification was assessed using the 2-ΔΔCT method by subtracting the Ct value of the target gene (HIF-1α, HIF-2α, PHD1, PHD2, and PHD3) and the endogenous control values of normal kidney samples from the corresponding values of tumor samples. 8 The mathematical process used is summarized in the following formula: 2-ΔΔCT = [(CT Gene of Interest - CT Reference Gene) tumor sample - (CT Gene of Interest - CT Reference Gene) normal tissue sample]. Expression of mRNA levels were analyzed as continuous variables and categorized into tertiles. Cox proportional hazards models were used to estimate hazard ratios and 95% confidence intervals for the lowest tertile of HIF1α, HIF2α, PHD1 expression versus the middle and highest tertiles combined. Similar models were used for the lowest and the middle tertiles versus the highest tertile for PHD2 expression. Accordingly, the distribution of relative mRNA expression values were defined as downregulation (low levels) or upregulation (high levels). Due to the wide distribution of PHD3 mRNA levels, its expression was divided into low expression (lowest tertile), medium expression (middle tertile) and high expression (highest tertile). Samples with endogenous control Ct ⩾36 were excluded. Thus, four additional samples were not eligible for analysis.
Statistical analysis
A test of normality was performed using the Shapiro–Wilk test. Continuous variables are demonstrated as the mean ± SD for clinical parameters and as the median with interquartile range for relative mRNA expression. For categorical variables, frequencies with percents n (%), are used. The non-parametric tests of Mann–Whitney and Kruskal–Wallis were used to compare differences in continuous variables and to identify any correlations between continuous variables. One-way ANOVA analysis (Bonferroni Post Hoc Test) or Fisher’s exact test when indicated, were used to evaluate the association between categorical variables. Statistical analysis was performed using IBM SPSS Statistics Version 25. P<0.05 was considered a statistically significant difference.
Results
Patients and tumor characteristics
The mean age of the patients was 62.50±11.85 years. A total of 56 specimens constituted ccRCC and 14 oncocytoma tumors. The mean tumor size (maximum diameter) was 5.86±2.69 cm. The detailed demographic, clinical, and pathological characteristics of the patients are presented in Table 1.
Demographic, clinical, and pathologic characteristics of patients.
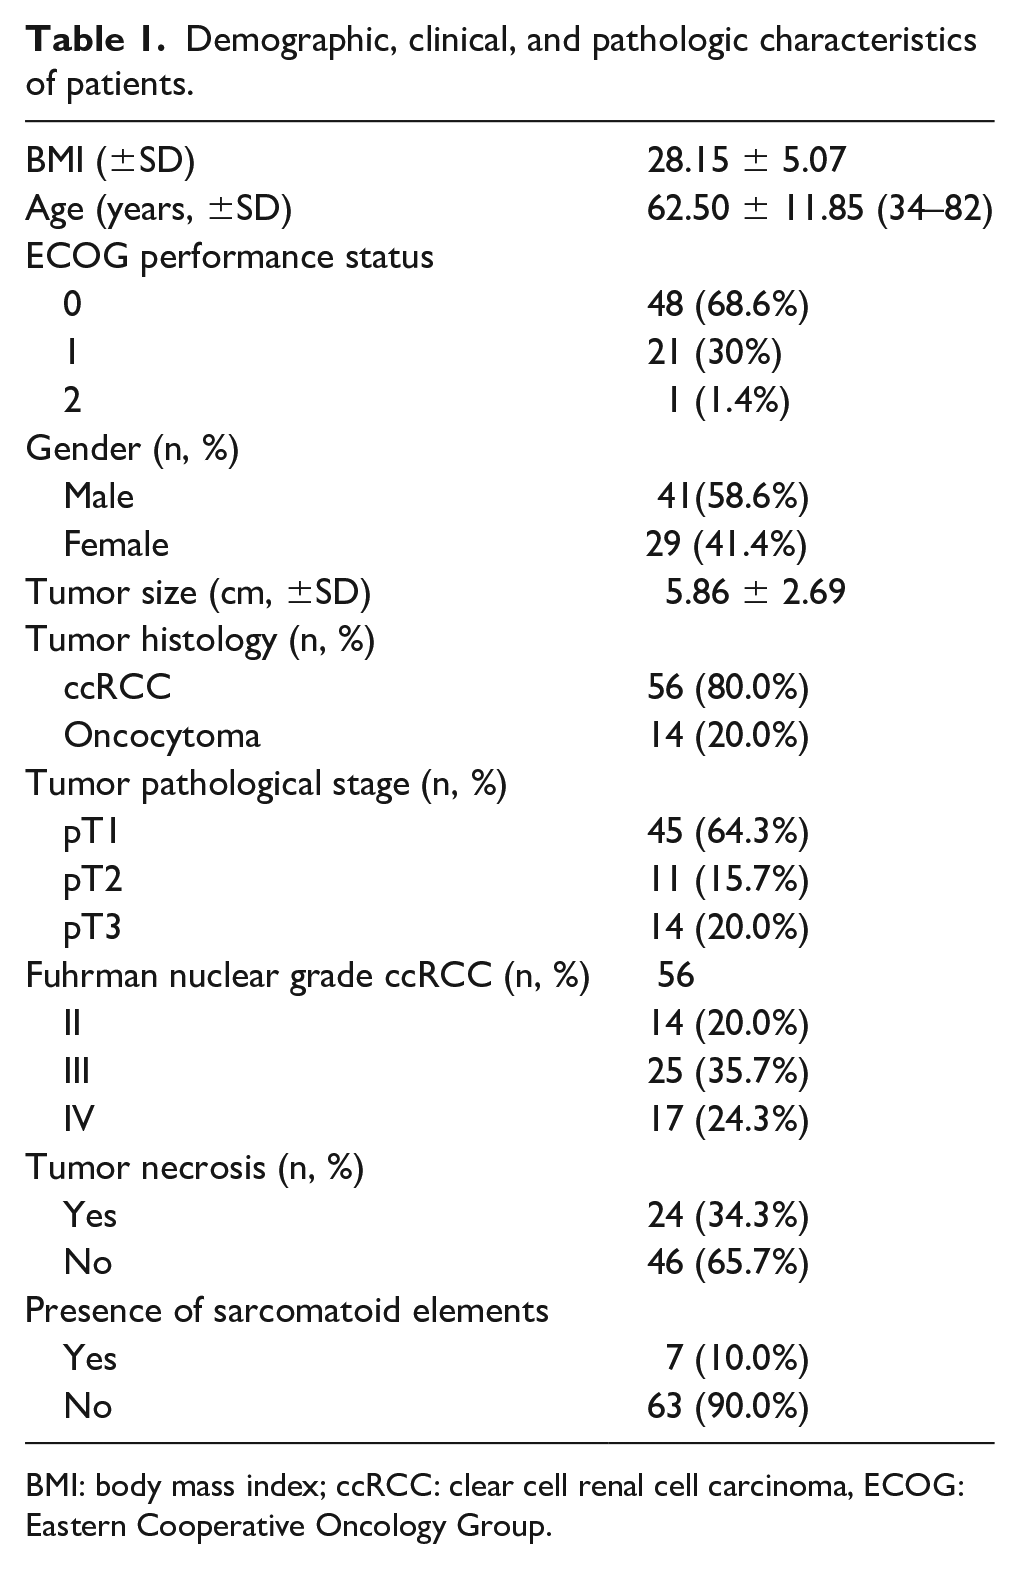
BMI: body mass index; ccRCC: clear cell renal cell carcinoma, ECOG: Eastern Cooperative Oncology Group.
ccRCC
The cumulative results of the RT-qPCR analysis for the relative mRNA expression of the five genes are presented in Table 2. mRNA expression levels of PHD3 exhibited upregulation in 50.0% (26/52) of the samples, with only 15.4% showing downregulation. HIF-1α and HIF-2α levels were upregulated in 65.5 and 71.4% of ccRCC cases, respectively. PHD2 was primarily downregulated in 34 cases (60.7%). There was a statistically significant positive correlation between all the investigated genes in the ccRCC cases (P<0.01). When compared with the clinicopathological parameters, HIF-1α was negatively correlated with body mass index (P=0.013; rs −0.333), and HIF-2α showed a negative correlation with patients’ age (P=0.025; rs −0.299). There was no association between T stage and gene expression. HIF-2α and PHD3 mRNA expression levels were negatively correlated with Fuhrman Grade (P=0.029 and P=0.026, respectively).
Relative mRNA expression levels of interrogated genes in ccRCC and oncocytoma.
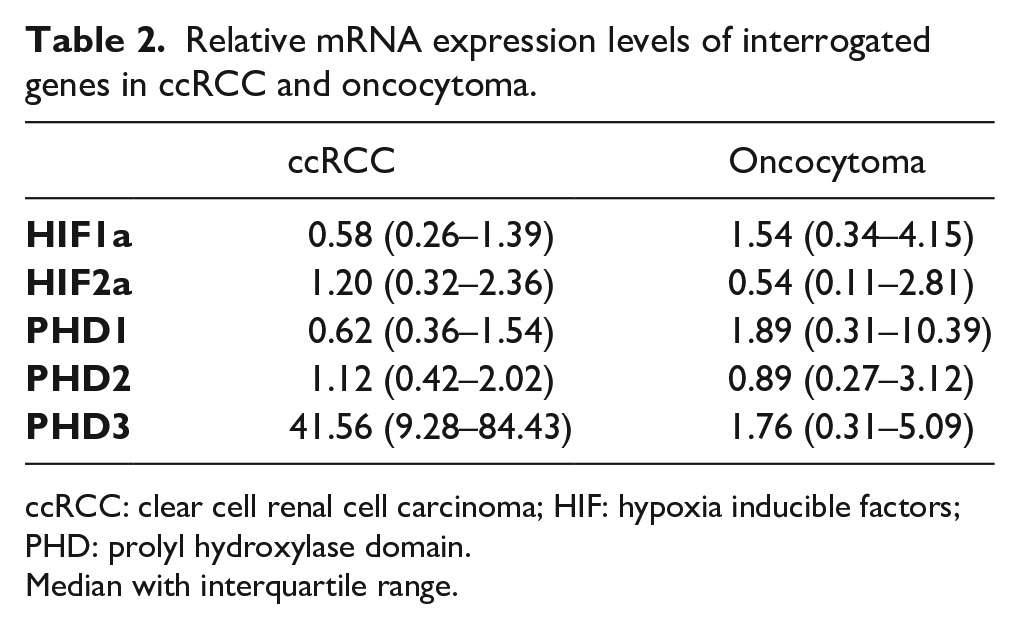
ccRCC: clear cell renal cell carcinoma; HIF: hypoxia inducible factors; PHD: prolyl hydroxylase domain.
Median with interquartile range.
Oncocytomas
Regarding the oncocytoma cases, there was a characteristic expression pattern for PHD3 levels with no case exhibiting upregulation (Table 3). In contrast, 10 cases (71.45%) showed low expression levels, with the remaining 4 cases showing medium expression levels. HIF-1α was expressed at high levels in 11 of the total 14 cases (78.60%) and PHD1 in 10 of the14 cases. HIF-2α and PHD2 showed an equal distribution between upregulation and downregulation. HIF-1α was positively correlated with HIF-2α (P<0.001), PHD1 (P<0.001), PHD2 (P<0.001), and PHD3 (P=0.006). Other genes were also positively correlated, apart from PHD1 with PHD3 (P=0.069). No correlation was observed between mRNA expression of genes and clinical or pathological parameters in oncocytoma cases.
mRNA expression category (downregulation or upregulation for HIF-1a, HIF-2a, PHD1, PHD2, and low or medium or high expression for PHD3) per oncocytoma case.
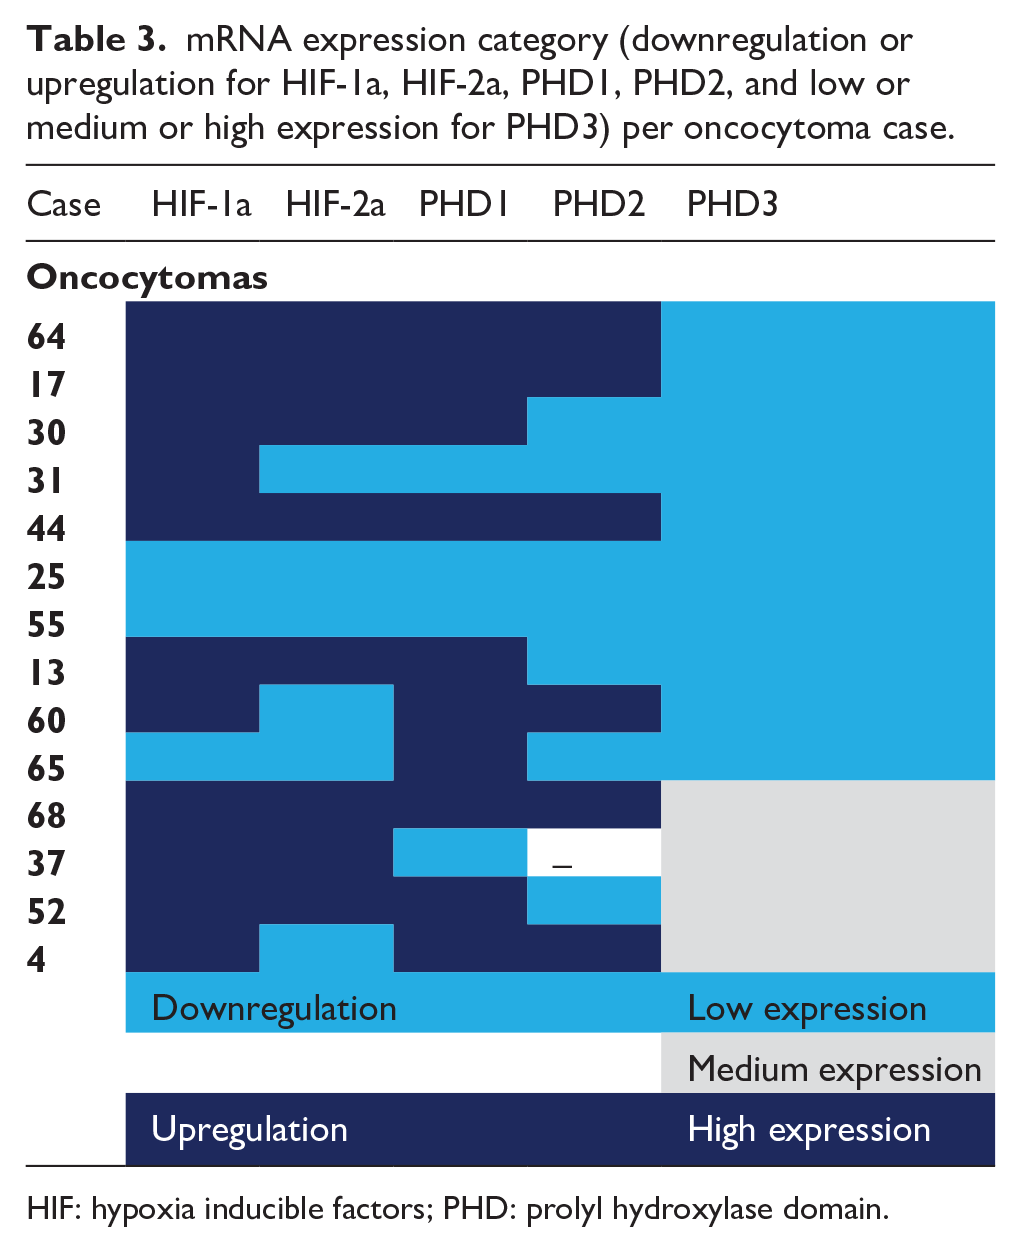
HIF: hypoxia inducible factors; PHD: prolyl hydroxylase domain.
PHD3 mRNA expression is downregulated in oncocytomas in comparison with ccRCC
Relative mRNA expression levels for the five interrogated genes for both ccRCC and oncocytoma cases is presented in Figure 1. There was no difference in the expression levels for HIF-1α, HIF-2α, PHD1, and PHD2. In comparison with oncocytoma cases, PHD3 mRNA levels were significantly upregulated (P<0.001) in ccRCC. As aforementioned, the majority of oncocytoma cases showed a low expression of PHD3, with only 15.4% of ccRCC cases showing a similar expression pattern.
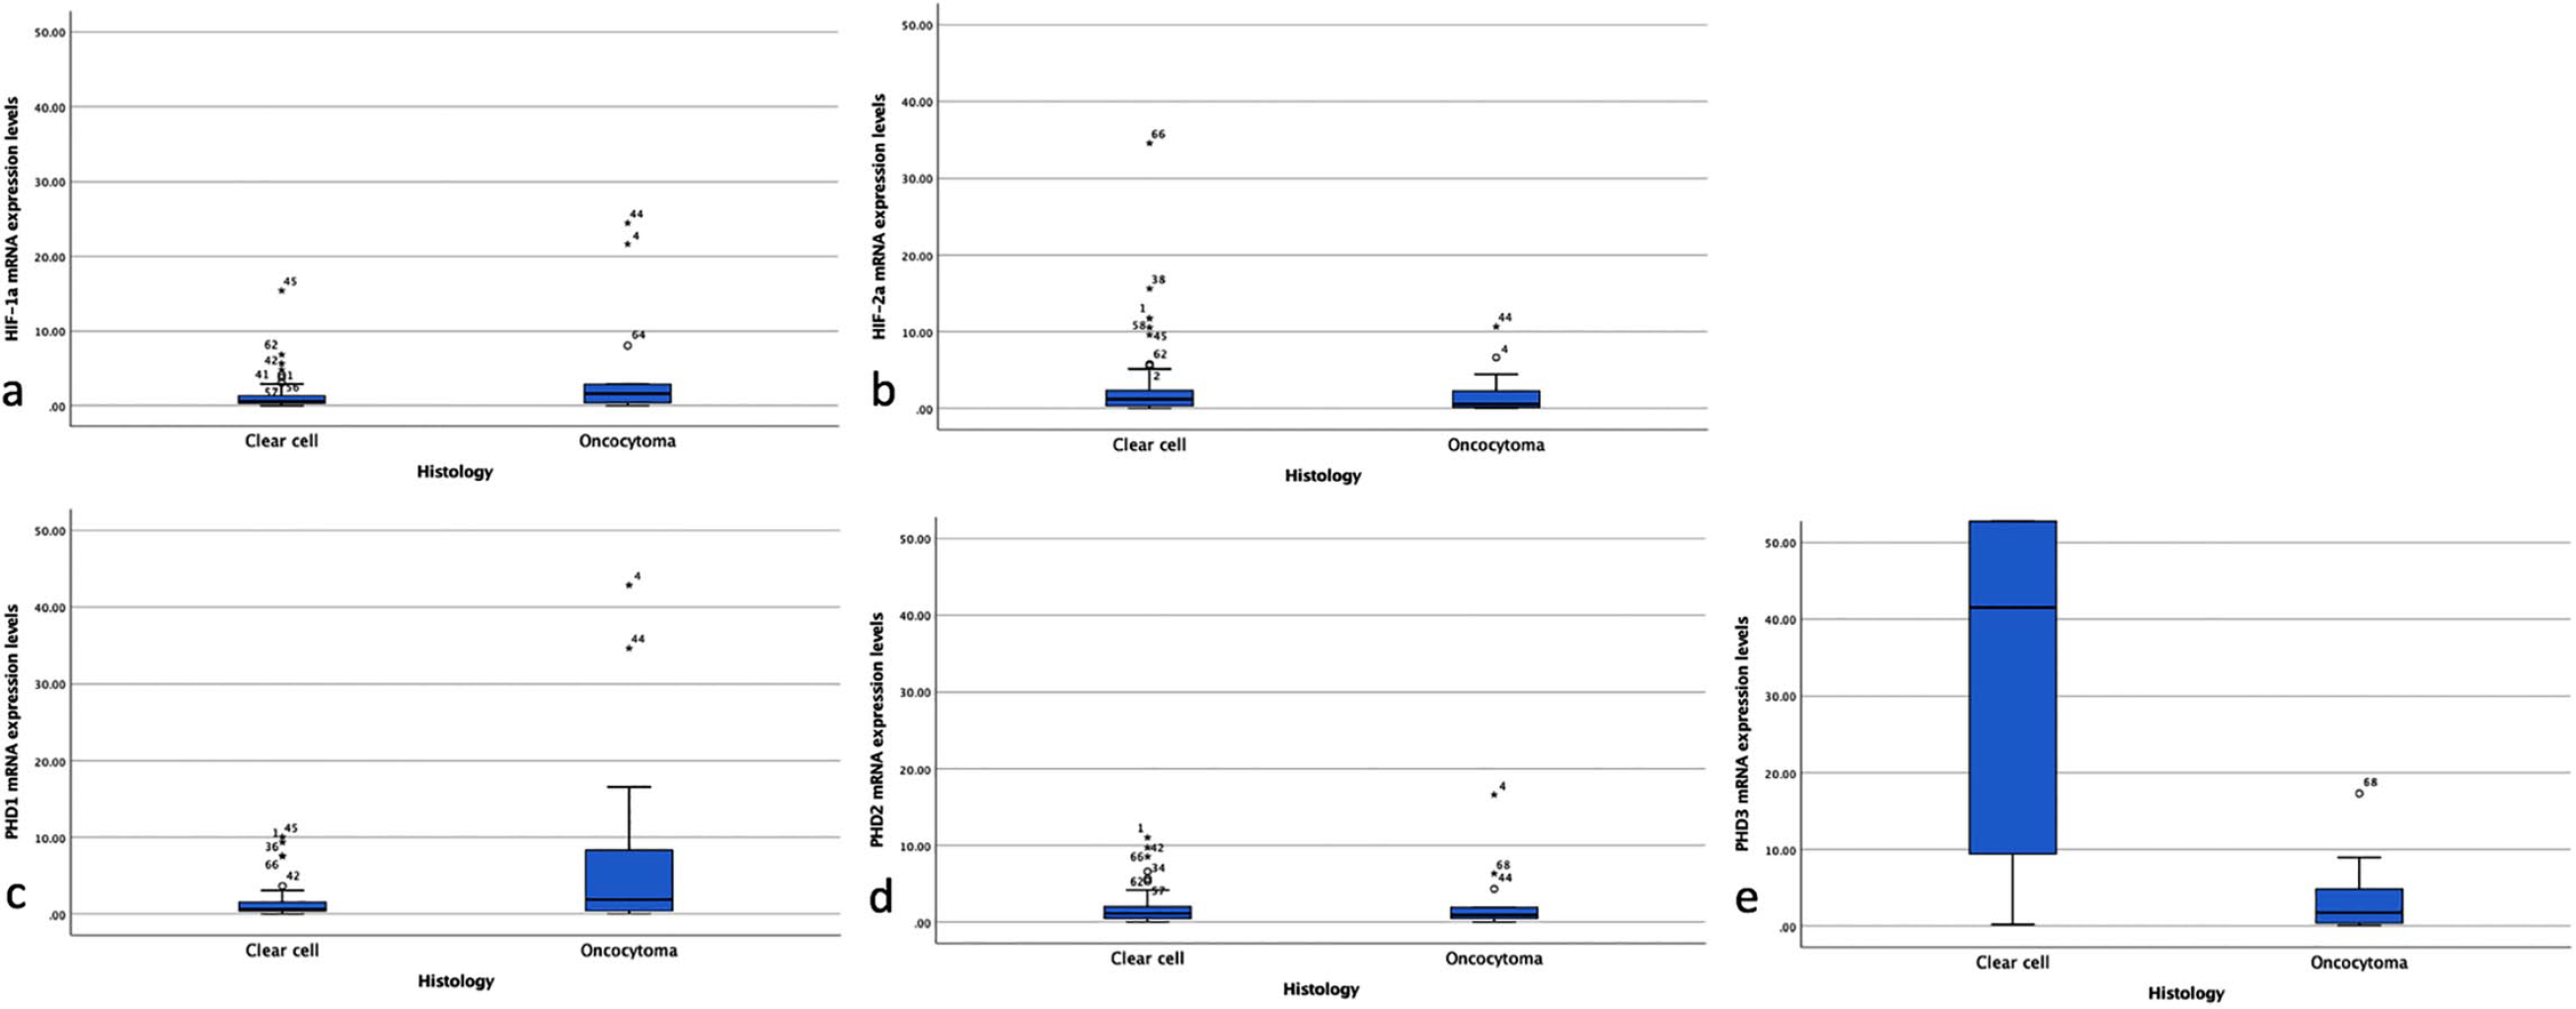
Relative mRNA expression levels for the five interrogated genes for both ccRCC and oncocytoma cases.
Discussion
The most frequent, malignant kidney tumor is renal cell carcinoma (RCC). It has three main subtypes, the ccRCC, accounting for 65%–70% of all RCCs, the papillary RCC, and the chromophobe RCC (chRCC). 9 Among the benign tumors, the most common is renal oncocytoma, consisting of a particular type of cells—the oncocytes—which are epithelial cells with an abundance of mitochondria in their cytoplasm. 10 Oncocytomas represent 5%–15% of surgically resected renal neoplasms. 11
It is well known that imaging characteristics alone are inadequate to differentiate between oncocytoma and RCC. 12 Furthermore, with the increasing accidental diagnosis of small renal tumors, series after partial nephrectomy show that up to 20% of small renal tumors less than 4 cm could represent benign lesions, and a more conservative approach should be implemented. 13 However, fine-needle aspiration or core biopsy is compromised by high rates of false-negative results and no diagnostic specimens, given the difficulty in differentiating specific renal tumor subtypes. Particularly in tumors composed of cells with granular eosinophilic cytoplasm, such as the oncocytoma, the eosinophilic variant of chRCC and the eosinophilic variant of ccRCC, the differential diagnosis can be even more challenging.14, 15 A recent systematic review of available studies showed that the positive predictive value (PPV) of renal mass biopsy is 67%, which confirmed the aforementioned issue and revealed the need for constant research in order to identify new immunohistochemical markers, more sensitive imaging techniques, and potential molecular methods that will increase the PPV of renal biopsies. 10
With regards molecular pathways, the HIF pathway has been previously widely studied in ccRCC.16-18 Apart from the known impact of genetic mutations of VHL, HIF-2α appears to play a more relevant role than HIF-1α in the development and progression of the tumor. With regard to HIF-2α, a large number of investigations have been initiated with a focus on identifying molecule inhibitors targeting this subunit. Early data showing promising results on blocking the sequence of tumor progression have been demonstrated both at the pre-clinical and clinical levels. 19 Furthermore, our team has shown that HIF-2α immunohistochemistry expression adds further prognostic value for the survival of patients with ccRCC. 20 In the present study, HIF-2α mRNA levels in fresh frozen renal cancerous tissue compared with fresh frozen adjacent normal kidney tissue was inversely associated with Fuhrman grade. This confirms findings by Sandlung et al., who demonstrated that HIF-2α mRNA levels were inversely correlated with both Fuhrman grade and TNM stage in ccRCC. 19
In addition to HIF-2α, PHD3 involvement in ccRCC progression is gaining an increasing level of interest. 18 Under normoxic conditions in the majority of cell types, HIF-PHD3 downregulates HIF-2α. However, Miikulainen et al. 21 recently demonstrated that, in contrast to this known negative feedback, PHD3 upregulation in ccRCC maintains high HIF-2 expression, as well as expression of its target genes, enhancing kidney cancer progression. This association was obvious from the findings in the present study. In addition, PHD3 mRNA expression was negatively correlated with Fuhrman grade.
Despite the fact that there are numerous studies investigating the role of HIF/PHD in RCC, currently there are limited data regarding the oncocytoma. Generally, oncocytic tumors are considered less aggressive than other non-oncocytic neoplasms. They comprise a subset of epithelia-derived peculiar neoplasms, in which the pathogenesis of mitochondria seem to play a major role. Oncocytic tumors have been associated with a high burden of disruptive mutations in mitochondrial DNA (mtDNA)-encoded genes for respiratory chain subunits. This could explain their deranged mitochondrial morphology/structure.
The disruptive mtDNA mutations, observed in oncocytic tumors, induce the degradation of respiratory chain complex I and subsequent oxidization of nicotinamide adenine dinucleotide + hydrogen (NADH), which is a negative regulator of α-ketoglutarate dehydrogenase (α-KGDH), to NAD+. α-KGDH is a positive regulator of PHD activity. The increase in NAD+ levels leads to enhancement of α-KGDH and PHD, and subsequent HIF1-α degradation. Due to constant HIF1-α degradation, oncocytic cells carrying severe mitochondrial dysfunction are unable to express vascularization and glycolytic genes, such as glucose transporter I, lactate dehydrogenase A, and vascular endothelial growth factor. Such inability to withstand high-energy demands induces mitochondrial-defective oncocytic cells to exhibit a low proliferative rate. This mechanism likely explains the inability of oncocytic tumors to trigger other genes and to promote progression to a more malignant status.22, 23 A recent study by Koeman et al. 24 revealed an extensive overexpression of PHD1 in renal oncocytoma cells. This was associated with the dysregulation of numerous hypoxia-inducible genes, including pro-death BNIP3L. This occurred in 10 of the 14 patients with oncocytoma in the present study. In contrast, although HIF-1α was positively correlated with PHDs, the present study did not identify a significant downregulation of HIF-1α in the mRNA level.
The results of the present study once again reveal that PHD3 seems to play a central role in the carcinogenesis of ccRCC. When the expression of the five interrogated genes (HIF-1α, HIF-2α, PHD1, PHD2, and PHD3) was compared between oncocytomas and ccRCC, only PHD3 was found to be significantly upregulated in ccRCC. To the best of our knowledge, this is the first time that the HIF/PHD pathway has been compared between ccRCC and a common benign tumor, identifying the upregulation of PHD3 as the possible underlying difference in the behavior of ccRCC. In addition to the HIF-dependent role in PHD, recent research highlights the additional functions of the PHD family in an HIF-independent manner. PHD has been reported to control cellular metabolism (glycolysis and mitochondrial function), apoptosis, cell proliferation, gene expression, erythropoiesis, immune response, and protein synthesis through different signaling pathways. 3 However, until recently, the role and significance of the three different splicing isoforms of PHD was not fully understood. In ccRCC, PHD3 had been found to play the most important role in carcinogenesis and tumor progression and this was confirmed by the results in the present study.21, 25
This study had some limitations. As noted previously, there are several similarities between oncocytoma, chRCC and the eosinophilic variant of ccRCC. It would be useful to compare PHD3 expression between these entities, possibly offering additional data for differential diagnoses. However, the pool of patients in the present study included only four with chRCC, and any comparison could not draw safe conclusions. Furthermore, the small number of patients represents another limitation. However, given the relatively low incidence of these tumors in the population, the authors feel that the prospective nature of the present study, alongside the advanced methods of RT-qPCR used for the fresh frozen tissues, may compensate for safe and reliable conclusions.
Conclusions
PHD3 mRNA expression levels were demonstrated to be significantly decreased in oncocytomas when compared with ccRCC, in contrast to HIF-1α, HIF-2α, PHD1, and PHD2. These results confirm that PHD3 plays a central role in ccRCC and may reveal the different mechanisms of tumorigenesis. This could lead to promising research for identifying novel therapeutic approaches that target this specific isoform.
Supplemental Material
Supplementary_Figure_1 – Supplemental material for Decreased prolyl hydroxylase 3 mRNA expression in oncocytomas compared with clear cell renal cell carcinoma
Supplemental material, Supplementary_Figure_1 for Decreased prolyl hydroxylase 3 mRNA expression in oncocytomas compared with clear cell renal cell carcinoma by Spyridon Kampantais, Ilias Kounatidis, Vasiliki Kotoula, Ioannis Vakalopoulos, Konstantinos Gkagkalidis and Georgios Dimitriadis in The International Journal of Biological Markers
Footnotes
Acknowledgements
The authors would like to thank Mr. Victoras Gourvas (Private Pathology Lab “Victoras Gourvas”, Thessaloniki 54624, Greece) for providing support in histopathology analysis of specimens.
Declaration of conflicting interests
The author(s) declared no potential conflicts of interest with respect to the research, authorship, and/or publication of this article.
Funding
The author(s) disclosed receipt of the following financial support for the research, authorship, and/or publication of this article: The study was supported by the Hellenic Urological Association.
Supplemental material
Supplemental material for this article is available online.
References
Supplementary Material
Please find the following supplemental material available below.
For Open Access articles published under a Creative Commons License, all supplemental material carries the same license as the article it is associated with.
For non-Open Access articles published, all supplemental material carries a non-exclusive license, and permission requests for re-use of supplemental material or any part of supplemental material shall be sent directly to the copyright owner as specified in the copyright notice associated with the article.