
Abstract
Introduction:
Uveal melanoma is one of the most common primary intraocular malignant tumors with poor prognosis and limited treatments. Programmed cell death receptor-1 (PD-1) blockade represents the primary treatment strategy of immune checkpoint inhibition; however, there is a lack of studies on whether PD-1 expression in primary (ocular) uveal melanoma affects tumor progression.
Methods:
PD-1 expression in 82 cases of primary (ocular) uveal melanoma was detected by immunohistochemistry. The clinical significance of PD-1 expression was evaluated using univariate and multivariate analysis. PD-1 overexpression and knockdown studies were conducted in C918 and Mum-2B cell lines to analyze the effect of PD-1 expression on tumor cell proliferation and intracellular cell signaling transduction. real-time qPCR (RT-qPCR) and western blot analysis were performed to investigate the gene expression level. CCK8 assays were performed to examine the cell proliferation ability.
Results:
High expression of primary (ocular) intratumor PD-1 was associated with poor patient survival. Moreover, PD-1 expression was correlated with the largest tumor diameter. PD-1 expression and optic nerve invasion were independent prognostic risk factors. PD-1 overexpression in uveal melanoma cell lines promoted tumor cell proliferation, while knockdown of PD-1 inhibited cell proliferation capacity.
Conclusion:
Our study established the role of PD-1 in the progression of uveal melanoma and provided a new potential treatment selection for uveal melanoma.
Introduction
Uveal melanoma (UM) is one of the most common primary intraocular malignant tumors in adults.1, 2 It is derived from uveal melanocytes and characterized as high potency of proliferation and metastasis. Metastasis of UM is usually occult, and micrometastasis occurs in the early stage of the tumor and is very difficult to detect on the imaging system. 3 The 5-year mortality rate of UM was about 17%.4, 5 The leading cause of death was liver metastasis, and most of the patients die within a few months after the confirmation of tumor metastasis. 6 A series of proteins, including TGF beta, EGFR, cyclin D1, bcl22, MMP2, and MMP9, were identified as closely related to tumor infiltration, metastasis, and poor prognosis of UM.7-10 However, to date, few of these markers have transferred into treatment targets, and a regime of less treatment has been developed for UM.
Immune checkpoint inhibitor (ICI) treatment has been recently identified as the most promising treatment for several malignant tumors, including lung cancer, 11 liver cancer, 12 and cutaneous melanoma. 13 Programmed cell death receptor-1 (PD-1) blockade is one of the most popular ICI strategies, and several PD-1 blockade antibodies have been approved by the US Food and Drug Administration (FDA) for the treatment of malignant tumors. The FDA approved nivolumab (a) for the treatment of advanced melanoma in 2014; (b) for the treatment of advanced squamous cell non-small cell lung cancer and renal cell carcinoma in 2015; and (iii) as a second-line drug for the treatment of advanced liver cancer in 2017. The FDA has also approved pembrolizumab for (a) the treatment of advanced melanoma in 2014; and (b) the first-line treatment of advanced gastric cancer in 2017.
PD-1 is initially identified as a cell membrane receptor for programmed cell death-ligand 1 (PD-L1; B7-H1 or CD274) and PD-L2 (B7-DC or CD273). PD-1 is expressed on T cells and regulates downstream signals of T cell receptor stimulation, resulting in reduced activation of T cell and cytokine production and dampened tumor-killing ability.14-16 Macrophages, natural killer cells and B cells also express PD-1, thereby leading to the restriction of their effector functions.17-21 However, recent reports revealed that PD-1 can also express on tumor cells and promote tumor growth even in the absence of an immune environment. 22 As ICI therapy did not reach a satisfying outcome in UM, a detailed study of the role of PD-1 in the regulation of UM progression is emergent and indispensable.
To further evaluate the role of PD-1 in the progression of UM, the expression of PD-1 in UM cell lines and clinical tumor tissues were first analyzed. Moreover, the biological function of PD-1 in UM cell lines were further evaluated. The anti-tumor efficacy of mammalian target of rapamycin (mTOR) inhibitors and anti-PD-1 antibody in single agent or in combination in the treatment of UM were also studied. Our results provide evidence for PD-1 signaling in cancer development and emphasize the importance and broad prospects of the PD-1 antibody in cancer therapy.
Materials and methods
Patients
This study was approved by the Ethic Committee of Linyi Central Hospital. Tumor tissues from 82 patients, which were formalin-fixed paraffin-embedded, were chosen from patients who underwent surgical resection from January 2008 to December 2014. An average follow-up time of 82 months was obtained. The tumor samples were confirmed by two senior pathologists. Tumor tissues were made into tumor microarray. One core was sampled from each UM and each core was 1.5 mm in diameter.
Immunohistochemistry staining
Immunohistochemistry (IHC) staining for PD-1 was performed as previously described and according to the manufacturer’s manual (Beyotime).23, 24 Briefly, sections were dried at 70°C for 1 h and deparaffinized by using xylene, and rehydrated by using 100%, 95%, 85%, and 75% alcohols. After rehydration, sections were put into pH 6.0 citrate buffer for microwave antigen retrieval. After antigen retrieval, the samples were blocked with goat serum for 1h at room temperature and incubated with the rabbit anti-human PD-1 antibody at a dilution of 1:250 (Cat. No. ab137132; Abcam) overnight at 4°C. Finally, the specimens were washed with PBS solution and incubated with HRP-conjugated IgG and 3,3′-diaminobenzidine substrates to visualize their immunoreactivities. Expression of PD-1 in the primary tumor (eye) was judged by two experienced pathologists and the H-score method was performed to quantify the expression of PD-1. The H-score method was performed by combining the immunoreaction intensity and proportion of tumor cell staining. The score was calculated according to the following formula: (% cells of 1 + intensity score × 1) + (% cells of 2 + intensity score × 2) + (% cells of 3 + intensity score × 3). Four groups including high (+++), medium (++), low (+), and negative (-) were created based on the histological scores.
Real time quantitative polymerase chain reaction
Total RNA of the cultured cells was isolated by using Trizol reagent (Thermo Fisher Scientific, USA) according to the standard instructions. The total messenger RNA (mRNA) was then reversely transcripted into complementary DNA (cDNA) by using the reverse transcription kit (Takara, Japan). Subsequently, real-time quantitative polymerase chain reaction (RT-qPCR) was conducted by using the SYBR Master Mix (Yeasen, China). Actin was selected as the housekeeping gene, and the presented primers were used:
PD-1-Upward: 5′-AAGGCGCAGATCAAAGAGAGCC-3′
PD-1-Downward: 5′-CAACCACCAGGGTTTGGAACTG-3′
Actin-Upward: 5′-CACCATTGGCAATGAGCGGTTC-3′
Actin-Downward: 5′-AGGTCTTTGCGGATGTCCACGT-3′
Cell culture and transfection
The human UM cell lines, including C918, Mum-2B, and Mum-2C, were purchased from the American Type Culture Collection (ATCC, Rockville, USA). The PD-1-SV40-EGFP-IRES-puromycin lentiviral vectors were constructed by GeneChem Co., Ltd. (Shanghai, China). C918 cells were infected with PD-1 overexpression virus. Mum-2B cells were infected with short hairpin RNA (shRNA) by using Lipofectamine 3000 Reagent according to the manufacturer’s instructions. The human PD-1 shRNA target sequence was 5′-TTGTCTTTCCTAGCGGAAT-3′ and 5′-ATTGTCTTTCCTAGCGGAA-3′.
Cell proliferation assay
CCK8 assay were conducted to evaluate cell proliferation was performed according the manufacture’s manual. Briefly, 100μL transfected cell suspension (3×10³ cells per well) were seeded in 96-well plates and then cultured for indicated time. The medium was discarded and the CCK8 solution was added to each well and incubated with cells for 2 hours at 37°C followed by measuring OD450 nm absorbance with the Bio-rad microplate reader every 24h. For drug treatment proliferation assays, cells were preincubated with the appropriate drug for 24 h. Final concentration of INK128 (Selleck) were 200 nM, anti-human PD-1, and respective isotype control monoclonal antibody (mAb; BioXcell) were used at a final concentration of 50 µg/mL.
Western blotting
Western blotting was performed as previously described.25, 26 Total protein was extracted with RIPA lysis buffer with protease inhibitor from UM cell lines; 30 μg of total protein subjected to western blot were separated using 10% SDS-PAGE and electro-transferred onto polyvinylidene difluoride membranes (Millipore, Billerica, MA, USA). Membranes were blocked with 5% skim milk and then incubated with the primary antibody. The following mAbs were used: anti-PD1(Abcam), anti-eIF4E (CST), anti-phospho-eIF4E (p-eIF4E, at Ser209, CST), anti-ribosomal protein S6 (S6 or RPS6, CST), anti-phospho-ribosomal protein S6 (p-S6 or p-RPS6, at Ser235/236, CST), cyclin D1 (CST), anti-DR4 (CST), and anti-GAPDH(Zsbio).
Fluorescence in situ hybridization analysis
Fluorescence in situ hybridization (FISH) analysis was performed as previously described. 27 Paraffin-embedded tissue microarray (TMA) sections were pretreated by dewaxing with xylene, and permeabilizing with sodium thiocyanate, proteolysis, and denaturation. Dual-color FISH was performed with the following probes: CEP3 (centromere 3) and EGR1 (5q31). Chromosome 5 was used as a control for truncation or cutting artifacts and aneuploidy as it is rarely involved in genetic changes in UM. The concentration of the centromeric probe was 20 ng per slide, whereas for the BAC-clones, 80 to 100 ng per slide was used. After hybridization and washing, the slides were counterstained with 4′,6-diamidino-2-phenylindole and mounted in antifade solution. Cutoff limits were >15% of the nuclei with one signal. One hundred nuclei per point were counted.
Statistical analysis
Statistical analyses were carried out by using the software SPSS version 21.0. The relationship between clinical characteristics and the PD-1 expression were evaluated by Chi-square analysis. Identification of the clinical prognostic factors was conducted according to the Kaplan–Meier method and cox regression analysis. Kaplan–Meier method was used to plot the disease-free survival and overall survival curves of all enrolled patients. Student’s t-test was used to analyze the results of in vitro experiments. P<0.05 was considered statistically significant.
Results
High expression of PD-1 in UM is associated with poor patient prognosis
To analyze the potential role of PD-1 in the carcinogenesis and development of UM, a tissue microarray containing primary tumor (eye) tissues from 82 patients was constructed. IHC analysis was then performed to analyze the expression of PD-1. As shown in Figure 1, expression of PD-1 was mainly on the cell membrane and cytoplasm. We then examined the relationship between PD-1 expression in the primary tumor (eye) and patient prognosis. Judged by two independent senior pathologists, intratumor PD-1 expression was low (Figure 1(a)) in 41 patients and high (Figure 1(b)) in 41 patients. As shown in Figure 2, PD-1 high expression was associated with early recurrence (Figure 1(c)) and poor overall survival (Figure 1(d)). We then analyzed whether expression of PD-1 was associated with any of the basic clinicopathological parameters including age, gender, pathological type, largest tumor diameter, scleral infiltration, optic nerve invasion, and monosomy 3 status. As shown in Table 1, intratumor PD-1 expression was associated with the largest tumor diameter. Univariate and multivariate analysis revealed that high intratumor PD-1 expression, monosomy 3 status, and optic nerve invasion are independent risk factors for patient disease-free survival and overall survival (Table 2).
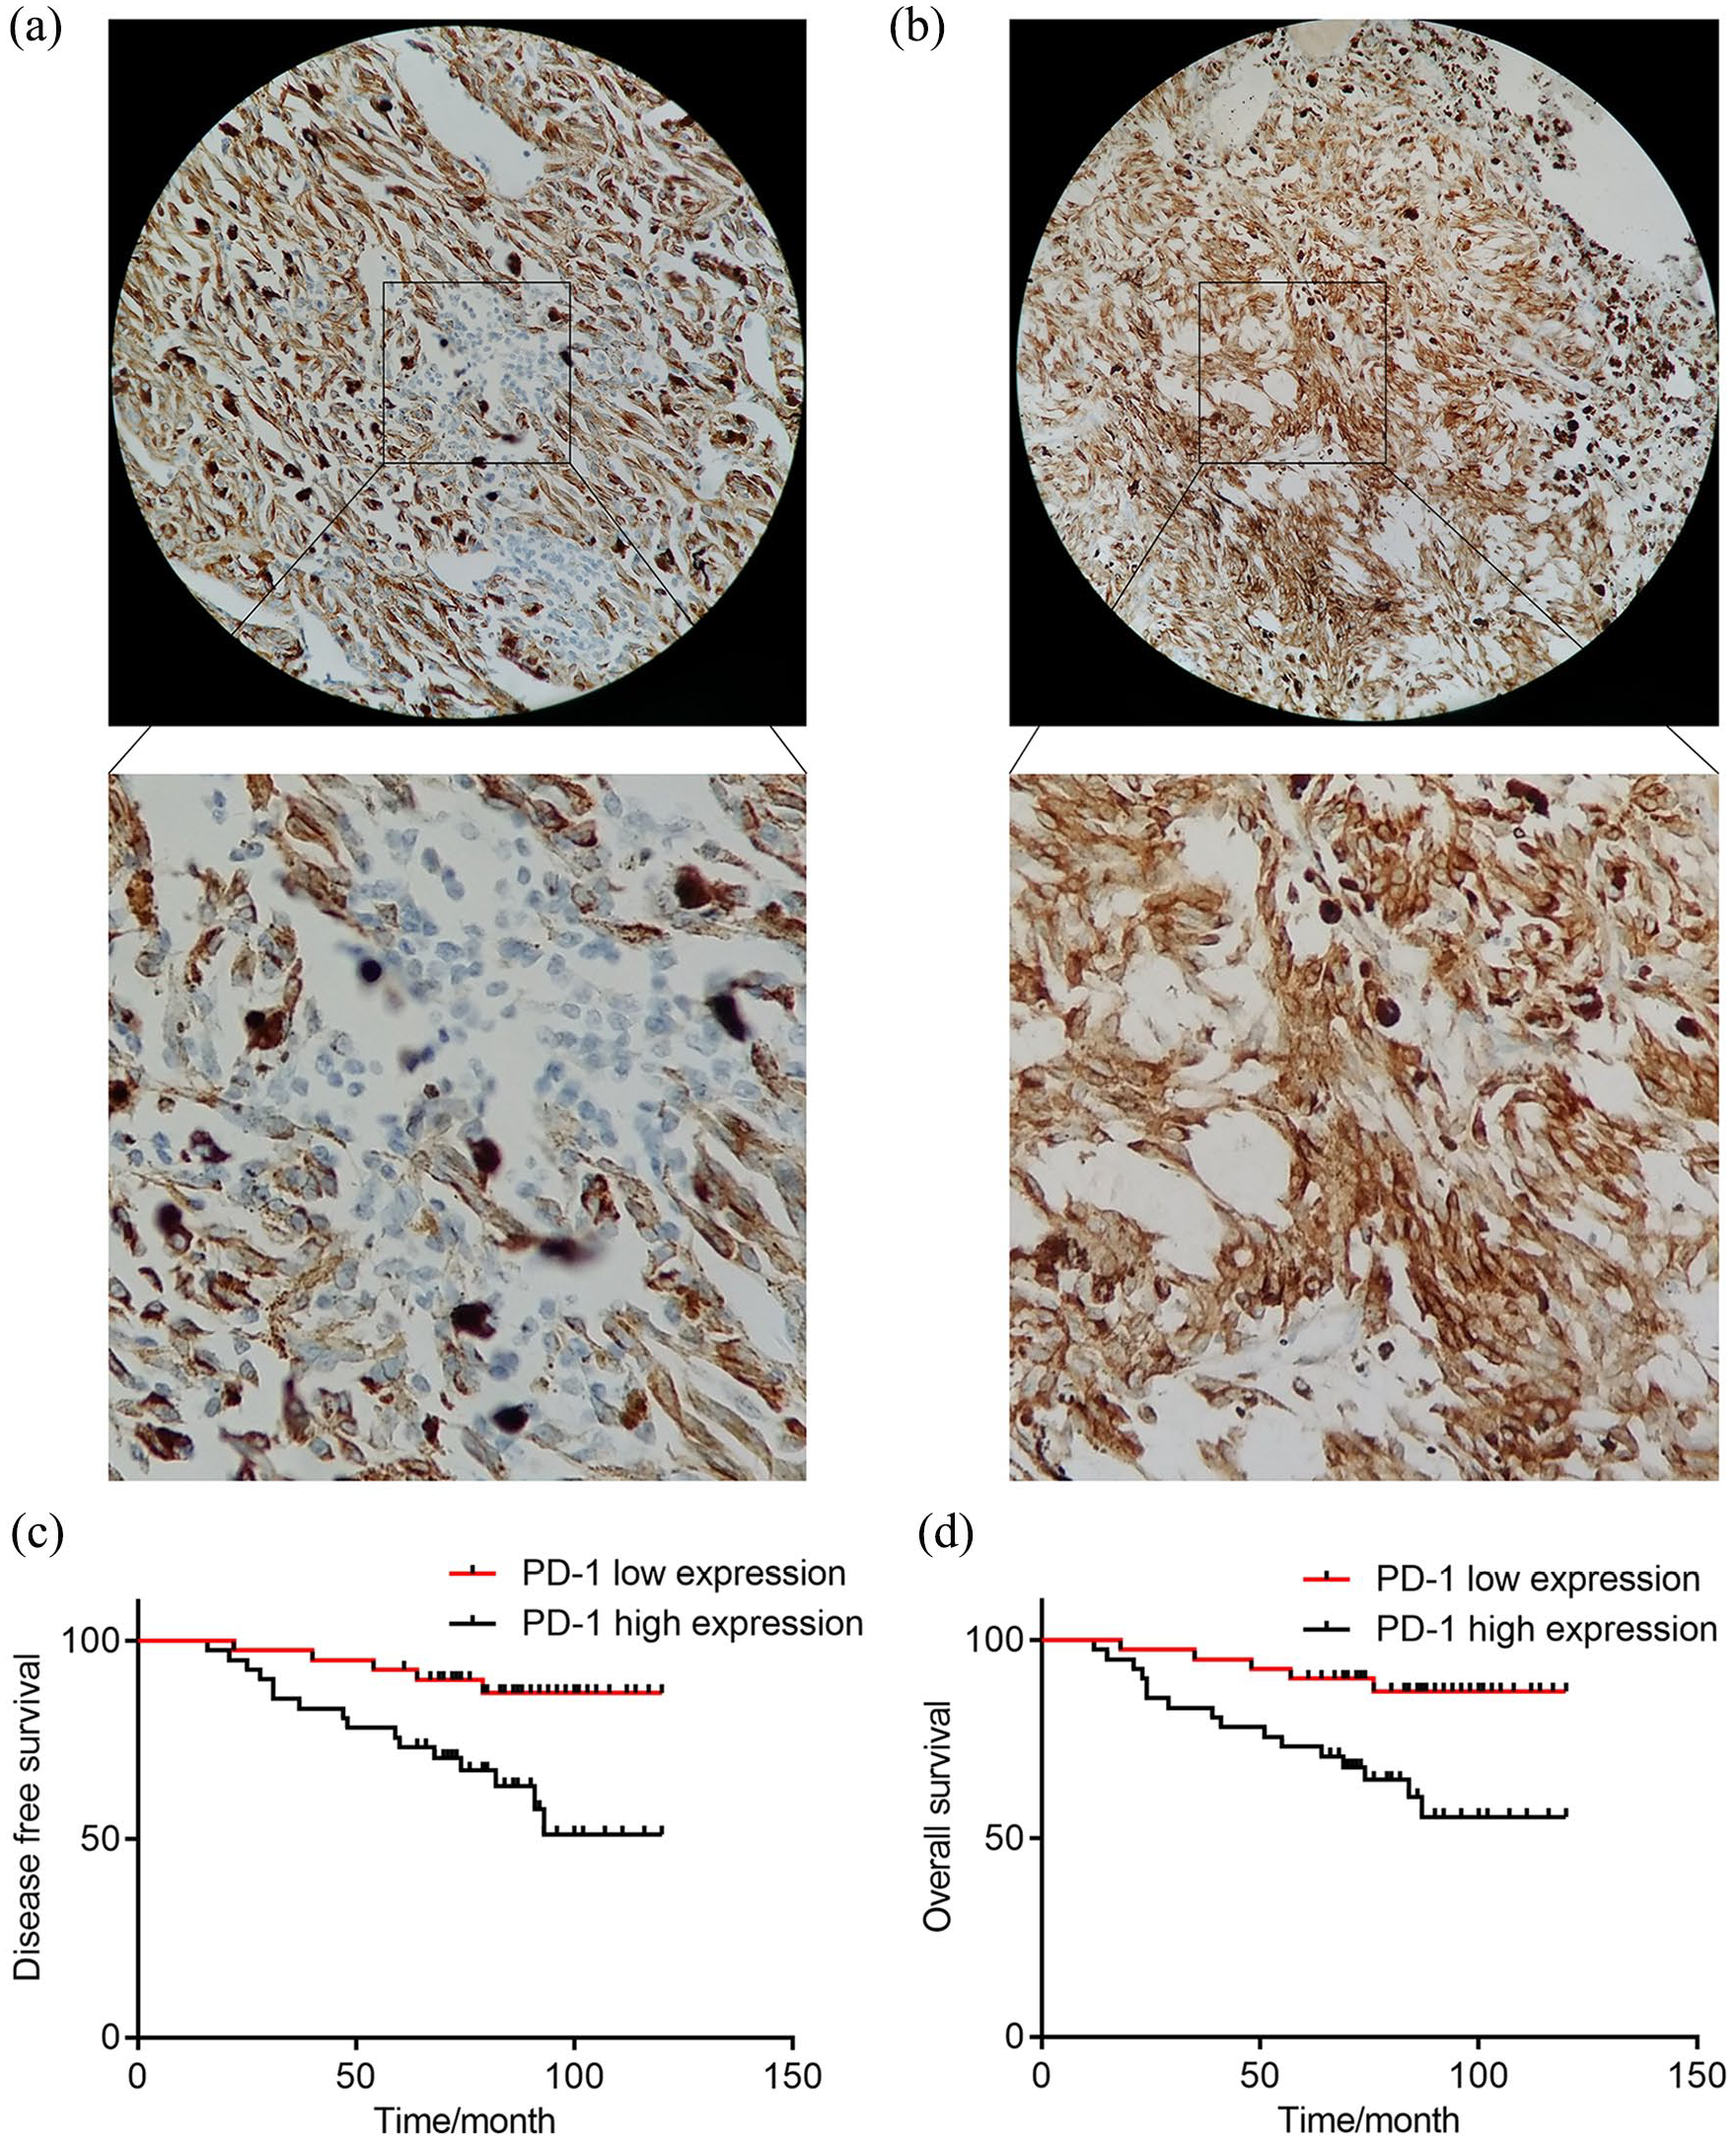
Typical immunohistochemistry staining pictures of the expression of PD-1 in UM tissues and analysis of the relationship between expression PD-1 and the disease-free survival and overall survival of UM patients. (a) Low expression intratumoral PD-1 sections. (b) High expression intratumoral PD-1 sections. (c) The disease-free survival curves were plotted by Kaplan–Meier analysis and assessed by log-rank test, according to PD-1 expression. (d) The overall survival curves were plotted by Kaplan–Meier analysis and assessed by log-rank test, according to PD-1 expression.
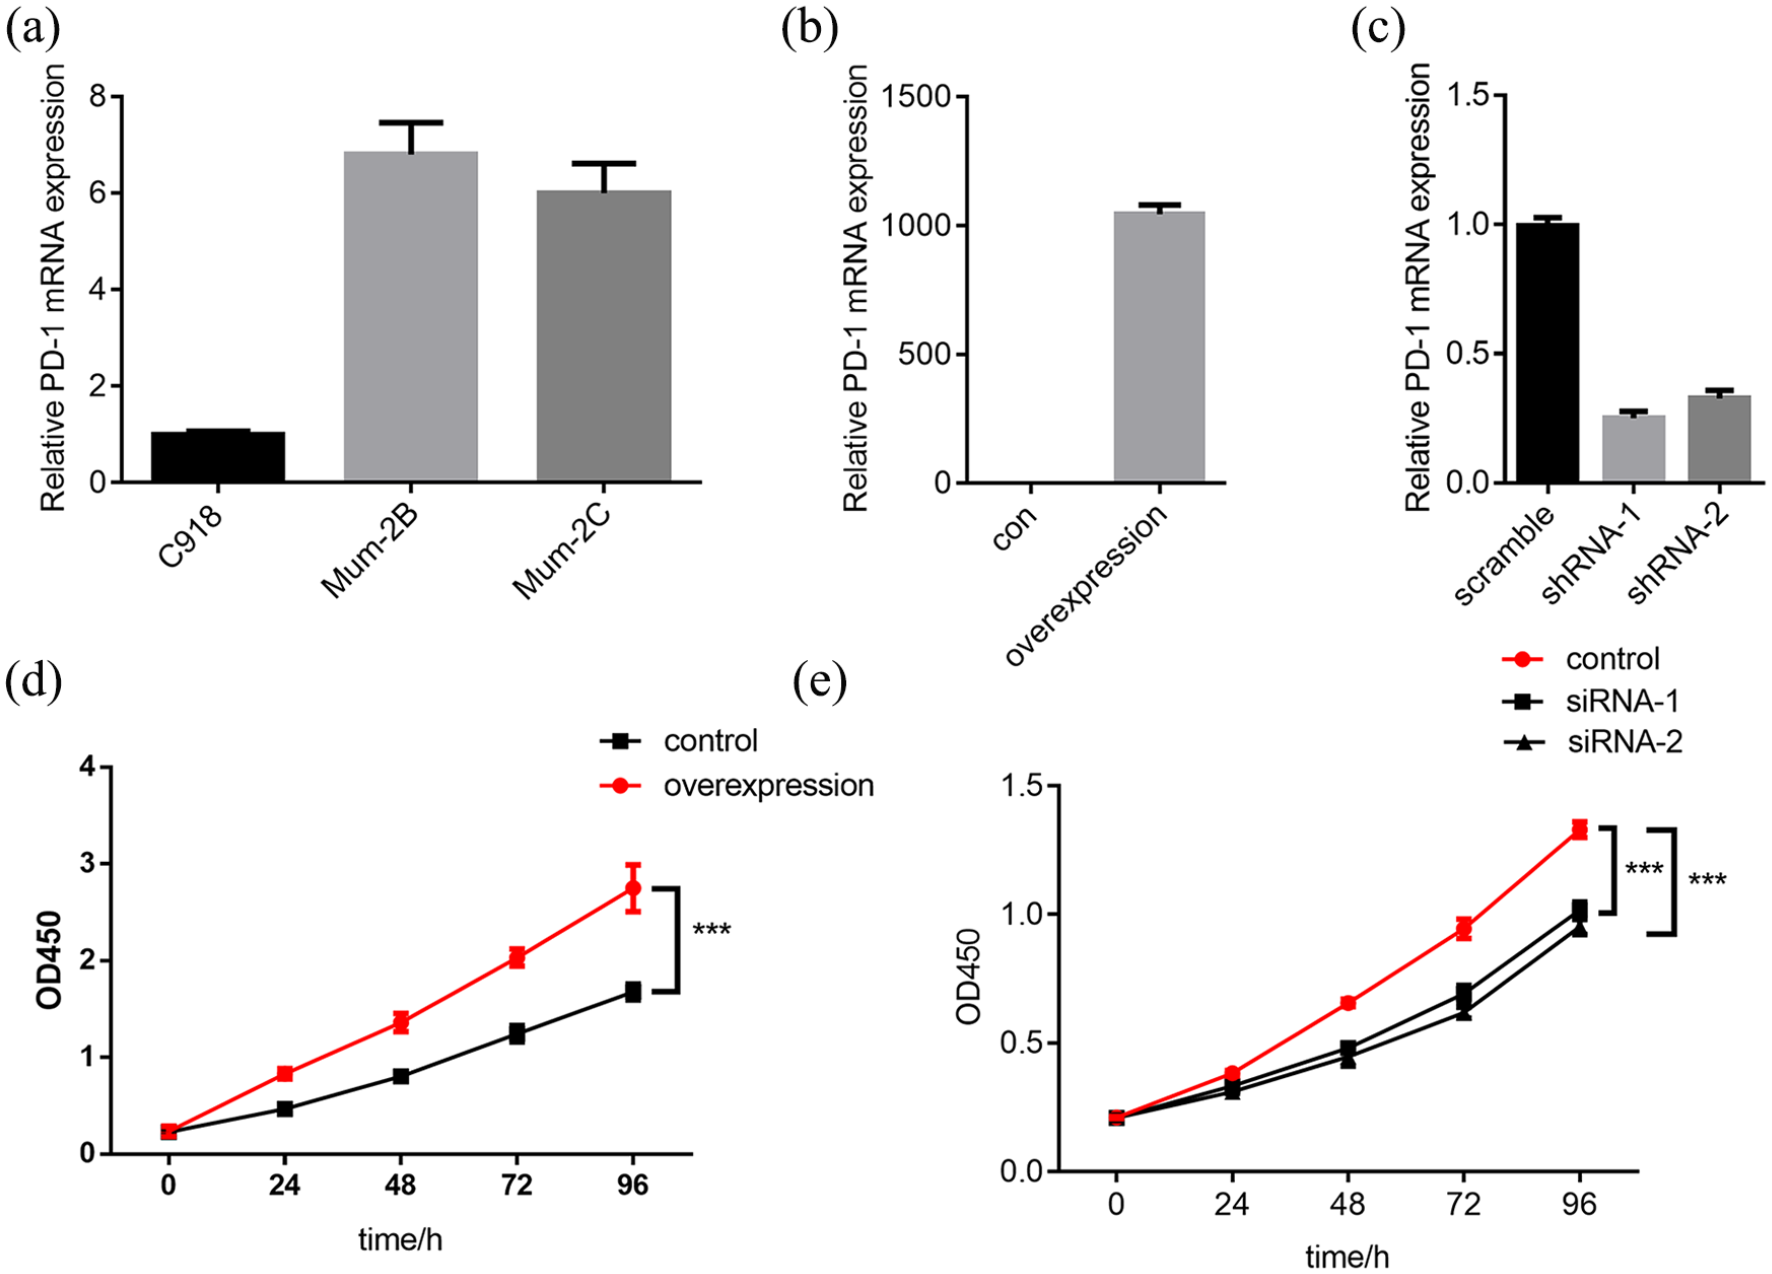
Overexpression of PD-1 promoted the proliferation of UM cell lines while downregulation of PD-1 expression inhibits its proliferation capacity. (a)The mRNA level of PD-1 expression in different UM cell lines was measured by real-time qPCR. (b) Real-time qPCR validation of PD-1 overexpression in the C918 cell line. (c) Real-time qPCR validation of PD-1 downregulation in Mum-2B cell line. (d) Cell proliferation ability was examined in PD-1 overexpressing C918 cells with CCK8 assay (***: P< 0.001). (e) Cell proliferation ability was examined in PD-1 downregulating Mum-2B cells with CCK8 assay (***: P< 0.001).
Relationship between intratumor PD-1 and clinicopathologic features.
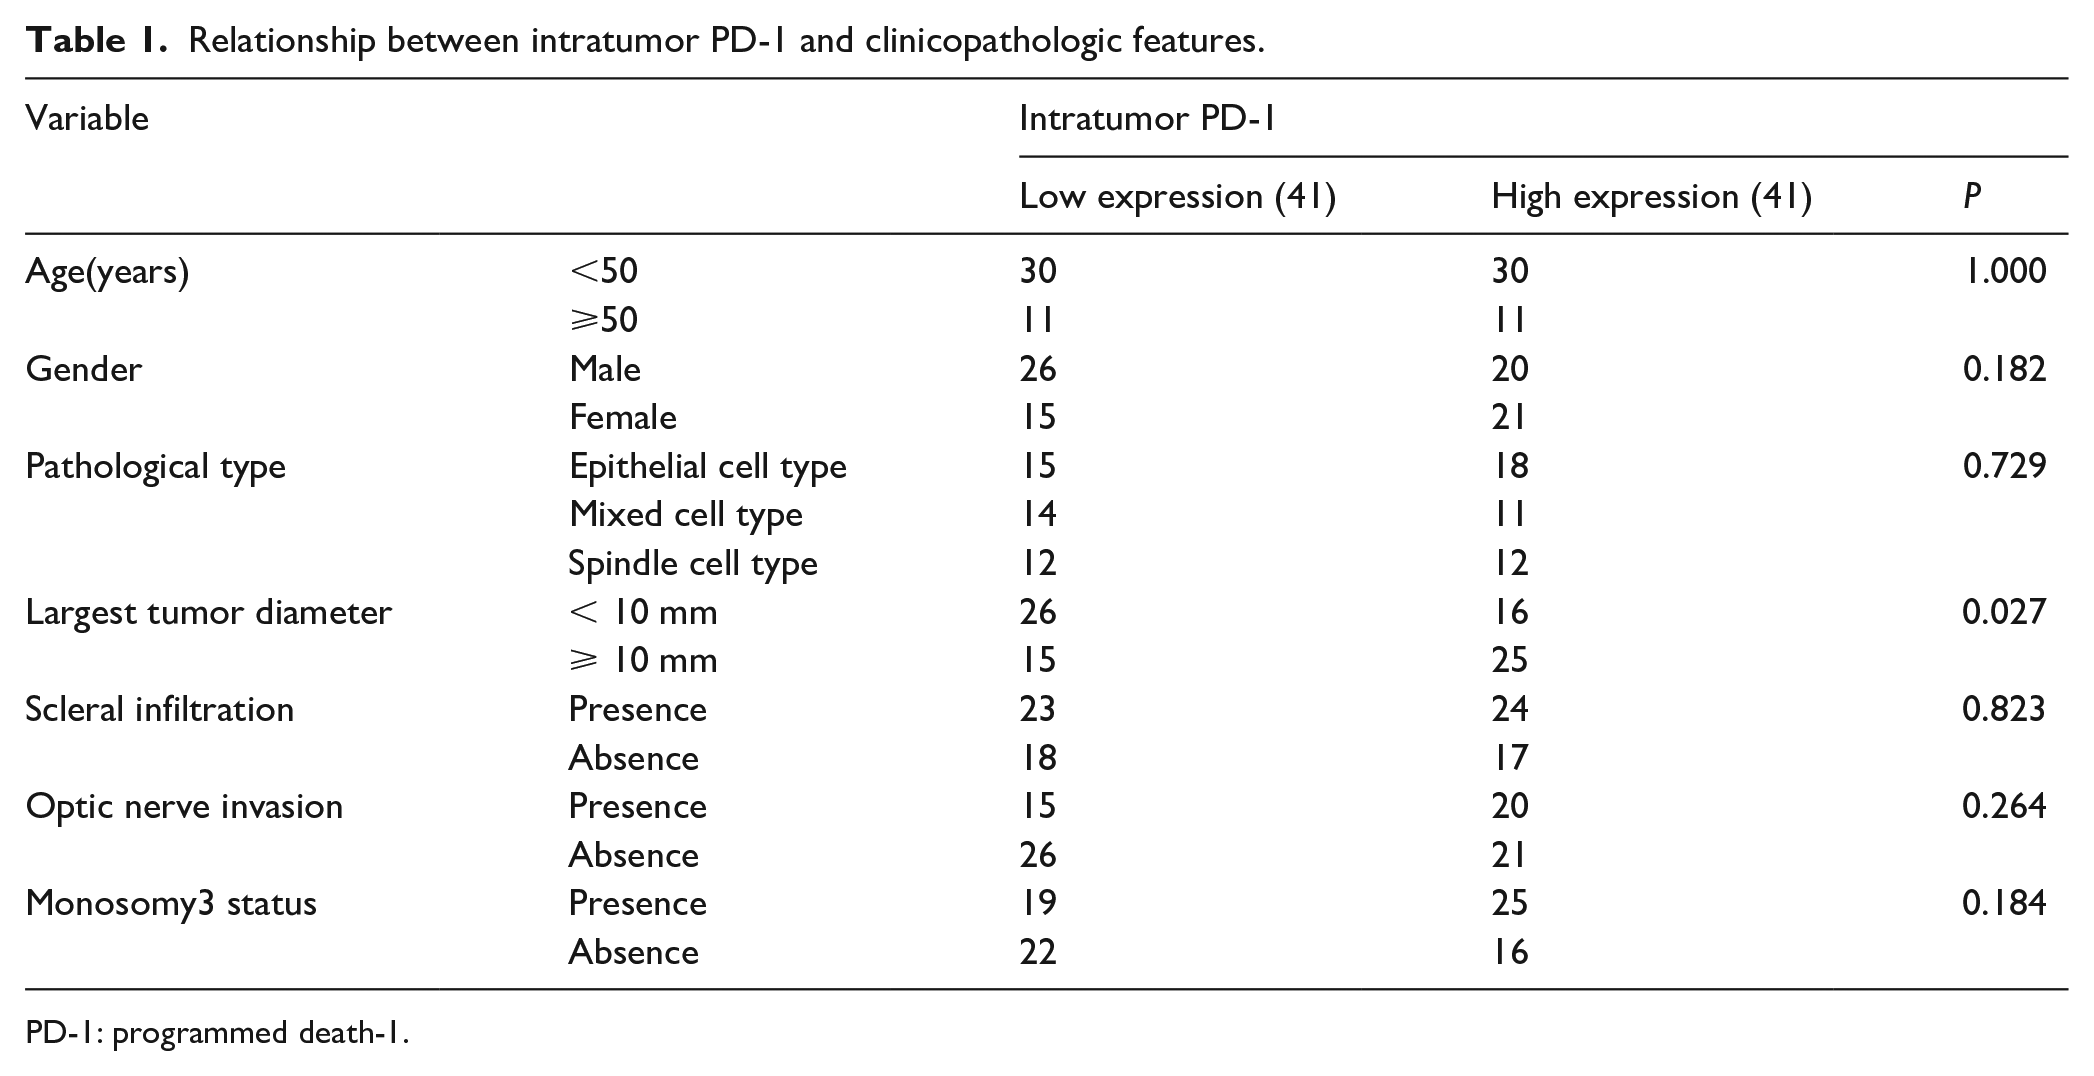
PD-1: programmed death-1.
Univariate and multivariate analysis of factors associated with disease-free survival and overall survival rates of uveal melanoma following surgical resection.
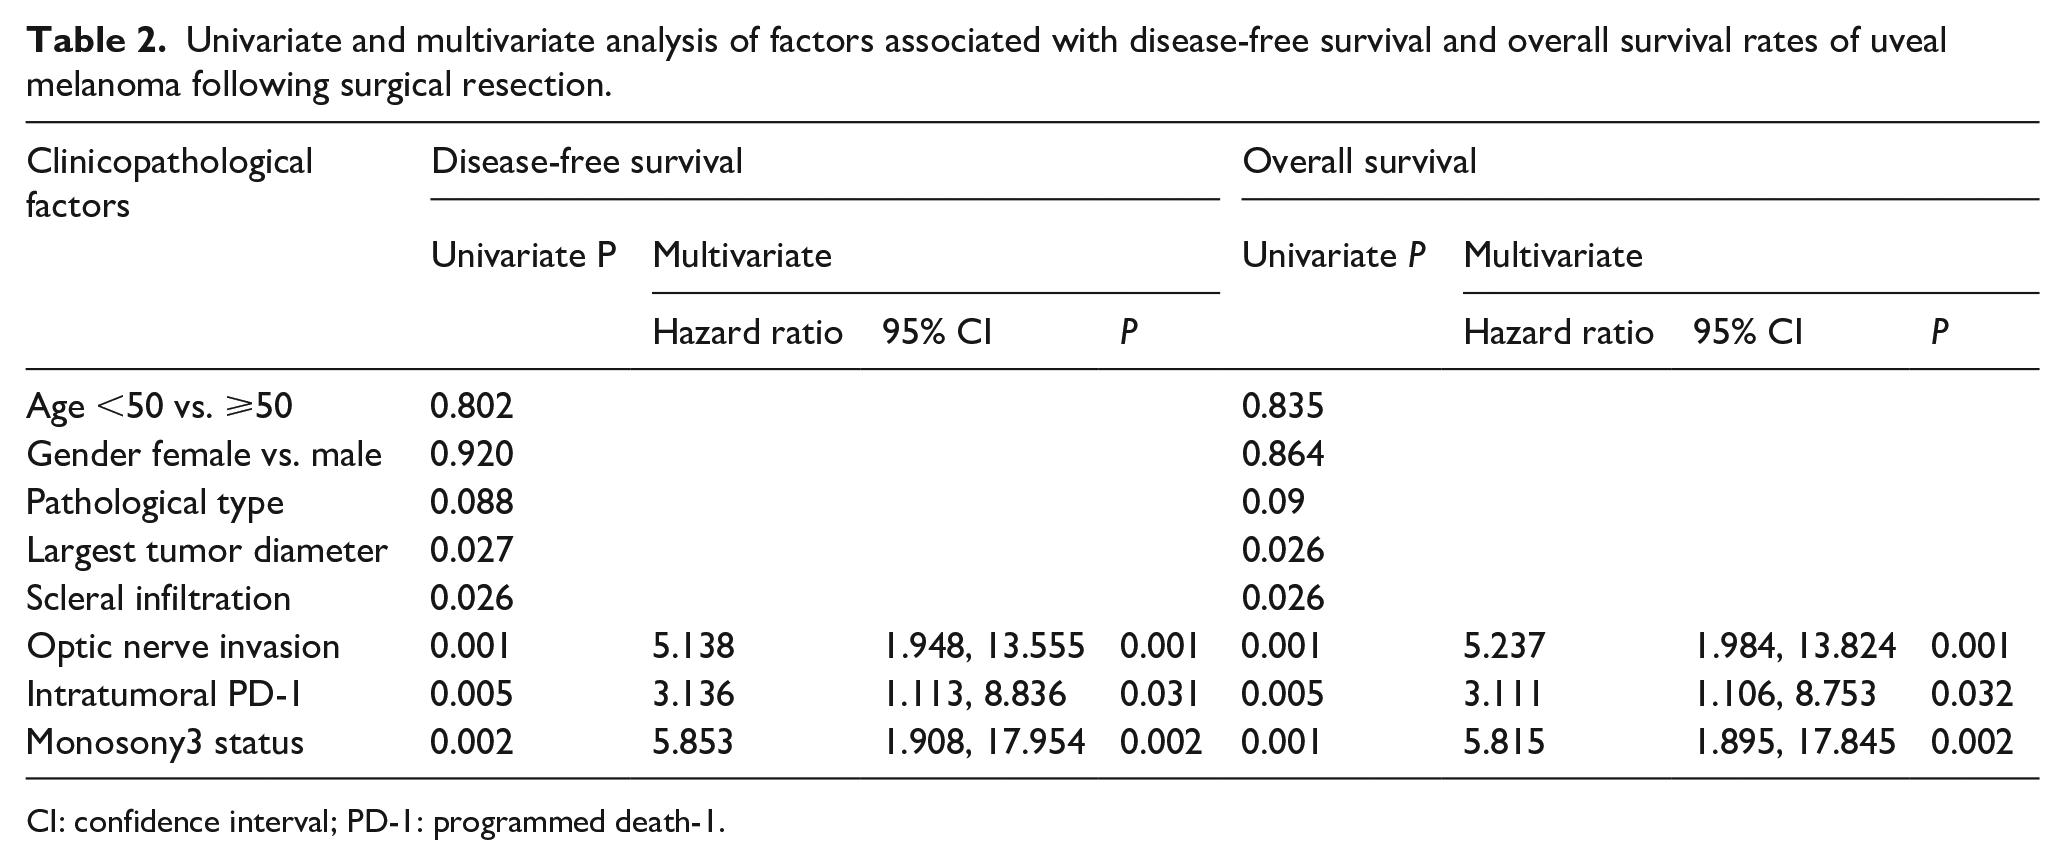
CI: confidence interval; PD-1: programmed death-1.
Overexpression of PD-1 promoted the proliferation of UM cell lines while downregulation of PD-1 expression inhibits its proliferation capacity
To further understand the biological role of PD-1 in the progression of UM, the expression of PD-1 in different UM cell lines including C918, Mum-2B, and Mum-2C were analyzed. As shown in Figure 2(a), PD-1 has a relatively higher expression in Mum-2B cell line and relatively lower expression in C918. Therefore, we overexpressed PD-1 in the C918 cell line and downregulated PD-1 expression in the Mum-2B cell line. The efficacy of overexpression and knockdown was further examined by RT-qPCR (Figure 2(b) and (c)). As PD-1 expression was mainly associated with the largest tumor diameter, we hypothesized that PD-1 might promote the progression of UM by promoting cell proliferation. CCK8 assay was performed in the overexpression cell line and the knockdown cell line to validate this hypothesis. The results revealed that overexpression of PD-1 promoted the proliferation ability of the C918 cell line while knockdown of PD-1 significantly inhibited the proliferation ability of the Mum-2B cell line (Figure 2(d) and (e)).
PD-1 promotes cell proliferation by regulating the effectors downstream mTOR signaling pathway
PD-1 is involved in the regulation of phosphorylation level of effectors downstream of the mTOR signaling pathway, especially by regulating the phosphorylation level of S6 and eIF4E. The phosphorylation level of S6 and eIF4E was analyzed in the C918 cell line overexpressing PD-1. PD-1 overexpression significantly promoted the phosphorylation level of S6 and eIF4E. Also, PD-1 overexpression significantly downregulated the expression of DR4 and promoted the expression of cyclinD1 (Figure 3(a) and (b)). To further confirm whether PD-1 promoted cell proliferation through the mTOR signaling pathway, the mTOR inhibitor INK128 was employed to test whether PD-1 blockade cooperates with mTOR inhibition. As shown in Figure 3(c), individual application of PD-1 antibody or INK128 inhibited the proliferation capacity of the C918 cell line overexpressing PD-1 while the combined treatment showed the most potential.
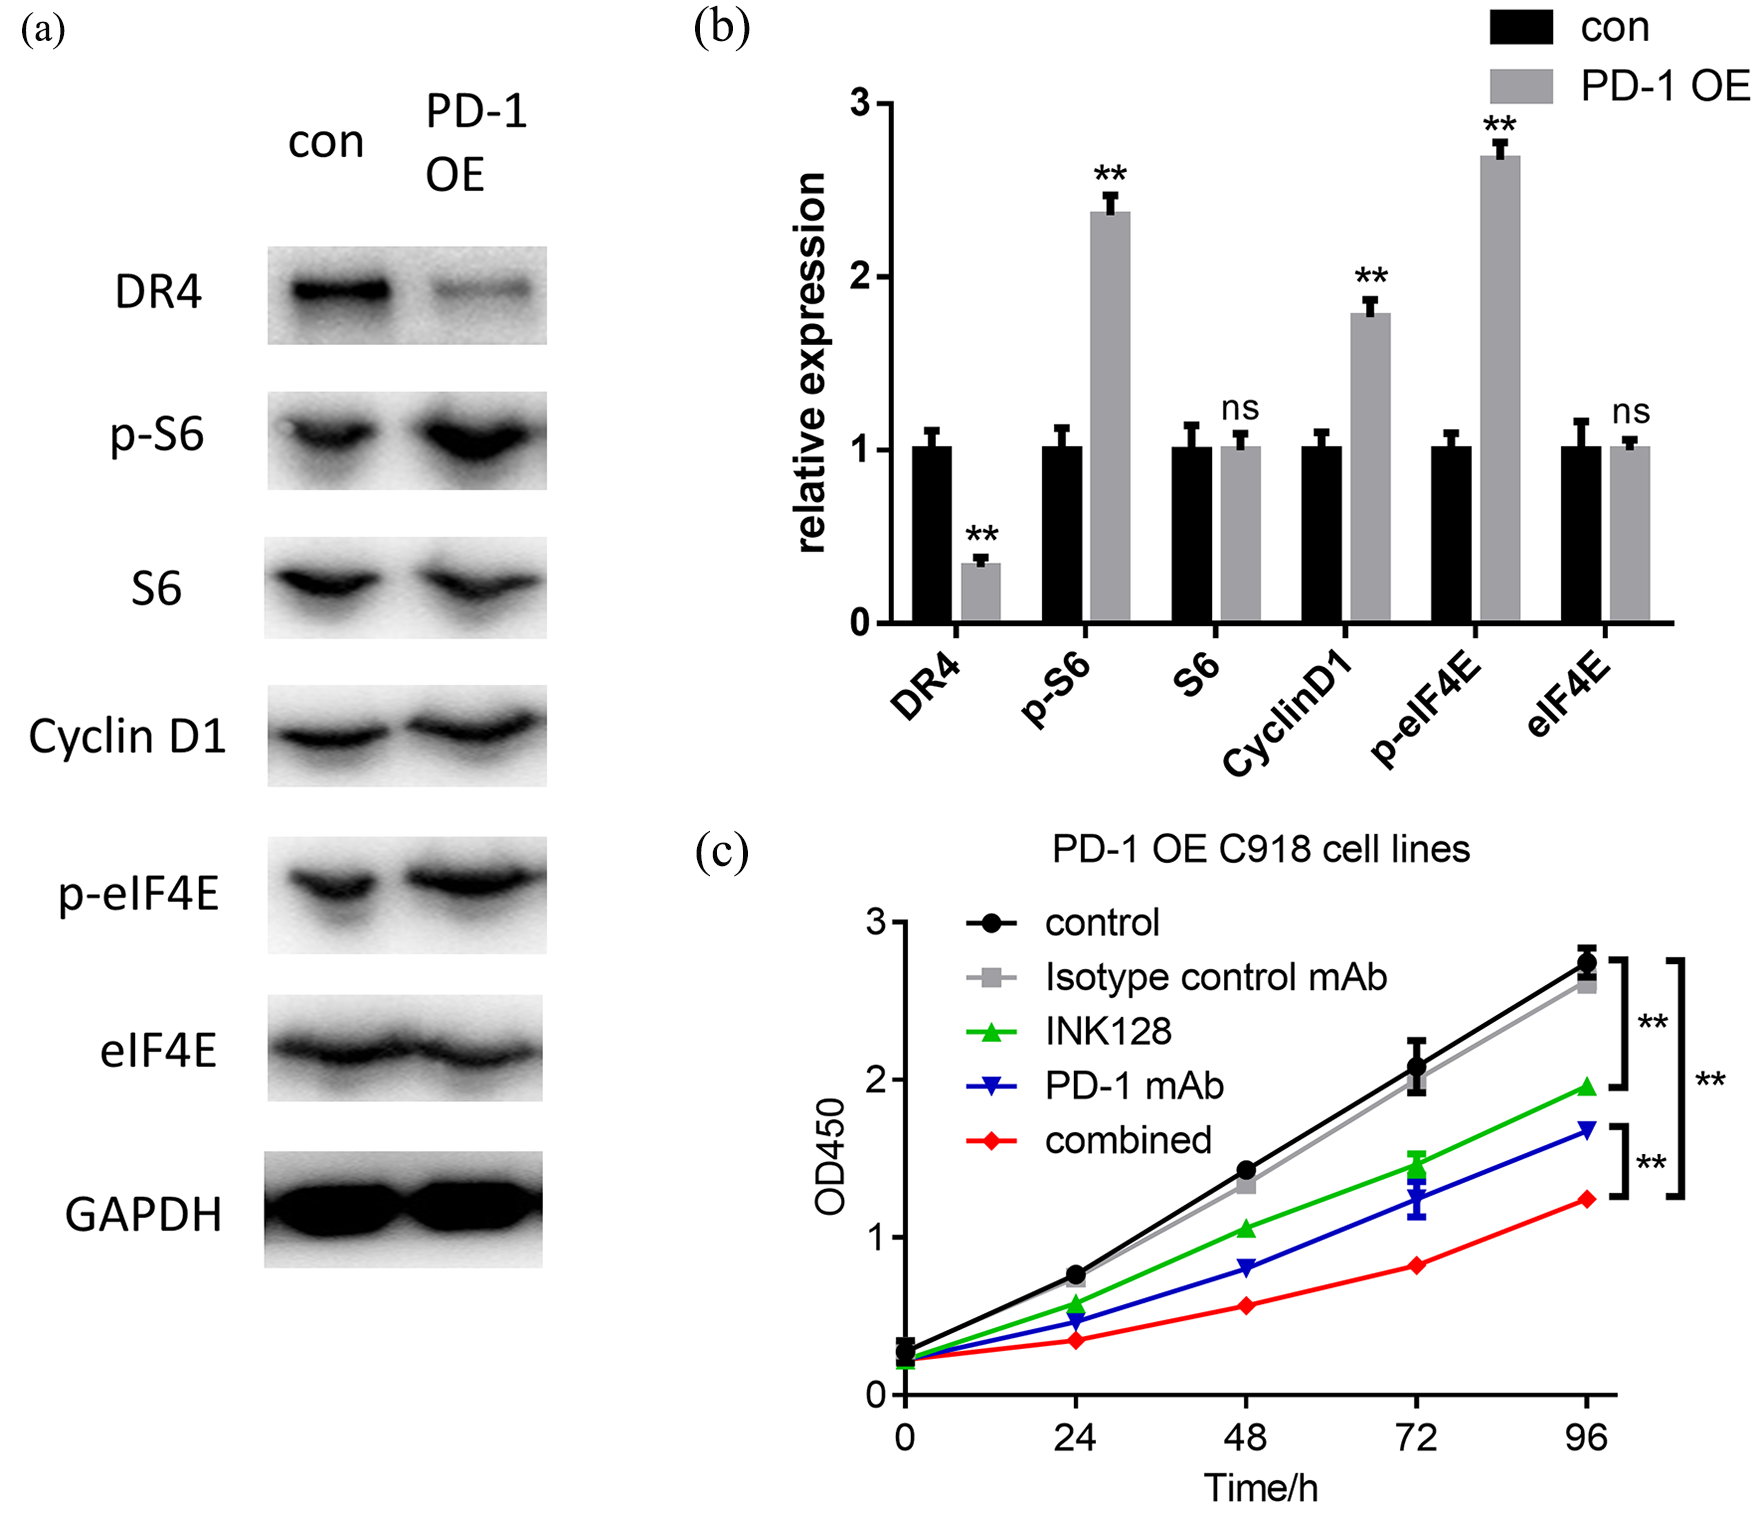
PD-1 modulates the phosphorylation level of the mTOR downstream effector S6 and eIF4E, and the mTOR inhibitor cooperates with the anti-PD-1 antibody in inhibiting cell proliferation. (a)–(b) Immunoblotting analysis shows that overexpression of PD-1 promotes the phosphorylation of S6 and eIF4E, then reduces DR4 and increases cyclin D1 in C918 cells. (c) The OD values ± SD of CCK8 assay in different administered groups in C918 PD-1 OE cells.
Discussion
UM is the most common intraocular malignant tumor in adults. It is also the most common primitive malignant intraocular tumor worldwide.28, 29 UM can occur in any part of the uvea, including iris, ciliary body, and choroid, but is most common in the posterior pole of the eye. UM can metastasize through the blood circulation system to the liver, lung, brain, and reproductive system; the liver is the most frequent metastasis organ. 30 Due to the lack of specific treatment targets for UM, a limited treatment strategy has been developed, and therefore patient survival is short once metastasis is confirmed. Immune checkpoint blockade therapy has been developed in the treatment of several malignant tumors and PD-1 was one of the treatment targets. However, whether PD-1 expression on UM affects tumor progression has not yet been studied.
In this study, PD-1 expression on UM was associated with poor patient disease-free survival and overall survival. PD-1 and optic nerve invasion were the independent prognostic factors. PD-1 expression was associated with the largest tumor diameter, which implies that PD-1 expression may affect tumor proliferation ability. The biological role of PD-1 on UM tumor tissues is in accordance with previous observations in liver cancer. 31 The largest diameter of the tumor base can reflect the area of contact between the tumor and the sclera, which can indicate the possibility of the tumor infiltrating the sclera and scleral vessels; therefore, it can affect the prognosis of patients with UM.
PD-1 is an essential immunosuppressive molecule belonging to the immunoglobulin superfamily. It is a membrane protein containing 268 amino acid residues. 32 It was first cloned by Yasumasa Ishida, Tasuku Honjo, and their colleagues at Kyoto University in 1992. 33 In 1999, the Chen group confirmed the role of PD-1 as a negative regulator of immune response. 14 A combination of PD-1 and PD-L1 induced the programmed cell death of T cells, which lead to the immune escape of tumor cells. 34 The structure of the protein included the extracellular IgV domain, the transmembrane region, and the intracellular tail. There were two phosphorylation sites in the intracellular tail, which, upon ligand binding, recruited SHP-1 and SHP-2 phosphatase and then negatively regulated the signal transduction of the T cell receptor.20, 34 PD-1 is expressed on the surface of activated T cells, B cells, and macrophages, indicating that PD-1 has more extensive regulation of immune response than CTLA-4. However, more recent studies also revealed a regulating role of PD-1 in promoting tumor proliferation, which contrasted with its inhibitory role in immune cells.21, 35 PD-1 overexpression on tumor cells promoted the phosphorylation of the mTOR downstream effectors and the elevated expression of cell-cycle-promoting molecules. 31 In accordance with these findings, our results found that PD-1 overexpression on UM promoted cell proliferation by upregulating the phosphorylation level of S6 and eIF4E, and by promoting the expression of cyclin D1 and inhibiting the expression of DR4. Also, a combination of PD-1 blockade with the mTOR inhibitor exhibits the most tumor proliferation inhibition potential.
There are some limitations in our study. First, the use of TMA with a single core for each tumor sample may introduce systematic error. The advantages of TMA is that (a) it contains tumor tissues on one slide; (b) the immunohistochemistry experiment could be performed in the same condition; and (c) high and low protein expression in different tumor tissues could be compared. However, intratumor heterogeneity exists in UM27, 36 and TMA may not exhibit the whole tumor information as sections of formalin fixation and paraffin embedding specimens. Second, although we provided cytogenetic data on monosomy 3, other potential factors—including BAP1, IGF-1R, and HLA, which were also considered as prognostic factor of UM—were not analyzed; therefore it may be difficult to compare the prognostic role of these factors with PD-1.
In conclusion, these results revealed that the expression of intratumor PD-1 was associated with poor patient survival. Overexpression of PD-1 in UM cell lines promoted tumor cell proliferation, while knockdown of PD-1 inhibited its proliferation capacity. PD-1 overexpression promoted the phosphorylation of effectors downstream mTOR, including S6 and eIF4E. PD-1 blockade synergized with the mTOR inhibitor in inhibiting the proliferation of UM. Our study established the role of PD-1 in the progression of UM and provided a new potential treatment selection for it.
Supplemental Material
Supplemental_Figure1 – Supplemental material for PD-1 expression on uveal melanoma induces tumor proliferation and predicts poor patient survival
Supplemental material, Supplemental_Figure1 for PD-1 expression on uveal melanoma induces tumor proliferation and predicts poor patient survival by Zhongming Jiang, Yuexiang Yan, Juan Dong and Lingling Duan in The International Journal of Biological Markers
Footnotes
Author contributions
ZMJ designed this study and performed this study; YXY participated in the writing of this paper; JD performed the FISH analysis; and LLD revised the manuscript.
Declaration of conflicting interests
The author(s) declared no potential conflicts of interest with respect to the research, authorship, and/or publication of this article.
Funding
The author(s) received no financial support for the research, authorship, and/or publication of this article.
Supplemental material
Supplemental material for this article is available online.
References
Supplementary Material
Please find the following supplemental material available below.
For Open Access articles published under a Creative Commons License, all supplemental material carries the same license as the article it is associated with.
For non-Open Access articles published, all supplemental material carries a non-exclusive license, and permission requests for re-use of supplemental material or any part of supplemental material shall be sent directly to the copyright owner as specified in the copyright notice associated with the article.