
Abstract
Introduction:
PSA is a serine protease composed of 240 amino acids in a single polypeptide chain and is a routine parameter in prostate cancer diagnostics. The aim of our study was to test the long-term stability of tPSA and fPSA after 10 years’ storage at −80°C.
Materials and methods:
We analyzed two aliquots from 55 serum samples. The first was assayed in routine testing at the time of establishing the diagnosis. The second was thawed for further testing after approximately 10 years’ storage at −80°C. The mean of storage time was 10.41 years (min–max: 9.35–11.40 years). We compared the results of tPSA and fPSA. We calculated the fPSA/tPSA ratio and compared the results of clinical evaluation. Serum tPSA and fPSA levels were assayed using chemiluminescent kits Access Hybritech PSA and free PSA. All measurements were performed using the instrument UniCel® DxI 800.
Results:
tPSA decreased 3.59% on average with a correlation r=0.9213, and fPSA increased at an average of 2.41% with a correlation r=0.9338. The fPSA/tPSA ratio increased 0.80% on average with a correlation r=0.9174. On clinical evaluation, five samples had fallen to a less malignant category and three samples had risen to a higher malignant category compared with the original results.
Conclusion:
The stability of tPSA and fPSA levels in serum is sufficient after 10 years’ storage at −80°C. Calculation of the fPSA/tPSA ratio is not recommended due to the change in the category of malignancy of 15% of the samples.
Introduction
Prostate-specific antigen (PSA) was first identified and purified by Wang et al. in 1979. 1 PSA is a serine protease composed of 240 amino acids in a single polypeptide chain. PSA exists primarily in three forms in serum. The first form is bound to alpha1-anti-chymotrypsin 2 and amounts to 95% of total PSA (tPSA). The second form is complexed to alpha2-macroglobulin and is usually undetectable due to lack of immunoreactivity. The third form of PSA occurs in a free form (fPSA) and its concentration usually ranges from 5% to 50% of the tPSA concentration. 3 PSA is mainly produced in prostatic tissue. It is secreted into seminal fluid and, under physiological conditions, it allows for the liquefaction of seminal plasma. 4
In 1980, Papsidero et al. 5 were the first to report that PSA is regularly detected in the serum of prostatic cancer patients. Since the 1980s, the total level of prostate specific antigen (tPSA) has been used as a tumor marker in prostate cancer diagnostics. 6 Since the 1990s, fPSA has been used as a second parameter in prostate cancer diagnostics. 7 fPSA is not used by itself but serves for the calculation of the fPSA/tPSA ratio or, in other words, the percentage of fPSA. This formula is used for the differential diagnosis of benign and malignant prostate affections, especially at tPSA values in the range of 4–10 µg/L. 8
Currently, many frozen samples are stored in biobanks and are considered to be an important source of material for retrospective and prospective research studies. 9 Supporting retrospective research requires an accurate knowledge of the stability of those biomarker molecules, which are candidates for a leading role in these studies. The PSA molecule is one of these. In current literature, the main part of the data are concerned with pre-analytical conditions and short-term stability. Usually, data regarding long-term stability are rare or not available. Therefore, we decided to test long-term stability using our own deep frozen serum samples stored in our biobank.
The aim of our study was to test the long-term stability of tPSA and fPSA after 10 years’ storage at −80°C.
Methods
Group of patients
A total of 55 anonymous serum samples were enrolled in this study. We analyzed two aliquots from each sample. The first was assayed in routine testing at the time the diagnosis was being established. The second was thawed for further testing after approximately 10 years’ storage at −80°C. The mean storage time was 10.41 years (min–max: 9.35–11.40 years). We compared both groups of results and evaluated the difference, then compared the results of tPSA and fPSA. We calculated the fPSA/tPSA ratio and compared the results of clinical evaluation.
Serum samples
Peripheral blood was drawn using VACUETTE® Z Serum Sep tubes (Greiner Bio-One, Kremsmünster, Austria) and was allowed to clot. Serum was separated within 3 hours of collection by centrifugation at 1700 ×g for 10 min and all samples were immediately aliquoted and frozen. Samples were stored at −80°C under a 24 h monitoring system. Aliquoted serum samples were thawed only once, just prior to analysis.
Sample analysis
Serum tPSA and fPSA levels were assayed using chemiluminescent kits Access Hybritech PSA and Access Hybritech free PSA (Beckman Coulter, Brea, CA, USA). Imprecision (%CV) according to the CLSI EP5-A guidelines 10 is for tPSA at the level of 3.95 µg/L: within run=4.04, total imprecision=4.34; and for fPSA at the level of 1.40 µg/L: within run=2.33, total imprecision=2.92. Both kits are World Health Organization (WHO) standardized (tPSA WHO 96/670 and fPSA 96/668), and the manufacturer guarantees lot-to-lot traceability. Both measurements were performed using the instrument UniCel® DxI 800 Immunoassay System (Beckman Coulter).
Statistical analysis
Statistical Analysis Software release 9.2 (SAS Institute Inc., Cary, NC, USA) was used for all statistical analyses. A summary of statistical findings concerning time of storage and biomarker levels is presented. The Wilcoxon signed rank test and Spearman’s rank correlation coefficient was used to compare the distribution of biomarker values; a P-value <0.05 indicated the statistical significance.
Results
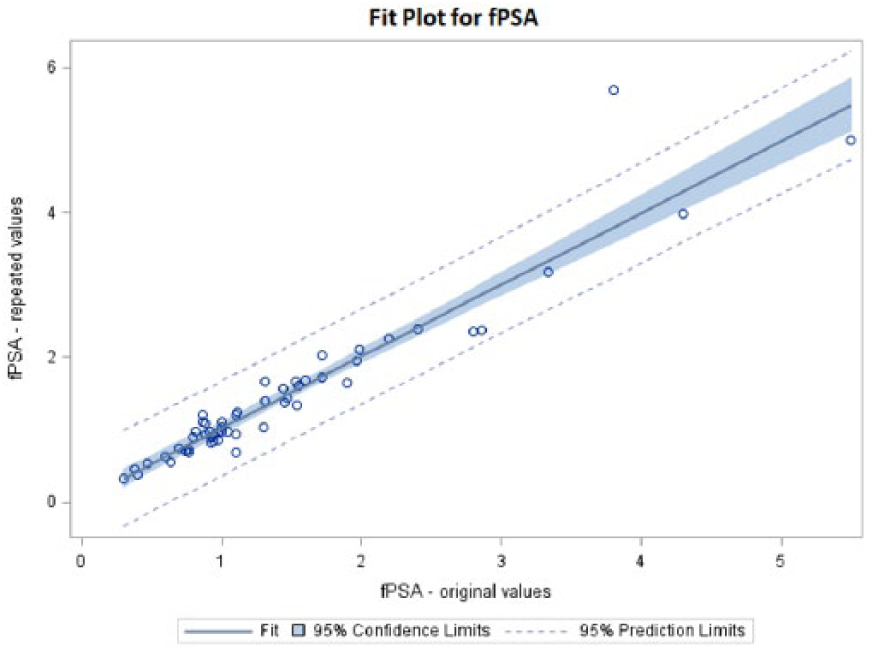
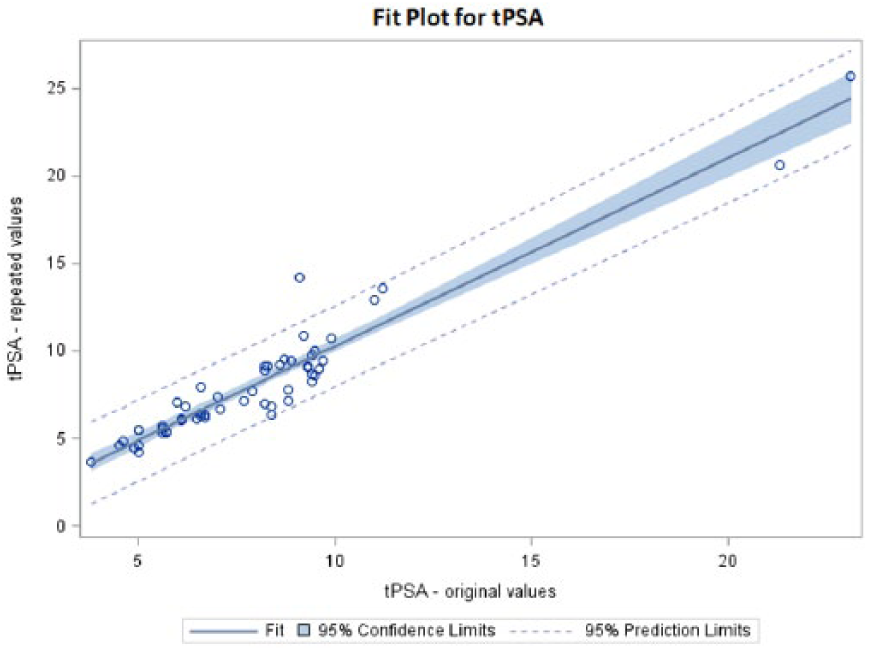
A summary of the results is shown in Table 1. tPSA decreased after 10 years storage by 3.59% on average with a correlation r=0.9213 (Figure 1). On the other hand, fPSA increased by an average of 2.41% with a correlation r=0.9338 (Figure 2). The calculated fPSA/tPSA ratio increased 0.80% on average with a correlation r=0.9174 (Figure 3).
tPSA, fPSA, fPSA/tPSA ratio original versus repeated values.
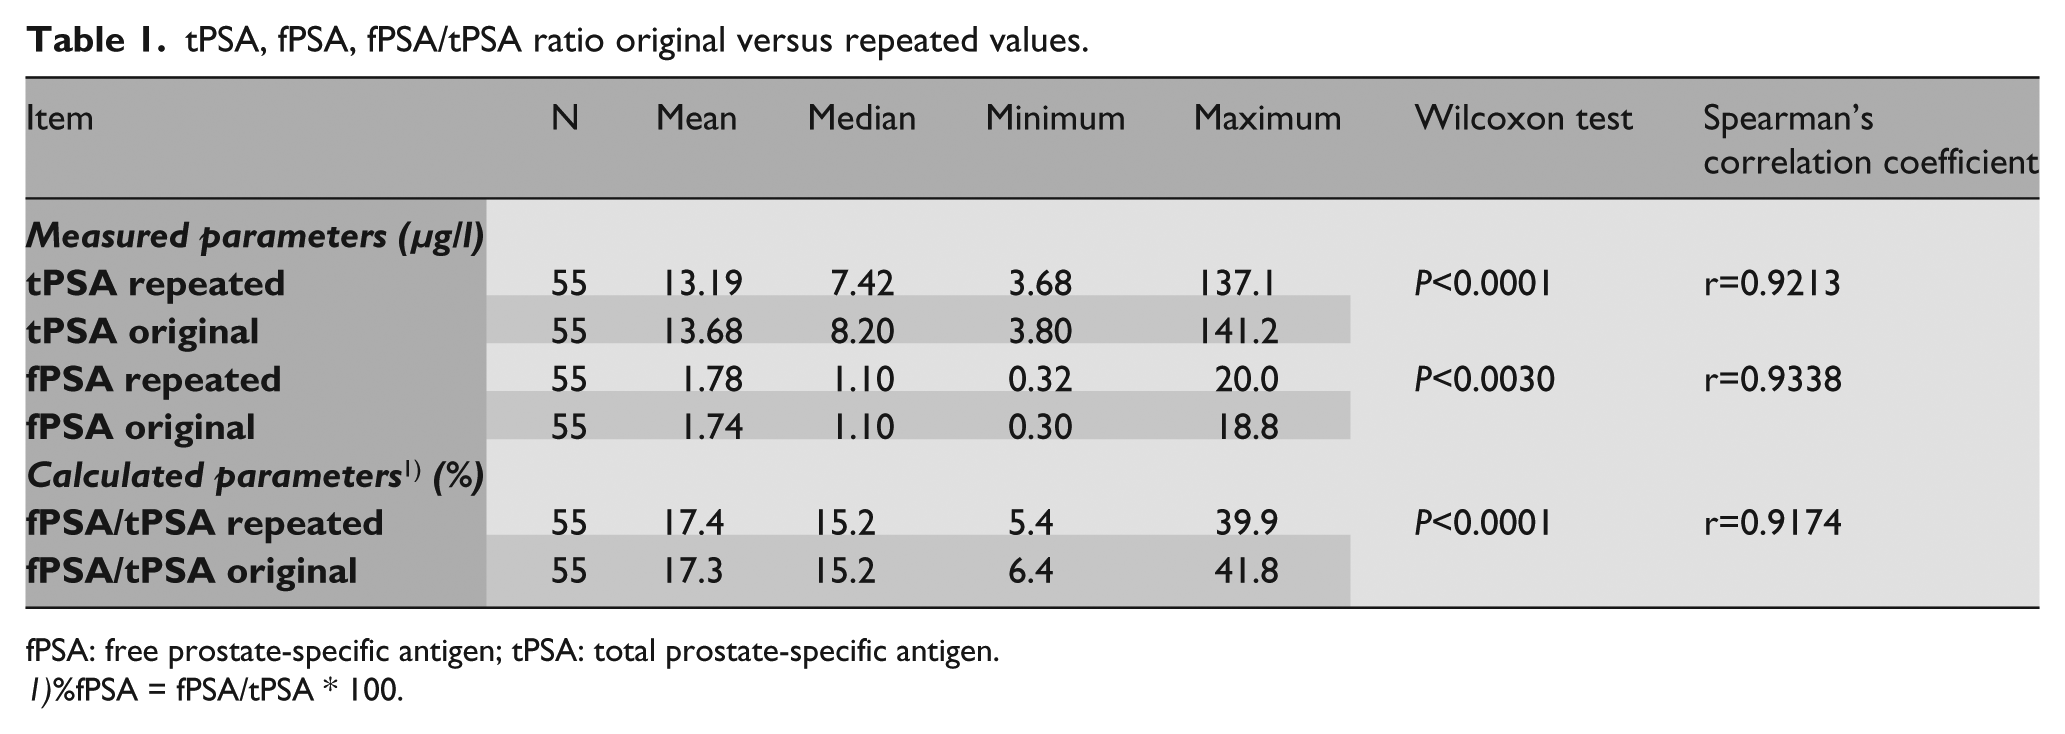
fPSA: free prostate-specific antigen; tPSA: total prostate-specific antigen.
%fPSA = fPSA/tPSA * 100.
Fit plot for tPSA*.
Fit plot for fPSA*.
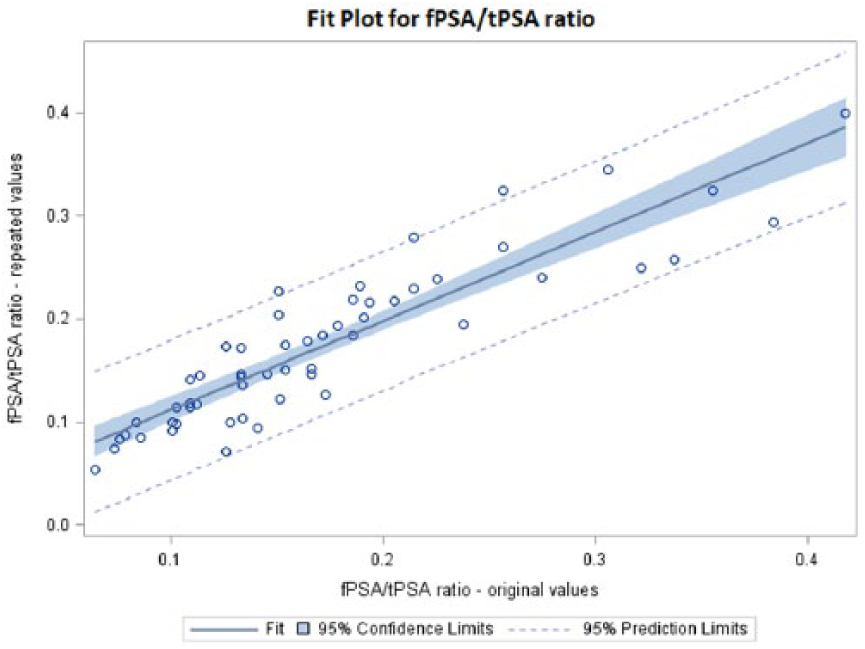
Fit Plot for fPSA/tPSA ratio.
We used the Wilcoxon signed rank test to compare the original results and repeated results. All the groups of results differed with statistical significance. In a detailed evaluation of fPSA/tPSA ratio we divided the results according to the categories that are used for the assessment of malignancy in the University Hospital in Pilsen (<15%: high probability of malignant tumor; 15%–25%: gray zone; >25%: high probability of benign tumor).
The results of the repeated clinical evaluation after 10 years’ storage are shown in Table 2. For the samples originally determined, we found eight (14.5%) that changed their category of malignancy. Five samples had fallen to a less malignant category and three samples had risen to a higher malignant category compared with the original results. These samples are written in italics in Table 2.
Changes in the clinical evaluation of fPSA/tPSA ratio original versus repeated.
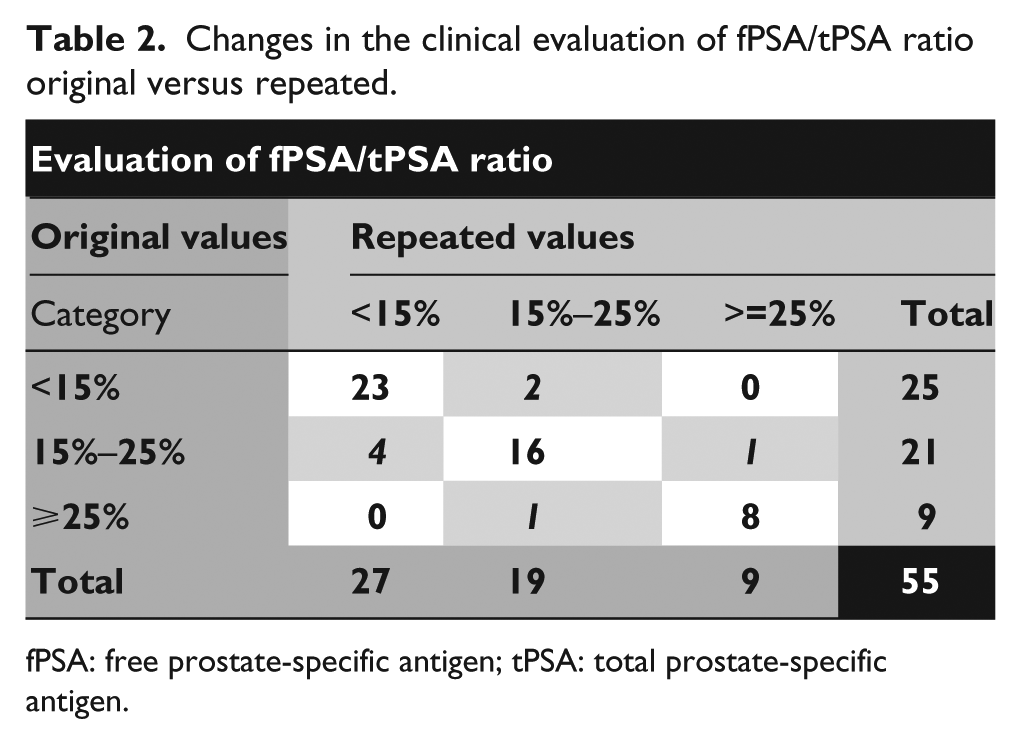
fPSA: free prostate-specific antigen; tPSA: total prostate-specific antigen.
Discussion
The stability of frozen serum samples stored at very low temperatures has long been the subject of many expert discussions. However, the number of studies regarding long-term stability of tPSA and fPSA in frozen specimens is limited.
The first study of tPSA stability was published by Simm and Gleeson in 1991. 11 They tested tPSA stability for 21 days at different storage temperatures (37°C, 21°C, 4°C and −20°C) for 42 serum samples. They proved sufficient stability of tPSA at 4°C for up to 14 days, which was contrary to the usual recommendation of 1 day storage at 4°C. The best stability was achieved by storage at −20°C, which was to be expected. However, only one freeze–thaw cycle was recommended because more than one cycle led to increases or decreases in the concentration of tPSA, which led to poor reproducibility.
The stability of fPSA was first mentioned in the study published by Woodrum et al. 12 in 1996. This study emphasizes the timely separation of the serum and red blood cells in the sample and only 24 h storage at 4°C. When samples were stored for 1 month at −20°C and at −70°C, tPSA levels were stable at both temperatures, but fPSA levels decreased significantly faster at −20°C than at −70°C. Arcangeli et al. 13 published similar data in 1997, including an assessment of different stabilities of tPSA and fPSA with regard to the fPSA/tPSA ratio, which was already being used to distinguish between benign and malignant prostate tumors. The authors point out the different levels of fPSA after 2 weeks storage at −20°C and −70°C. In contrast, levels of tPSA were stable at both temperatures. This different stability can have important implications for the clinical evaluation of the fPSA/tPSA ratio. Data on the longest storage period were published by Scaramuzzino et al. 14 The authors compared data of tPSA, fPSA and calculated the fPSA/tPSA ratio. Serum samples were stored at −70°C for 5 years. The reported data confirm the stability of both analytes and the stability of the calculated fPSA/tPSA ratio over this time period. The authors concluded that serum samples, when collected properly and stored at −70°C, may be used for tPSA and fPSA clinical studies for at least 5 years after collection.
Compared with the study conducted by Scaramuzzino et al., 14 the storage period of our samples was twice as long. When tPSA and fPSA levels are evaluated separately the spread of the results is somewhat larger than those after 5 years storage, but is still acceptable.
The fPSA/tPSA ratio suffers from the opposing change of both parameters used in this formula (%fPSA = fPSA/tPSA*100) and from the slightly larger spread of the results after 10 years’ storage. Due to the above mentioned reasons, five samples dropped to a less malignant category and three samples rose to a higher malignant category compared with the original results.
Conclusion
The stability of tPSA and fPSA levels in serum is sufficient after 10 years’ storage at −80°C. Calculation of the fPSA/tPSA ratio is not recommended due to the change in the category of malignancy of 15% of the samples.
Footnotes
Declaration of conflicting interest
The author(s) declared no potential conflicts of interest with respect to the research, authorship, and/or publication of this article.
Funding
The author(s) disclosed receipt of the following financial support for the research, authorship, and/or publication of this article: This study was supported by Ministry of Health, Czech Republic - Conceptual Development of Research Organization (Faculty Hospital in Pilsen - FNPl, 00669806) and LM2015089.