
Abstract
Introduction:
Total PSA (tPSA) and free PSA (fPSA) are the most commonly used biomarkers for early detection of prostate cancer. Despite standardization efforts, many available PSA assays may still produce discordant results. In the present study, we compared four PSA assays calibrated to the WHO standards 96/670 and 96/668 for tPSA and fPSA, respectively.
Methods:
Within the scope of the Prostate Cancer Early Detection Study Based on a ‘‘Baseline’’ PSA Value in Young Men (PROBASE), we tested tPSA and fPSA in serum samples from 50 patients in the four different PROBASE sites using four WHO-calibrated assays from Roche (Elecsys, Cobas), Beckman-Coulter (Access-II) and Siemens (ADVIA Centaur). The comparison was performed using the Passing–Bablok regression method.
Results:
Compared to Access, the median tPSA levels for Centaur, Elecsys, and Cobas were +3%, +11%–20%, and +17%–23%, respectively, while for median fPSA levels the differences for Centaur, Elecsys, and Cobas were +49%, +29%–31%, and +22%, respectively.
Discussion:
Despite all investigated assays being WHO-calibrated, the Elecsys and Cobas tPSA assays produced considerably higher results than the Access and Centaur assays. Differences in fPSA-recovery between all investigated assays were even more pronounced. When applying the tPSA cutoff of 3.1 μg/L recommended for WHO-calibrated assays, the use of higher calibrated assays may lead to unnecessary prostate biopsies. Conversely, if the historical threshold of 4 μg/L is applied when using WHO-calibrated assays, it could lead to falsely omitted prostate biopsies.
Introduction
Total PSA (tPSA) and free PSA (fPSA) tests have been the cornerstones of the early detection of prostate cancer for many years. However, there is a multitude of PSA assays available, which often provide discordant results,1–4 leading to relevant problems for interpretation in individual patients. The tPSA threshold of 4 μg/L used to drive prostate biopsy was initially proposed in a 1986 study by Hybritech Inc. (San Diego, CA, USA) in a small population of 472 men without a history of prostate cancer, 5 and was later confirmed by a screening study of 6630 men aged 50–74, which led to the first US Food and Drug Administration approval of the tPSA test for early detection of prostate cancer.6,7 Since then, the cut-off of 4 µg/L has been widely used even though various tPSA assays may differ in PSA recovery. A uniform threshold can lead to misinterpretation of tPSA values and may result in wrong clinical decisions depending on the assay. 8 Therefore, physicians should always be informed by their laboratory on the tPSA assay used and the reference limit that needs to be applied. The reasons for the differences in results among different tPSA assays may be due to (a) a non-uniform calibration of the assays1,2,5,8–13; (b) use of distinct antibodies showing different cross-reactivity with proteins displaying high aminoacid sequence homology with PSA (e.g. human kallikrein; (c) non-equimolar recognition of complexed and fPSA; and (d) different measurement technologies using different matrices. The non-uniform calibration issue was addressed by the introduction of the World Health Organization (WHO) reference preparations for tPSA and fPSA assays in 199514,15 after the discovery, which was based on quantitative amino acid analysis, 16 the true absorptivity for PSA was 1.84 mL × mg-1 × cm-1 (instead of 1.42 mL × mg-1 × cm-1 as described earlier). 1 The calibration of PSA assays to the WHO standard helped to reduce inter-assay variations, and typically resulted in lower tPSA concentrations after recalibration.
According to the information provided by the manufacturers, the Cobas, Elecsys, Access, and Centaur tPSA and fPSA assays are WHO-calibrated and should therefore theoretically determine similar PSA levels.
Within the Prostate Cancer Early Detection Study Based on a ‘‘Baseline’’ PSA Value in Young Men (PROBASE) Study, the urology departments of the University Hospitals of Dusseldorf, Heidelberg, Munich, and Hanover (Germany) are evaluating a risk-adapted approach to PSA screening based on a baseline tPSA level in men at the age of either 45 or 50 years. 17 The four study sites either use Cobas tPSA and fPSA assays (Dusseldorf, Heidelberg) or Elecsys tPSA and fPSA assays (Hanover, Munich). In the present study, we compared the tPSA and fPSA assays used in the PROBASE study sites with two other WHO-calibrated tPSA and fPSA assays (Access and Centaur), to assess harmonization of the results between four WHO-calibrated tPSA and fPSA assays, in order to estimate a meaningful decision level for intervention (magnetic resonance imaging or prostate biopsy).
Methods
Study design and study population
In this prospective study, based on the guideline of the national committee for clinical laboratory standards document EP9-A2, 18 which suggests to include at least 40 samples for verification purposes, blood samples from 50 male patients were collected in standard monovette systems (01.1601 Sarstedt AG, Nuembrecht, Germany) in the Department of Urology at the University Medical Center in Dusseldorf. Out of the 50 patients, only three had histologically proven prostate cancer and most others had benign disease (n=35) or a non-prostatic urological cancer (n=12). The age ranged from 24 to 88 years (median: 63 years). All samples were drawn prior to any prostate manipulation and at least four weeks after digital rectal examination or transrectal ultrasound. The blood samples were allowed to clot for 1 hour at room temperature and then centrifuged at 1600 × g for 15 minutes at 4°C. Sera were aliquoted and stored at −80°C until analysis. For the measurement of tPSA and fPSA, samples were shipped on dry ice to the four different sites of the PROBASE study, in Dusseldorf, Hanover, Heidelberg, and Munich, as well as to Muenster.
The study was carried out in accordance with the Helsinki Declaration of 1975 as revised in 1996. All patients gave written informed consent prior to participating in the study.
PSA-assays
tPSA and fPSA were measured in one assay run on each analyzer. All analyzes were performed according to the manufacturer instructions on the following analyzers at the five sites: a) Duesseldorf and b) Heidelberg = Cobas e602 and Cobas e411, Roche, Mannheim, Germany; c) Munich and d) Hanover = Elecsys (E411 and E170), Roche, Mannheim, Germany, and in e) Muenster = Access, Beckman-Coulter, Krefeld, Germany and ADVIA Centaur, Siemens, Erlangen, Germany.
Elecsys (batch number 172735 (tPSA) and 174970 (fPSA), Munich; 17562501 (tPSA), Hanover), Cobas (batch number 181675 (tPSA), Heidelberg; 181671 (tPSA), Dusseldorf), Access (batch number 470047 (tPSA) and 470102 (fPSA), Muenster); ADVIA Centaur (batch number 252 (tPSA) and 025 (fPSA), Muenster).
All assays were WHO-calibrated according to the package inserts. No fPSA-measurements were performed in Heidelberg.
Statistical analysis
We used the MedCalc Statistical Software version 15.6.1 (MedCalc Software bvba, Ostend, Belgium; https://www.medcalc.org; 2015) and the R statistical software (Version 3.2.3) for statistical assessment. For comparison of the assays we used the regression method of Passing and Bablock. 19 The reported confidence intervals (CI) of slopes and intercepts correspond to conventional testing if the methods are different: A 95% CI not including 1 (for the slopes) and 0 (for the intercept) refer to a statistically significant difference. Beyond conventional testing, the reported CI allow the similarity of methods to be investigated in the spirit of equivalence testing. The reader may set the CI into relationship with the limits of acceptance in terms of the similarity she or he has in mind. If the CI are within the limits, one could conclude equivalence in a statistical sense. The equality of non-normal distributions was assessed using the paired Wilcoxon-test. P-values were regarded relevant in case of P≤0.05. Results were considered exploratory, not confirmatory. No adjustment for multiple testing was performed. An overall significance level was not determined and cannot be calculated.
Results
Patient characteristics
We analyzed sera of 50 men attending the Department of Urology at the University of Dusseldorf with various urological diseases, with or without suspected prostate cancer with an expected tPSA value below 20 μg/L. The median age of the patients at blood draw was 63 years (interquartile range: 56–69 years).
Comparison of tPSA and fPSA values
The distribution of tPSA and fPSA values and the results of the Passing and Bablok regression analysis 19 are displayed in Table 1. A graphical presentation of the data is given in Figure 1 and Figure 2. The median tPSA-levels were 4.39 μg/L (Access), 4.54 μg/L (Centaur), 5.39 (Cobas e602, Duesseldorf), 5.14 μg/L (Cobas e411, Heidelberg), 4.90 μg/L (Elecsys E411, Munich), and 5.27 μg/L (Elecsys E170, Hanover).
Comparison of different assay platforms for tPSA, fPSA and f/tPSA in 50 identical serum samples with the Access- (a), and Centaur- (b) assay characterized by the regression equations according to Passing and Bablok*.
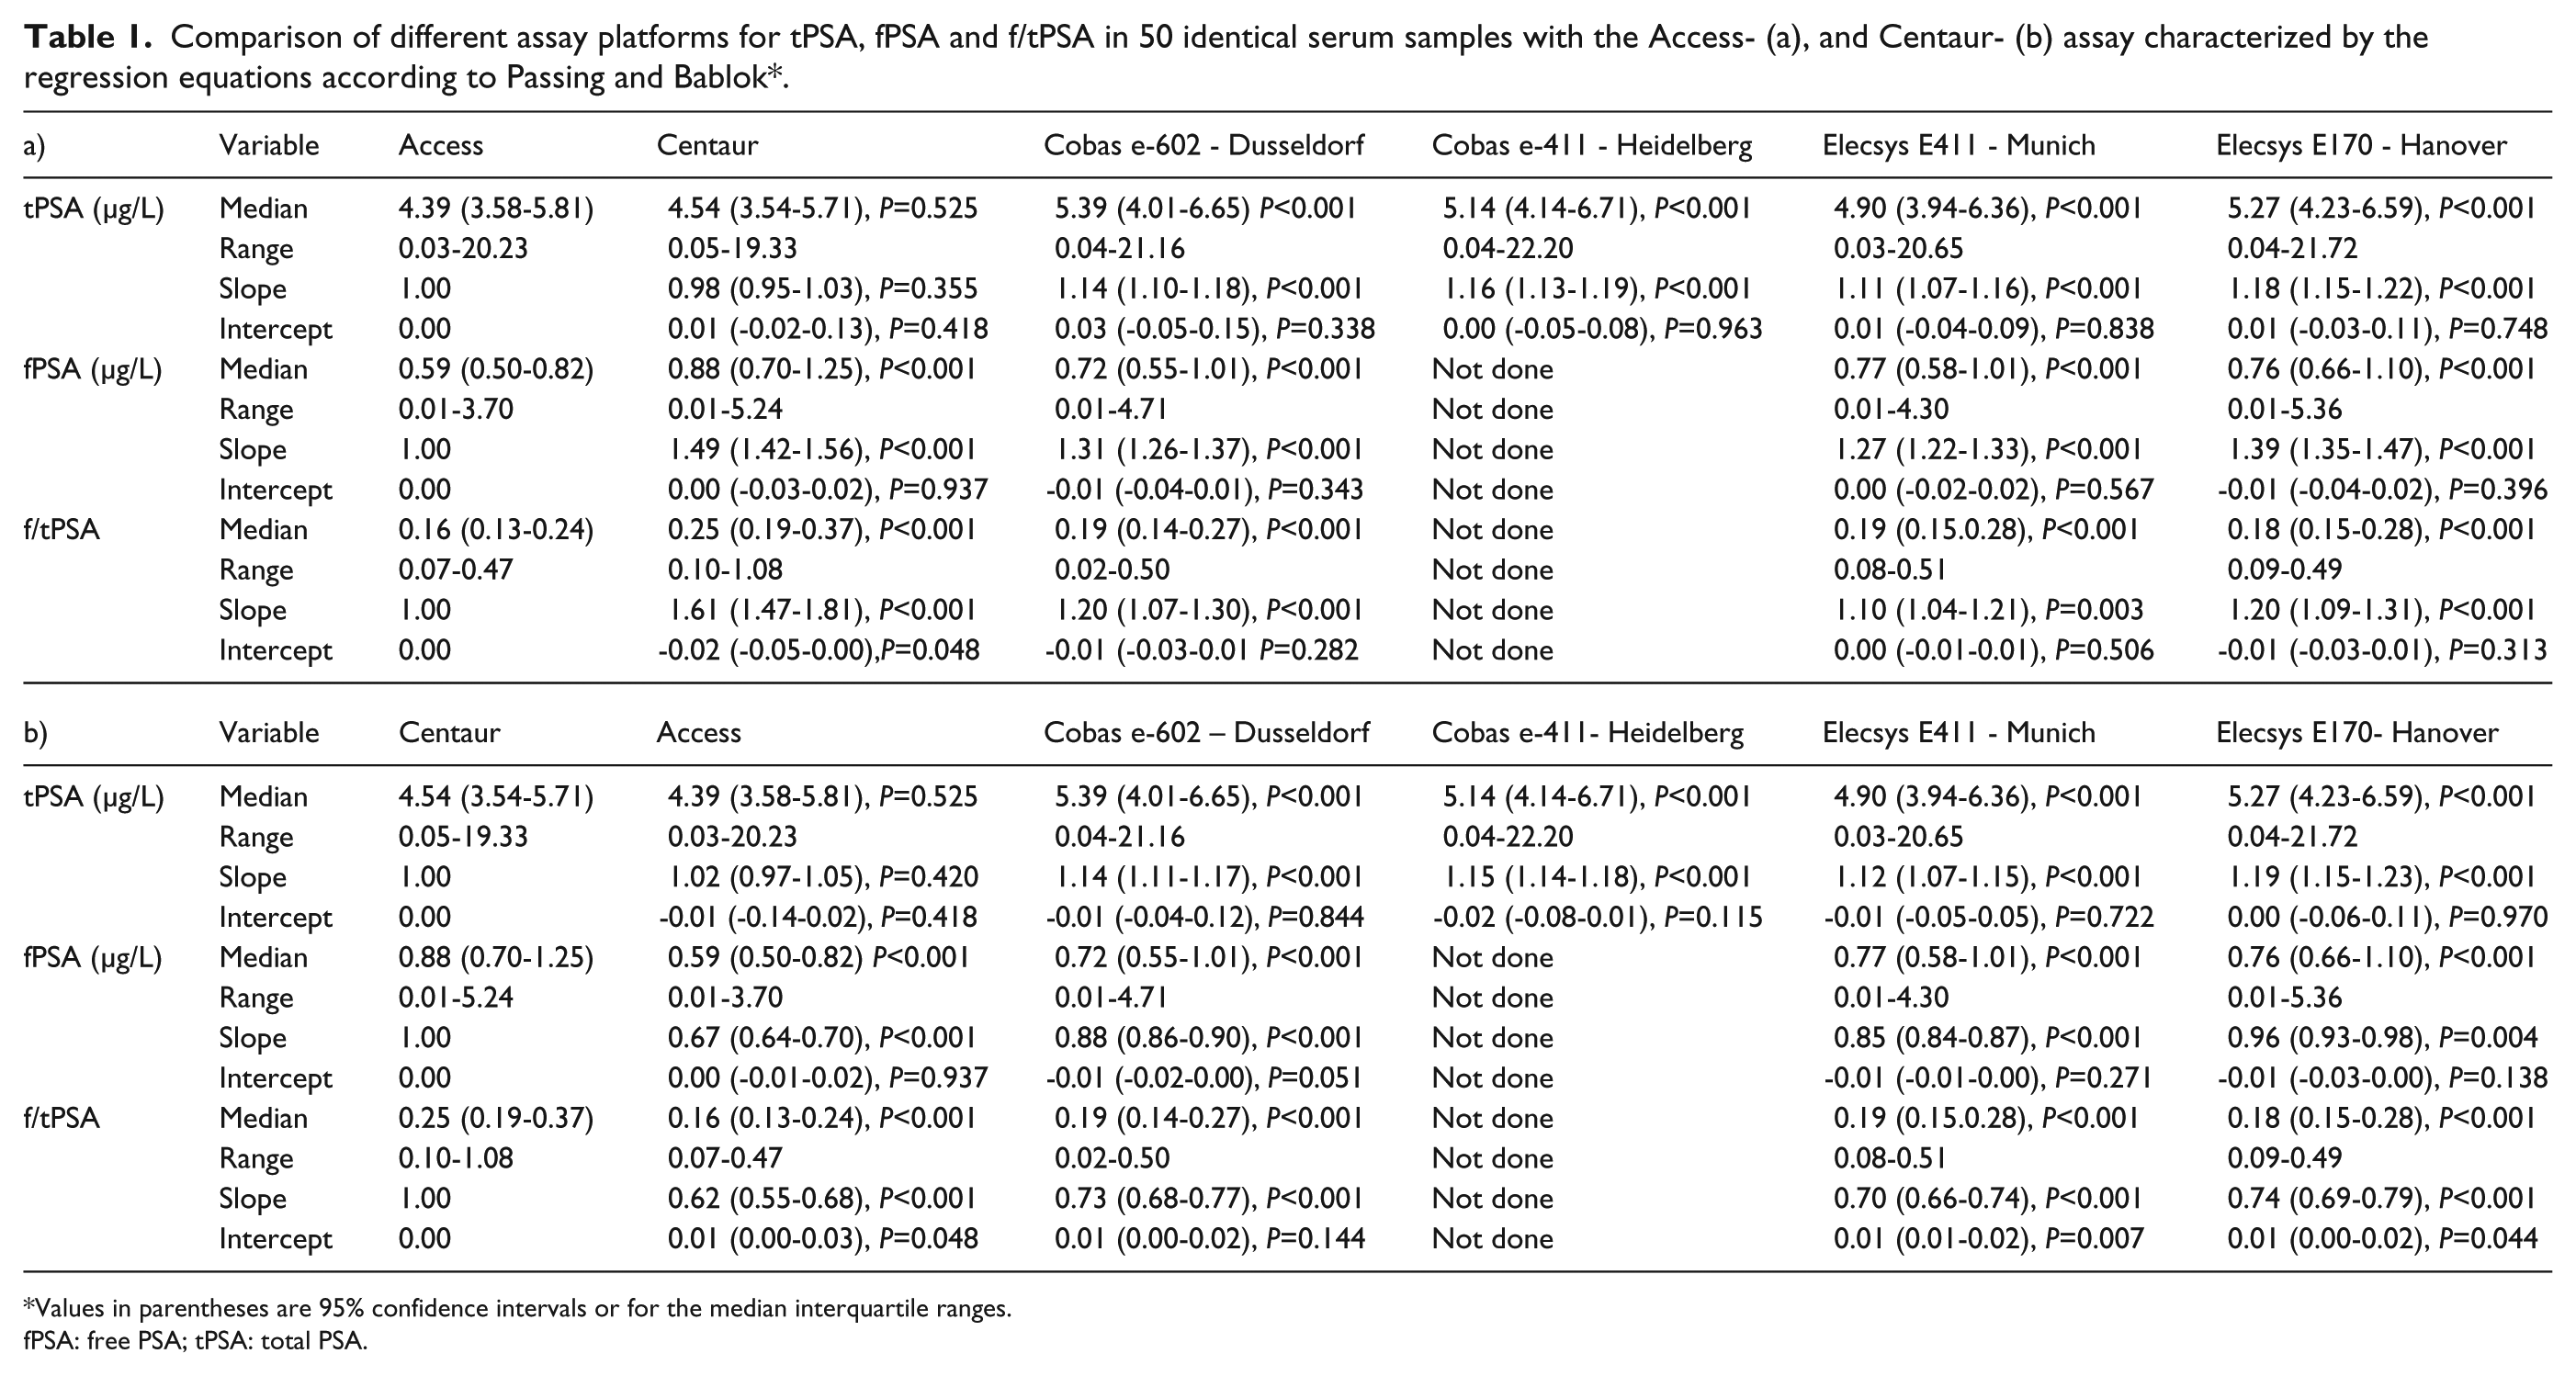
Values in parentheses are 95% confidence intervals or for the median interquartile ranges.
fPSA: free PSA; tPSA: total PSA.
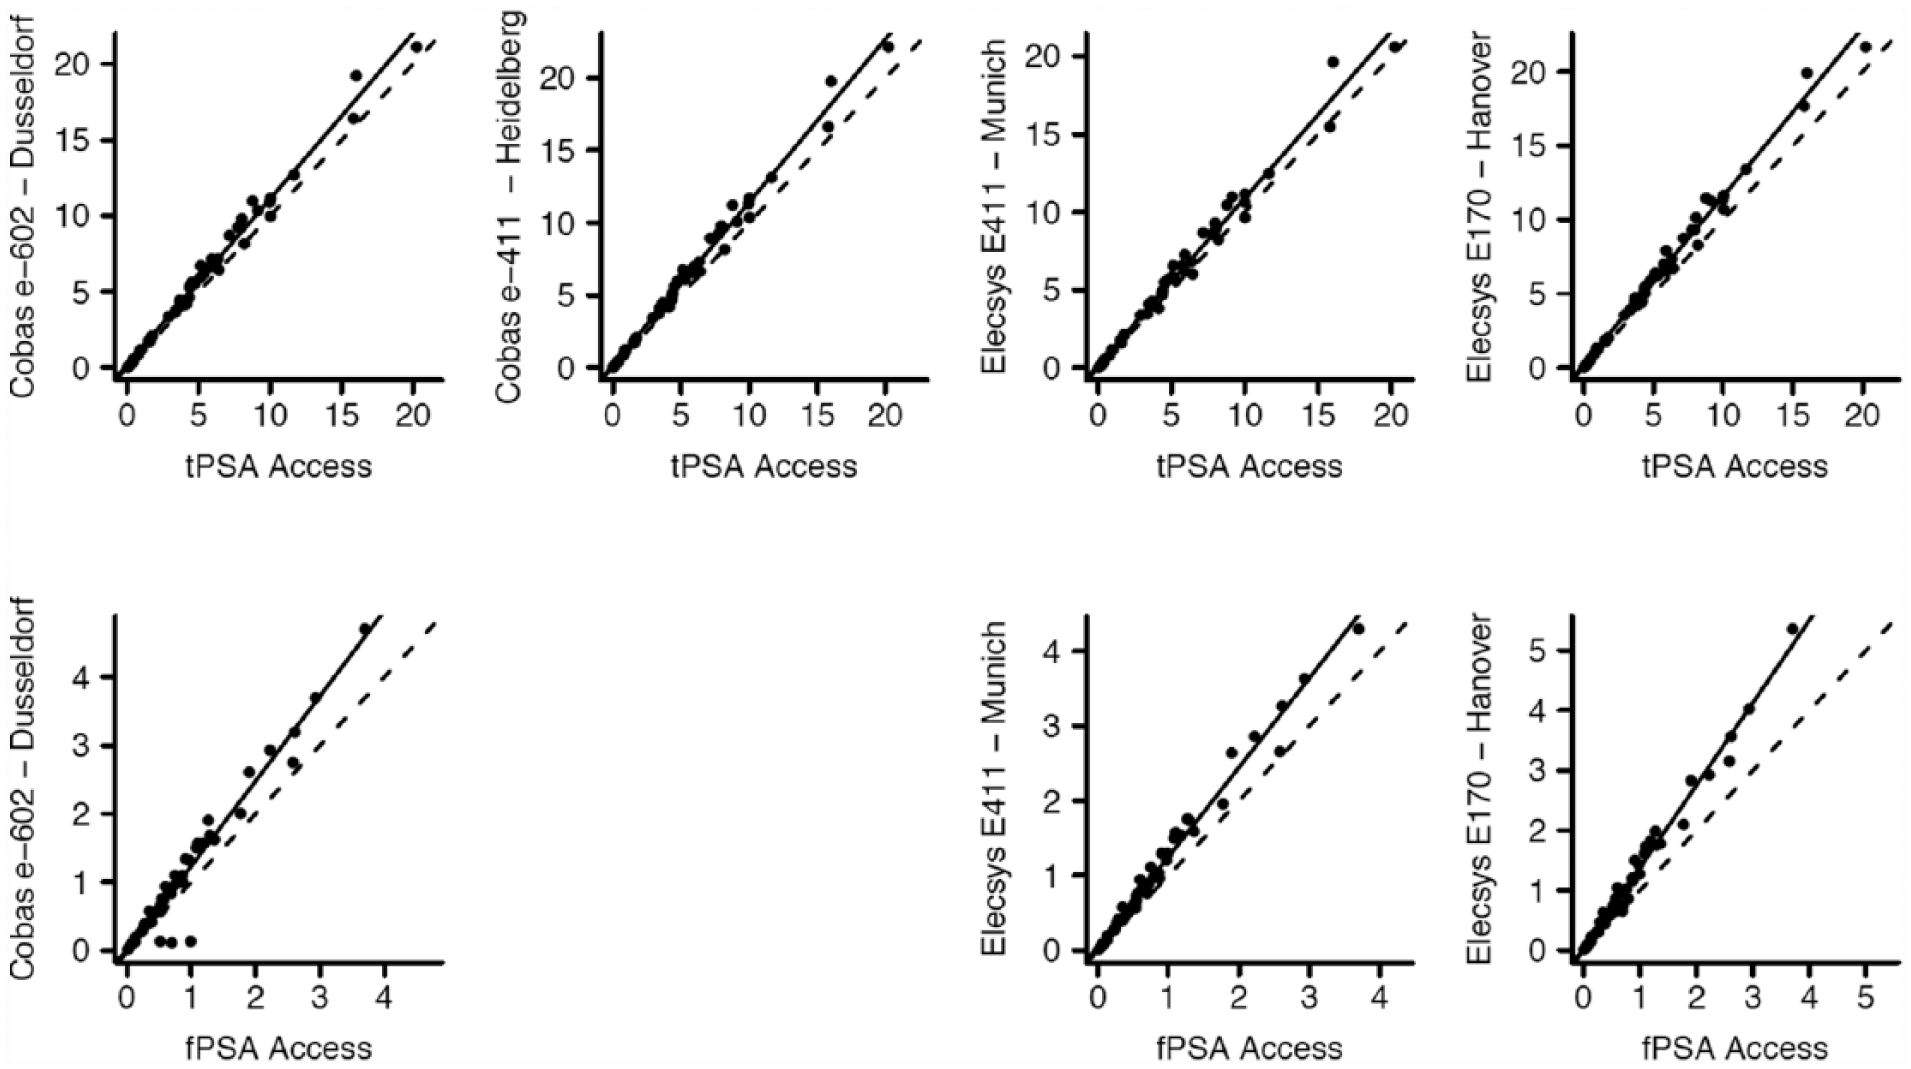
Scatterplots of Passing–Bablok regression analyses of tPSA and fPSA concentrations in the respective sites against the Access assay.
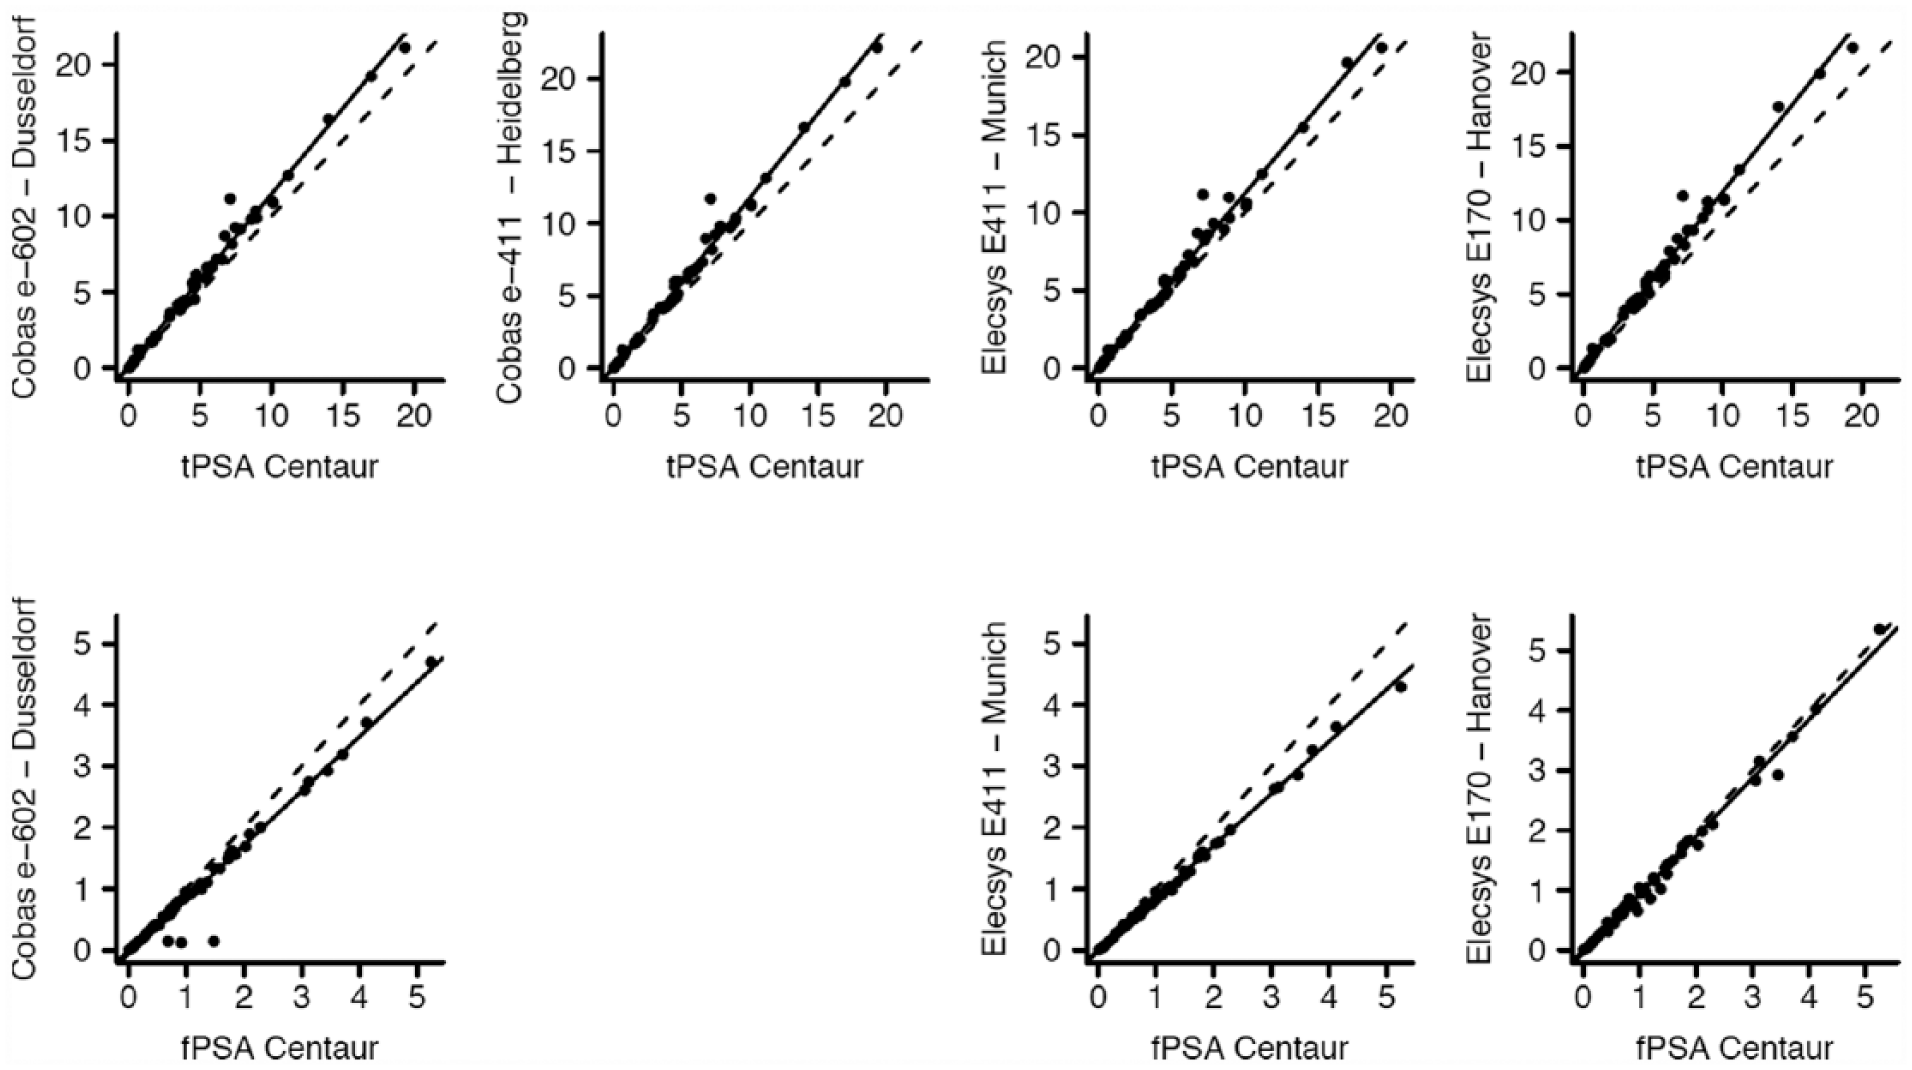
Scatterplots of Passing–Bablok regression analyses of tPSA and fPSA concentrations in the respective sites against the Centaur assay.
For tPSA, the Passing–Bablok regression showed slopes for both the Cobas and Elecsys assays, differing considerably from the Access assay. The values of slope and intercept were 1.14 (95% CI 1.10, 1.18) and 0.03 (95% CI −0.05, 0.15) for Cobas (Dusseldorf); 1.16 (95% CI 1.13, 1.19) and 0.00 (95% CI −0.05, 0.08) for Cobas (Heidelberg); 1.11 (95% CI 1.07, 1.16) and 0.01 (95%CI −0.04, 0.09) for Elecsys (Munich); and 1.18 (95% CI 1.15, 1.22) and 0.01 (95% CI −0.03, 0.11) for Elecsys (Hanover). When compared with the Centaur assay, the regression analysis showed slopes and intercepts of 1.14 (95% CI 1.11, 1.17) and −0.01 (95% CI −0.04, 0.01) (Cobas, Duesseldorf); 1.15 (95% CI 1.14, 1.18) and −0.02 (95% CI −0.08, 0.01) (Cobas, Heidelberg); 1.12 (95% CI 1.07, 1.15) and −0.01 (95% CI −0.05, 0.05) (Elecsys, Munich); and 1.19 (95% CI 1.15, 1.23) and 0.00 (95% CI −0.06, 0.11) (Elecsys, Hanover).
Both, Cobas and Elecsys resulted in approximately 15% higher tPSA levels compared with Access and Centaur. When comparing the Access with the Centaur, tPSA levels were almost equivalent with a slope of 0.98 (95% CI 0.95, 1.03) and an intercept of 0.01 (95% CI −0.02, 0.13) .
For fPSA the median levels were 0.59 μg/L (Access), 0.88 μg/L (Centaur), 0.72 μg/L (Cobas, Dusseldorf), 0.77 μg/L (Elecsys, Munich), and 0.76 μg/L (Elecsys, Hanover) (see Table 1).
The Passing–Bablok regression analysis for the fPSA assays showed more pronounced differences. In comparison with the Access assay the slopes were 1.31 (95% CI 1.26, 1.37), intercept −0.01 (95% CI −0.04, 0.01) (Cobas, Dusseldorf); 1.27 (95% CI 1.23, 1.33), intercept 0.00 (95% CI −0.02, 0.02) (Elecsys, Munich); and 1.39 (95% CI 1.35, 1.74), intercept −0.01 (95% CI −0.04, 0.02) (Elecsys, Hanover). These differences between slopes were relevant. Both Cobas and Elecsys resulted in approximately 32% higher fPSA levels compared with Access. The Centaur assay measured fPSA 49% higher than the Access assay.
For the ratio of f/tPSA, the median values were 0.16 (Access), 0.25 (Centaur), 0.19 (Cobas, Dusseldorf), 0.19 (Elecsys, Munich), and 0.18 (Elecsys, Hanover) (see Table 1).
In the Passing–Bablok regression analysis, f/tPSA values, such as for fPSA, showed more differences between the assays. In comparison with the Access assay the slopes were 1.20 (95% CI 1.07, 1.30), intercept −0.02 (95% CI −0.05, 0.00) (Cobas, Dusseldorf); 1.10 (95% CI 1.04, 1.21), intercept 0.00 (95% CI −0.01, 0.01) (Elecsys, Munich); and 1.20 (95% CI 1.09, 1.31), intercept −0.01 (95% CI −0.03, 0.01) (Elecsys, Hanover). Both Cobas and Elecsys resulted in approximately 30% higher f/tPSA ratios in comparison with the Access assay. The f/tPSA ratio, which was calculated based on the Centaur assay, was 55% higher than that based on the Access assay.
Discussion
Previously, it has been shown that the available tPSA assays may provide discordant results, which can lead to both unnecessary or falsely omitted prostate biopsies.1–4,10 This especially holds true when different assays are used in serial measurements for an individual patient.
The historical threshold, which was introduced before standardization efforts for PSA assay, was set at 4 μg/L.5,20 tPSA and fPSA tests are everyday practice tools used to counsel men and to trigger prostate biopsies in prostate cancer diagnosis. Therefore, validated thresholds for tPSA and fPSA tests are mandatory to help physicians to make meaningful decisions. Although the thresholds given by the manufacturers were validated in clinical studies, it must be kept in mind that these thresholds were determined with the patient cohorts available at the respective times, and that the thresholds depend on characteristics of the cohort, such as prostate cancer incidence, age distribution, and the proportion of presumably healthy men. Due to the PSA contamination in the general populations of large parts of the world, it is barely possible to find PSA-naive presumably healthy populations. For this reason, nowadays a validation study on PSA thresholds is barely possible to perform.
Accepting the difficulties of defining relevant cut-offs for tPSA and fPSA assays the standardization issue becomes even more relevant.
In a study on several automated assays, including the Elecsys assay, Kort et al. 21 showed that when tested with the standard WHO 96/670 reference preparation, the Elecsys assay measured tPSA levels that were practically identical with those to be expected for the WHO standard. In patient samples, they found a decrease of discordance following WHO-standardization, but recommended further efforts in harmonization especially for fPSA assays. 21 Stephan et al. 22 showed that WHO-calibration lowers tPSA-results by about 25% compared to the historical Hybritech calibration. For this reason, a WHO-calibrated tPSA assay should trigger a prostate biopsy at a threshold of about 3.1 μg/L to achieve a similar clinical sensitivity/specificity profile as the historical threshold of 4 μg/L in non-WHO-calibrated assays. In our experience, many laboratories supply the cut-off of 4 μg/L on the tPSA laboratory reports, regardless of which assay method has been used and thereby suggest triggering a prostate biopsy at >4 μg/L.
Following the introduction of the WHO reference preparation for assay standardization in the year 1995, the problem of discordant PSA-measurements was expected to be reduced and a “harmonization” of PSA-assays could be achieved.9,11,15,23,24 WHO-calibrated tPSA assays typically measure about 20%–25% lower concentrations than assays calibrated according to the historical Hybritech assays (Tandem-R or Tandem-E).22,25–28 In 2007, Stephan et al. 29 already showed that the Elecsys assay resulted in higher values than two other WHO-calibrated assays (AxSYM and Centaur). The same is true for the study by Foj et al. 30 who found the Elecsys assay to result in higher tPSA values compared to Access, Centaur, and Architect i2000. However, despite these findings, we still have the issue today that despite WHO reference material being available, discordances between the different assays exist. In our study, we found relevant differences between four WHO-calibrated assays, confirming that a WHO standardization of assays does not necessarily ensure that all methods measure equally.
The tPSA standard preparation containing seminal plasma-derived PSA 31 was established as the First International Standard for PSA coded 96/670. It consists of 90% PSA bound to α1-antichymotrypsin and 10% fPSA with a defined content of 1μg per vial as determined by amino acid analysis and mass spectrometry. 32
In an international collaborative study the immunoreactivity of the 96/670 preparation was compared in 26 immunoassay systems from 10 manufacturers in 10 laboratories in six countries. 23 After exclusion of two assays (i.e. outliers, presumably detecting free and complexed PSA in a non-equimolar manner), 33 the mean estimate of the content of 96/670 by 24 immunoassays was found to be 1.11μg/vial (95% CI 1.04, 1.18). 23 Although the methods section of this paper does not explicitly outline whether the assays used were recalibrated using the standardizations preparations, we believe they were used in an unchanged format (“participants were also asked to include their in-house calibrators in the assays”). The mean deviation from the defined content per vial, as measured by the 24 assays more than 17 years ago, was +11%.
Recently, the discussion about analytical performance specifications continues and three models to address this issue have been proposed in the 1st Strategic Conference of the European Federation of Clinical Chemistry and Laboratory Medicine, held 2014 in Milano.34–36
Our approach followed “model one,” investigating the impact of analytical performance of a test on clinical classifications or decisions. 36
In the present study, the Elecsys/Cobas assays revealed a median tPSA level of +15% as compared to the other two WHO-calibrated assays.
Given the approximately 20%–25% lower values measured by WHO-calibrated assays, the threshold at which a prostate biopsy may be triggered should be changed to about 3.1 μg/L to retain an equivalent sensitivity/specificity profile for the detection of prostate cancer. The assays investigated in our study were all WHO-calibrated according to the manufacturer’s information. Kort et al. 21 could show that various WHO-calibrated assays, including the Elecsys assay, measured tPSA in six WHO reference preparation concentrations within the expected limits. In their study, the largest discrepancies were found for fPSA concentrations. In our study with patient samples, we found differences between the assays in both tPSA and fPSA levels. The Elecsys/Cobas assays measured tPSA-levels 15% higher than the Access and Centaur assays. Given a difference of +15%, for the Elecsys/Cobas assays, a cut-off of 3.5–3.6 μg/L should mathematically achieve a clinical sensitivity/specificity profile equivalent to the traditional cut-off of 4 μg/L. Continuing to recommend the threshold of 4 μg/L following WHO-standardization of tPSA assays may result in delayed prostate biopsies. In a recent study by Foj et al., 30 a bias higher than 10% significantly impacted the clinical classification of patients, which corresponded to an overall false recommendation rate of 2.5% including false-positive and false-negative results.
In the present study, deviations between the fPSA-assays were even more pronounced than for tPSA. The median fPSA concentrations found were 22% (Cobas), 29%–31% (Elecsys), and 49% (Centaur) higher than the fPSA concentrations measured with Access. A higher f/tPSA-ratio predicts a lower risk for clinically detectable prostate cancer.37–39 Hypothetically, the use of assays with higher fPSA recovery may lead to falsely omitted prostate biopsies if the decision limit for the f/tPSA ratio is not adjusted. Similar findings were reported by Dittadi et al. 40 who compared the Immulite assay with the Centaur assay and showed that the fPSA concentration was considerably higher in the Centaur assay. However, in their study, Centaur fPSA was not measured directly, but calculated by tPSA minus complexed PSA, so the interpretation should be done with caution.
Conclusions
Despite the WHO reference preparations 96/970 and 96/668 being used for assay standardization, we found relevant differences between “standardized” tPSA and fPSA assays. Discordances for tPSA were approximately 15%. For fPSA the difference of 22%–49% was even more pronounced. Standardization of tPSA assays using the WHO reference preparations has improved the harmonization of tPSA assays, while discrepancies between fPSA assays seem to persist to a larger degree despite standardization.
Following the WHO-calibration of tPSA assays, an adjustment of the 4 µg/L threshold is mandatory to maintain the sensitivity/specificity profile for detection of prostate cancer. The assay-specific threshold for tPSA and f/tPSA should be given in the package insert of each commercially available assay, and laboratories should include the specific threshold and the name of the assay used in every tPSA or fPSA laboratory report. Physicians need to pay greater attention to this as well as to the inter-assay variability in serial PSA measurements before making clinical decisions.
For the PROBASE Study, the decision level for imaging or prostate biopsy was set at 3.0 μg/L. Based on our findings, it was decided to observe the number of participants with 2.8–3.0 μg/L, and to correct the threshold during the course of the study if necessary.
Footnotes
Acknowledgements
The authors acknowledge the assistance of Hilla Bürgel, Barbara Kloke, and Beate Pepping-Schefers from the Prostate Center Muenster; Elke Börger from the Department of Laboratory Medicine in Muenster; Lindsay van Alstine from the Department of Urology in Dusseldorf; Jutta von Kraewel from the Department of Urology in Heidelberg; and Markus Thaler from the Department of Clinical Chemistry in Munich in archiving, handling of samples, and performing tPSA/fPSA-measurements.
We acknowledge the critical review of the manuscript and helpful comments by Véronique Semjonow and the following company representatives of the participating assay systems:
Declaration of conflicting interest
The author(s) declared the following potential conflicts of interest with respect to the research, authorship, and/or publication of this article: MB received personal fees from Janssen-Cilag, Bristol-Myers Squibb, Merck Sharp & Dohme, Astra-Zeneca, Astellas, Bayer, Teva, Exelixis, Ipsen, Novartis, Amgen, Pfizer, and Sanofi-Aventis—all outside of the submitted work.
BH has received personal fees from Janssen R&D and Astellas—all outside of the submitted work.
AS has received grants from Supporting Association Prostate Center Muenster during the conduct of the study. Personal fees from Beckman Coulter, Ipsen, Janssen-Cilag, Astellas, Ferring, GSK, Lilly, Takeda and TEVA—all outside of the submitted work. Patent for characterization of primary tumors: (US20090035774 A1; DE10217102A1, DE10217102B4, EP1497657A2, US20060147911, WO2003087405A2, WO2003087405A3)
CA, KH, FI, JN, JG, and PA have no conflicts of interest to report.
Funding
The author(s) received no financial support for the research, authorship, and/or publication of this article.