
Abstract
Objective:
Fine particulate matter (PM2.5) has become a major concern for global environmental health, as it can lead to inflammatory diseases, such as allergic rhinitis (AR) and cause a high burden of disease. The aim of this study is to carry out a systematic review and meta-analysis based on available research to present the link between ambient PM2.5 and the risk of AR in global populations. Methods: We systematically searched six databases from their inception to 30 November 2020. An expanded literature search was carried out using the references of the included studies. Data extraction was performed using Excel 2016 software, and meta-analysis and heterogeneity analysis were performed using Review Manager 5.3 software. Results: A total of 14 out of 1361 studies were included in the meta-analysis. The quality assessment showed these studies to be of high quality. Seven out of 14 studies reported a relationship between ambient PM2.5 and AR through Odds ratios (OR, ORoverall = 1.14, 95% CI [1.00, 1.29]), but with a non-significant statistical overall test result (the test result for overall effect was Z = 1.98, p =.05). For subgroups by ages and regions, ORChildren = 1.08 (95% CI [1.04, 1.13]), and OROther ages = 1.50 (95% CI [1.24, 1.81]. The differences between age-related subgroups were significant (p <.01). Meanwhile, the relationship between PM2.5 and the risk of AR in Asia was significant (ORAsia = 1.20, 95% CI [1.01, 1.44], p =.001); whereas the association studies from outside of Asia have reported the relationship as non-significant (OROut-Asia = 1.04, 95% CI [0.82, 1.31], p =.76). Conclusion: There are reports that recognize that the exposure to PM2.5 may contribute to the development of AR. An international framework with a whole-of-society approach, including air quality control efforts and well-being health promotion among AR patients and at-risk populations, should be implemented.
Introduction
Air pollution (AP) is estimated to be as the greatest threat to global environmental health. 1 The mortality and morbidity of immunologic, respiratory and cardiovascular diseases increase when the concentration of AP rises. 2 Landrigan et al. 3 concluded, in a 2015 study, that pollution accounted for the deaths of an estimated 9 million people around the world. The widely monitored AP indices are concentrations of harmful particulate matters (PMs), which can be divided into PM10, PM2.5 (fine particulate matter), PM1.0, and PM0.1 (ultrafine particulate matter) according to the particles size: PM10 means that the aerodynamic diameters (ADs) of particles are less than 10 μm; the definitions are similar for PM2.5 (AD ⩽ 2.5 μm), PM1.0 (AD ⩽ 1.0 μm), and PM0.1 (AD ⩽ 0.1 μm). Notably, PM2.5 is related to fine particulate matter, and PM1.0 to ultrafine particulate matter. 4 PM10 and PM2.5 are primarily formed from chemical reactions through fuel combustion, whose sources include motor vehicles, smelters, power plants, industrial facilities, residential fireplaces, agricultural burning and so on. The typical indoor allergens such as dust mites and animal aeroallergens are classified as PM10. The most important PM is diesel exhaust, which has been estimated to represent up to 80% of human exposure, with ADs of less than 2.5 μm. 5 PM1.0 originates from the same sources as PM2.5, 6 ; whereas PM0.1 mainly originates from forest fires, vehicular and power plant emissions, and tobacco smoke. 7 Because PM2.5 is the fifth-ranking mortality risk factor worldwide, and the number of deaths caused by PM2.5 in 2015 increased from 3.5 million to 4.2 million globally, the most widely monitored air pollutant is PM2.5. 8
The main pathway by which PMs affect health is the human respiratory system, which means the PMs can pass the filtration by nose hair and settle in different parts of upper airway and respiratory tracts according to their size. The settling of PMs in the respiratory system can cause allergic diseases in susceptible persons, such as allergic rhinitis (AR), allergic asthma and atopic dermatitis. The upper respiratory airway (includes the nose, nasal cavity, mouth, pharynx and larynx) is the first line of defense against PMs and the most vulnerable part of the human respiratory system. AR has a high incidence and affects 10–40% of the population; it is the most common illnesses among outpatients in China. 9 The annual direct and indirect economic burden of AR varies from €3.0 billion to €50 billion per year across the world.10–12
AR is an inflammatory disease mediated by Immunoglobulin E (IgE) and caused by type one hypersensitivity reactions. Its symptomology typically includes rhinorrhoea, itching, sneezing, bronchial hyperresponsiveness and airflow obstruction.10,11 Allergens such as PM2.5 induce a high production of IgE, and bind with them. The next pathway is that IgE attaches to mast cells in the nasal epithelium to secrete histamine, leukotrienes, prostaglandins, platelet-activating factors and so on, and then increases vascular permeability, mucus secretion and blood vessel dilation. This results in watery rhinorrhoea, mucosal oedema and nasal congestion. Another important mechanism of PM2.5 that causes AR is that the activated mast cells can cause the secretion of eosinophils to stimulate the sensory nerves, and the cascade effect is sneezing and sensations of nasal itch and congestion. 10 PM2.5 aggravates AR symptoms by activating the macrophages/eosinophils and increasing the neutrophil/eosinophil levels.13,14 An indirect mechanism is that the synergy has the effects of other allergens to enhance allergic response by recruiting both neutrophils and eosinophils. 14 PM2.5 and PM10 particles can settle in the nose, pharynx and tracheobronchial region; PM2.5 can go deeper into the alveolar region; in particular, PM0.1 can deposit in small airways and alveoli. Furthermore, the respiratory tract cannot rapidly clear the smallest particles. Accordingly, it seems that the smallest particles are more harmful than the biggest particles.15–17
Current studies on the association between PM2.5 and AR have some limitations. Firstly, the most common studies are lab experiments and studies on the immune mechanism of PM2.5 on AR.2,13,18 Secondly, the current reviews and meta-analyses are mainly focused on limited age groups and study regions. A meta-analysis that was published in 2018 reported that the OR of PM2.5 exposure was calculated as 1.172, which means PM2.5 exposure increases the risk of AR among children. 19 Another meta-analysis published in 2021 reported the same conclusion, but the OR was calculated as 1.09 per 10 μg/m3 increase in PM2.5 concentrations. 20 Moreover, the association between ambient PM2.5 and AR at all ages or in various regions worldwide is unresearched. Therefore, this systematic review aims to summarise the contribution of ambient PM2.5 to the risk of AR among all populations worldwide.
Methods
This review followed the Preferred Reporting Items for Systematic Reviews and Meta-analyses (PRISMA) guidelines (see Supplemental Appendix 1). 21 The protocol of this study has not yet been prepared or registered on PROSPERO database.
Search strategy and selection criteria
The online databanks for this review include both English electronic databases (Cochrane Library, PubMed and Wiley Online Library) and Chinese electronic databases (Chinese National Knowledge Infrastructure, VIP and WanFang Database). The search used combinations of the terms of allergic rhinitis as MeSH heading and particulate matter. Both terms were searched as key or free text words to ensure as wide a range of search results as possible. The keywords and MeSH terms we used to identify relevant publications are ‘(“Rhinitis, Allergic”[Mesh]) AND “Particulate Matter” [Mesh]’. Additionally, English search terms were translated into Chinese during the search in the three Chinese databases. Considering the difference between two languages, we provide the re-translated search term from Chinese to English as follows: (‘Rhinitis, Allergic’ [Subject Term] OR ‘Allergic Rhinitis’ [Subject Term]) AND (‘PM2.5’ [Subject Term] OR ‘ambient particulate matter’ [Subject Term]). All databases were searched with no language restrictions, with the time period of publications from inception until 30 November 2020.
Inclusion and exclusion criteria
Original studies conducted on the relationship between ambient PM2.5 and human allergic rhinitis worldwide are included, with no language or study design restrictions. On the other hand, exclusion criteria are (1) studies reporting non-ambient PM2.5 (e.g. other types of particulate matters) and its association with rhinitis; (2) studies on the relationship between PM2.5 and other diseases, such as seasonal allergic rhinitis, allergic asthma, pollinosis and hay fever; (3) studies based either on animal, laboratory, or on occupational exposure; (4) reviews or letters without data. These are due to the reason of (1) the symptoms of seasonal AR are too complex and depend on the different response to seasonal aeroallergens, and there is obvious heterogeneity of seasonal aeroallergens all around the world; (2) pollinosis, or hay fever, is common seasonal allergic rhinitis with pollens as the allergen, but most pollens are bigger than 2.5 μm in aerodynamic diameter; (3) PM2.5 concentration varies greatly across living environments and working environments.
Selection process
The electronic search results were imported into the reference management software Endnote. After removing duplicates, each paper was assessed in two phases: firstly, the assessment of title and abstract screening was performed by two reviewers (XF J. and ZZ S.); whilst secondly, the assessment of full-text reviewing (to ensure the studies met the inclusion criteria) was performed by XF J. Y H. and ZZ S. During the entire process, potentially relevant studies were screened and reviewed for their eligibility. RR L., YZ Y. and NC D. were additional reviewers who settled any discordance.
Quality assessment
We applied a modified Newcastle-Ottawa scale (NOS) as the tool for assessing the risk of bias in all of the included studies. 22 We further adapted the scale in order to appraise the included studies (see Supplemental Appendix 2). Three domains including selection, comparability and outcome were addressed in this scale. 22 Studies were awarded a rating of 0–4 stars for the selection category, 0 to 2 stars for the comparability category, and 0 to 3 stars for the outcome category. Hence, when the stars from all sections were summed up, the range was from 0 to 9 stars. Two reviewers (XF J. and Q. C.) assessed the risk of bias of the included studies. Disagreements were solved by consensus. The higher total summary of stars indicates less risk of bias and a better methodological quality.
Data extraction and analysis
All of the included studies were managed in EndNote (Version X9, Philadelphia, USA). Data extraction was performed independently by XC J., ZZ S. and Q. C.. Microsoft Excel (Version 2016) was used for data extraction and assessing the risk of bias. The table of data extraction was designed prior to the study and was based on both discussion among the researchers in the group and experts in the field. The detailed extracted data include study characteristics (including methodological and basic information such as sample size, source, year and study country), average PM2.5 concentration of local records that were reported by the included studies, clinical information such as doctor diagnosis, and results of statistical analysis with significant impact estimations of PM2.5 on the risk of AR (such as odds ratios [ORs], and their 95% confident intervals [CI]). Missing summary data for presentation will be extracted as missing values, and will not be analyzed but described. During this process, disagreements were solved by consensus.
RevMan (Version 5.3) was used for the extraction and analysis of ORs their 95%CIs. Stata 16.0 was used for publication bias and sensitivity analysis. The Cochran Q statistic test and sensitivity analysis were used for assessment of heterogeneity between study results. To determine the percentage of variability, the I 2 statistic was used due to the heterogeneity of the included studies. Study results were considered consistent when there was less than 50% variation due to heterogeneity, using fixed effects models, and on the contrary, using random effects models (I 2 > 50%). Using random-effect meta-regression to study significant heterogeneity allowed us to determine which study-level factors explained heterogeneity. We used the Begg’s test, the Egger’s test and its funnel plot to evaluate the publication bias.20,23 In the Begg’s test result, a bias will exist when p <.05, and so is the Egger’s test result. A visible result of bias can be observed in the funnel plot graph. Sensitivity analysis was used to evaluate the stability of the included studies.
Results
Characteristics of the included studies
A total of 1361 titles were retrieved through our systematic literature search. After 223 duplications were removed, 1138 studies were screened by reading the titles and abstracts. Of these, 178 studies were eligible for full-text screening. In the process of full-text screening, 164 studies out of 178 studies were excluded, as they did not match the selection criteria. Of the 164 excluded studies, 137 studies were excluded because their study objectives were neither related to PM2.5 nor to AP; 5 studies focused on other allergic diseases such as seasonal allergic rhinitis, pollinosis or hay fever; 12 studies were experimental research on animals, cells or genes; 10 studies were excluded because they were reviews or studies not having original research data. A total of 14 papers were included after full-text screening, including 8 cohort studies and 6 cross-sectional studies that met the inclusion criteria.24–37 There were 197 potentially relevant studies identified from these 14 studies that were also reviewed, but all these studies were duplications of the 1361 records first identified from six databases. Hence, there were finally 14 studies included in our study. Figure 1 shows the PRISMA flow chart of the selection process.
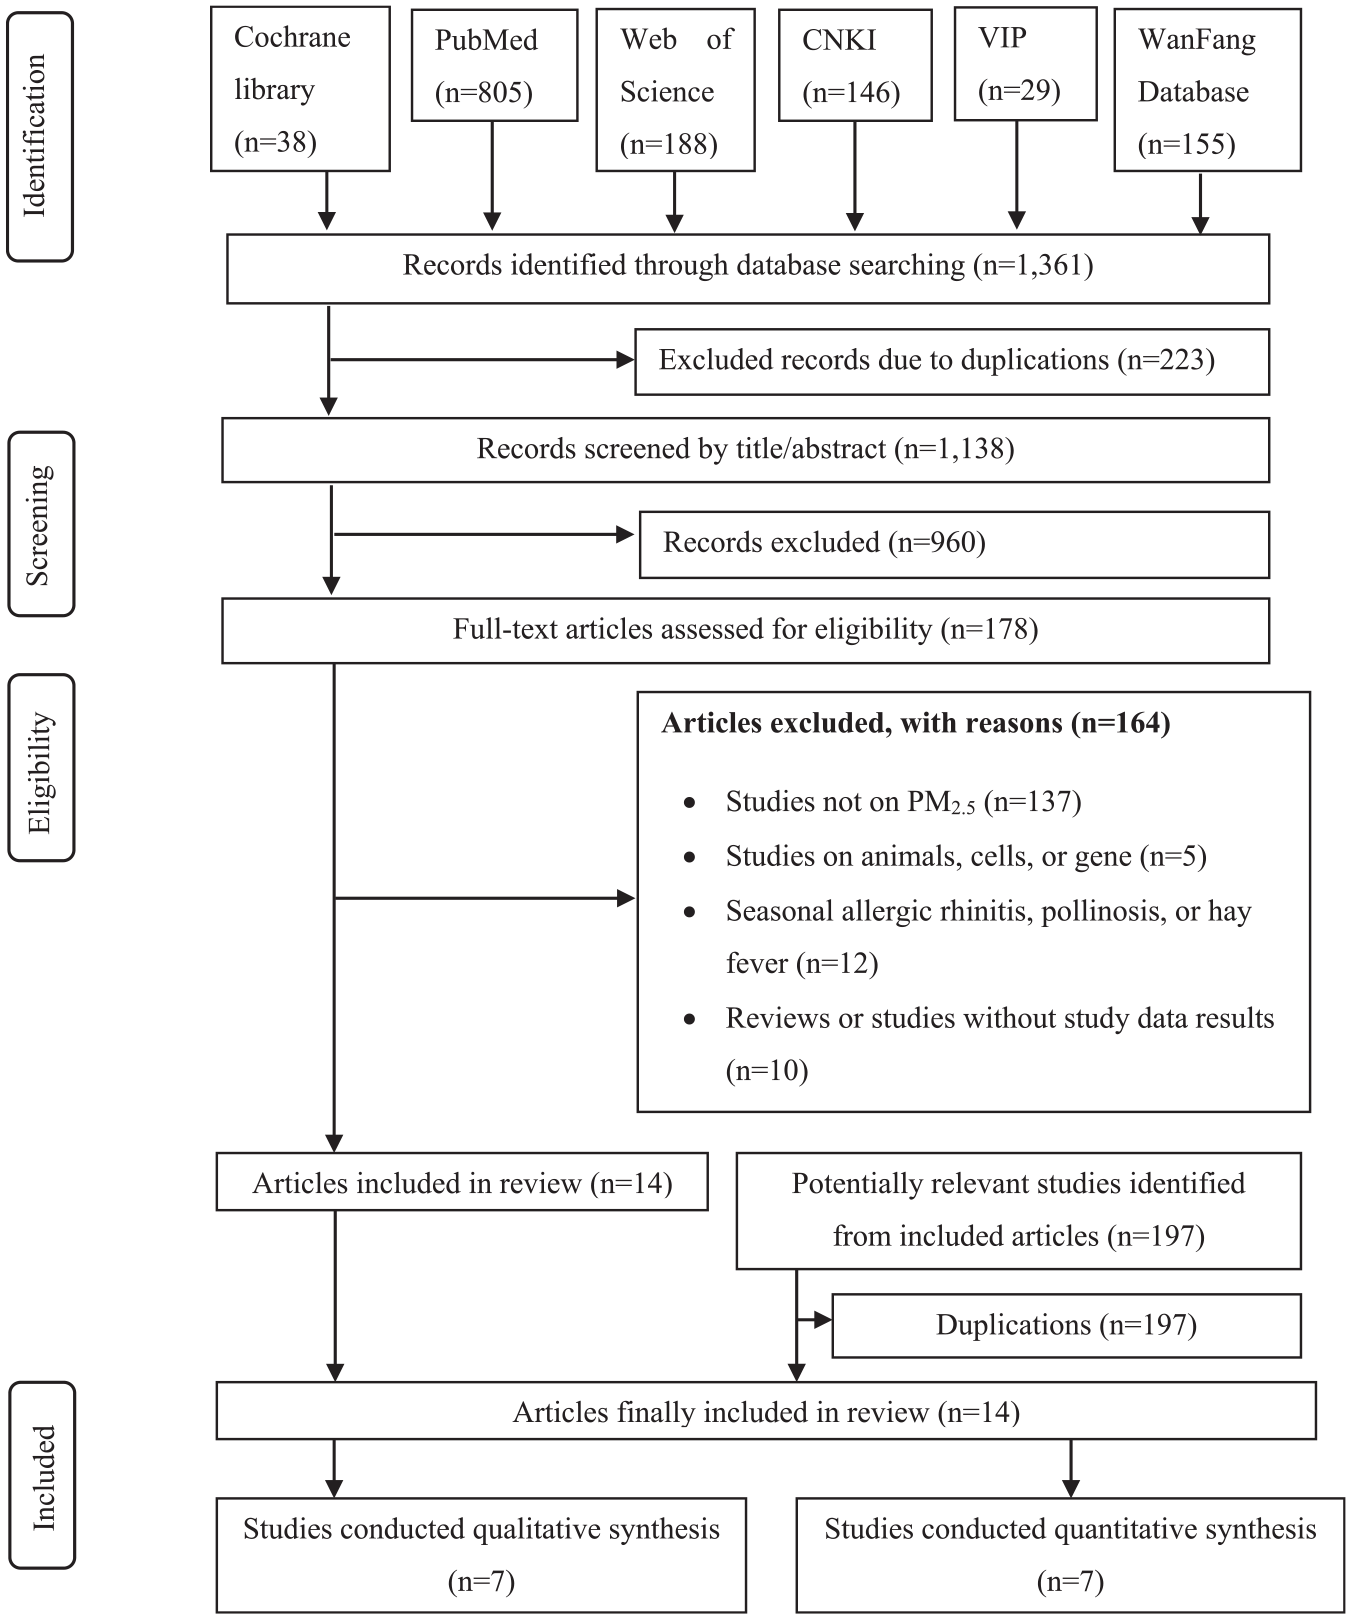
Selection process of PRISMA flow diagram.
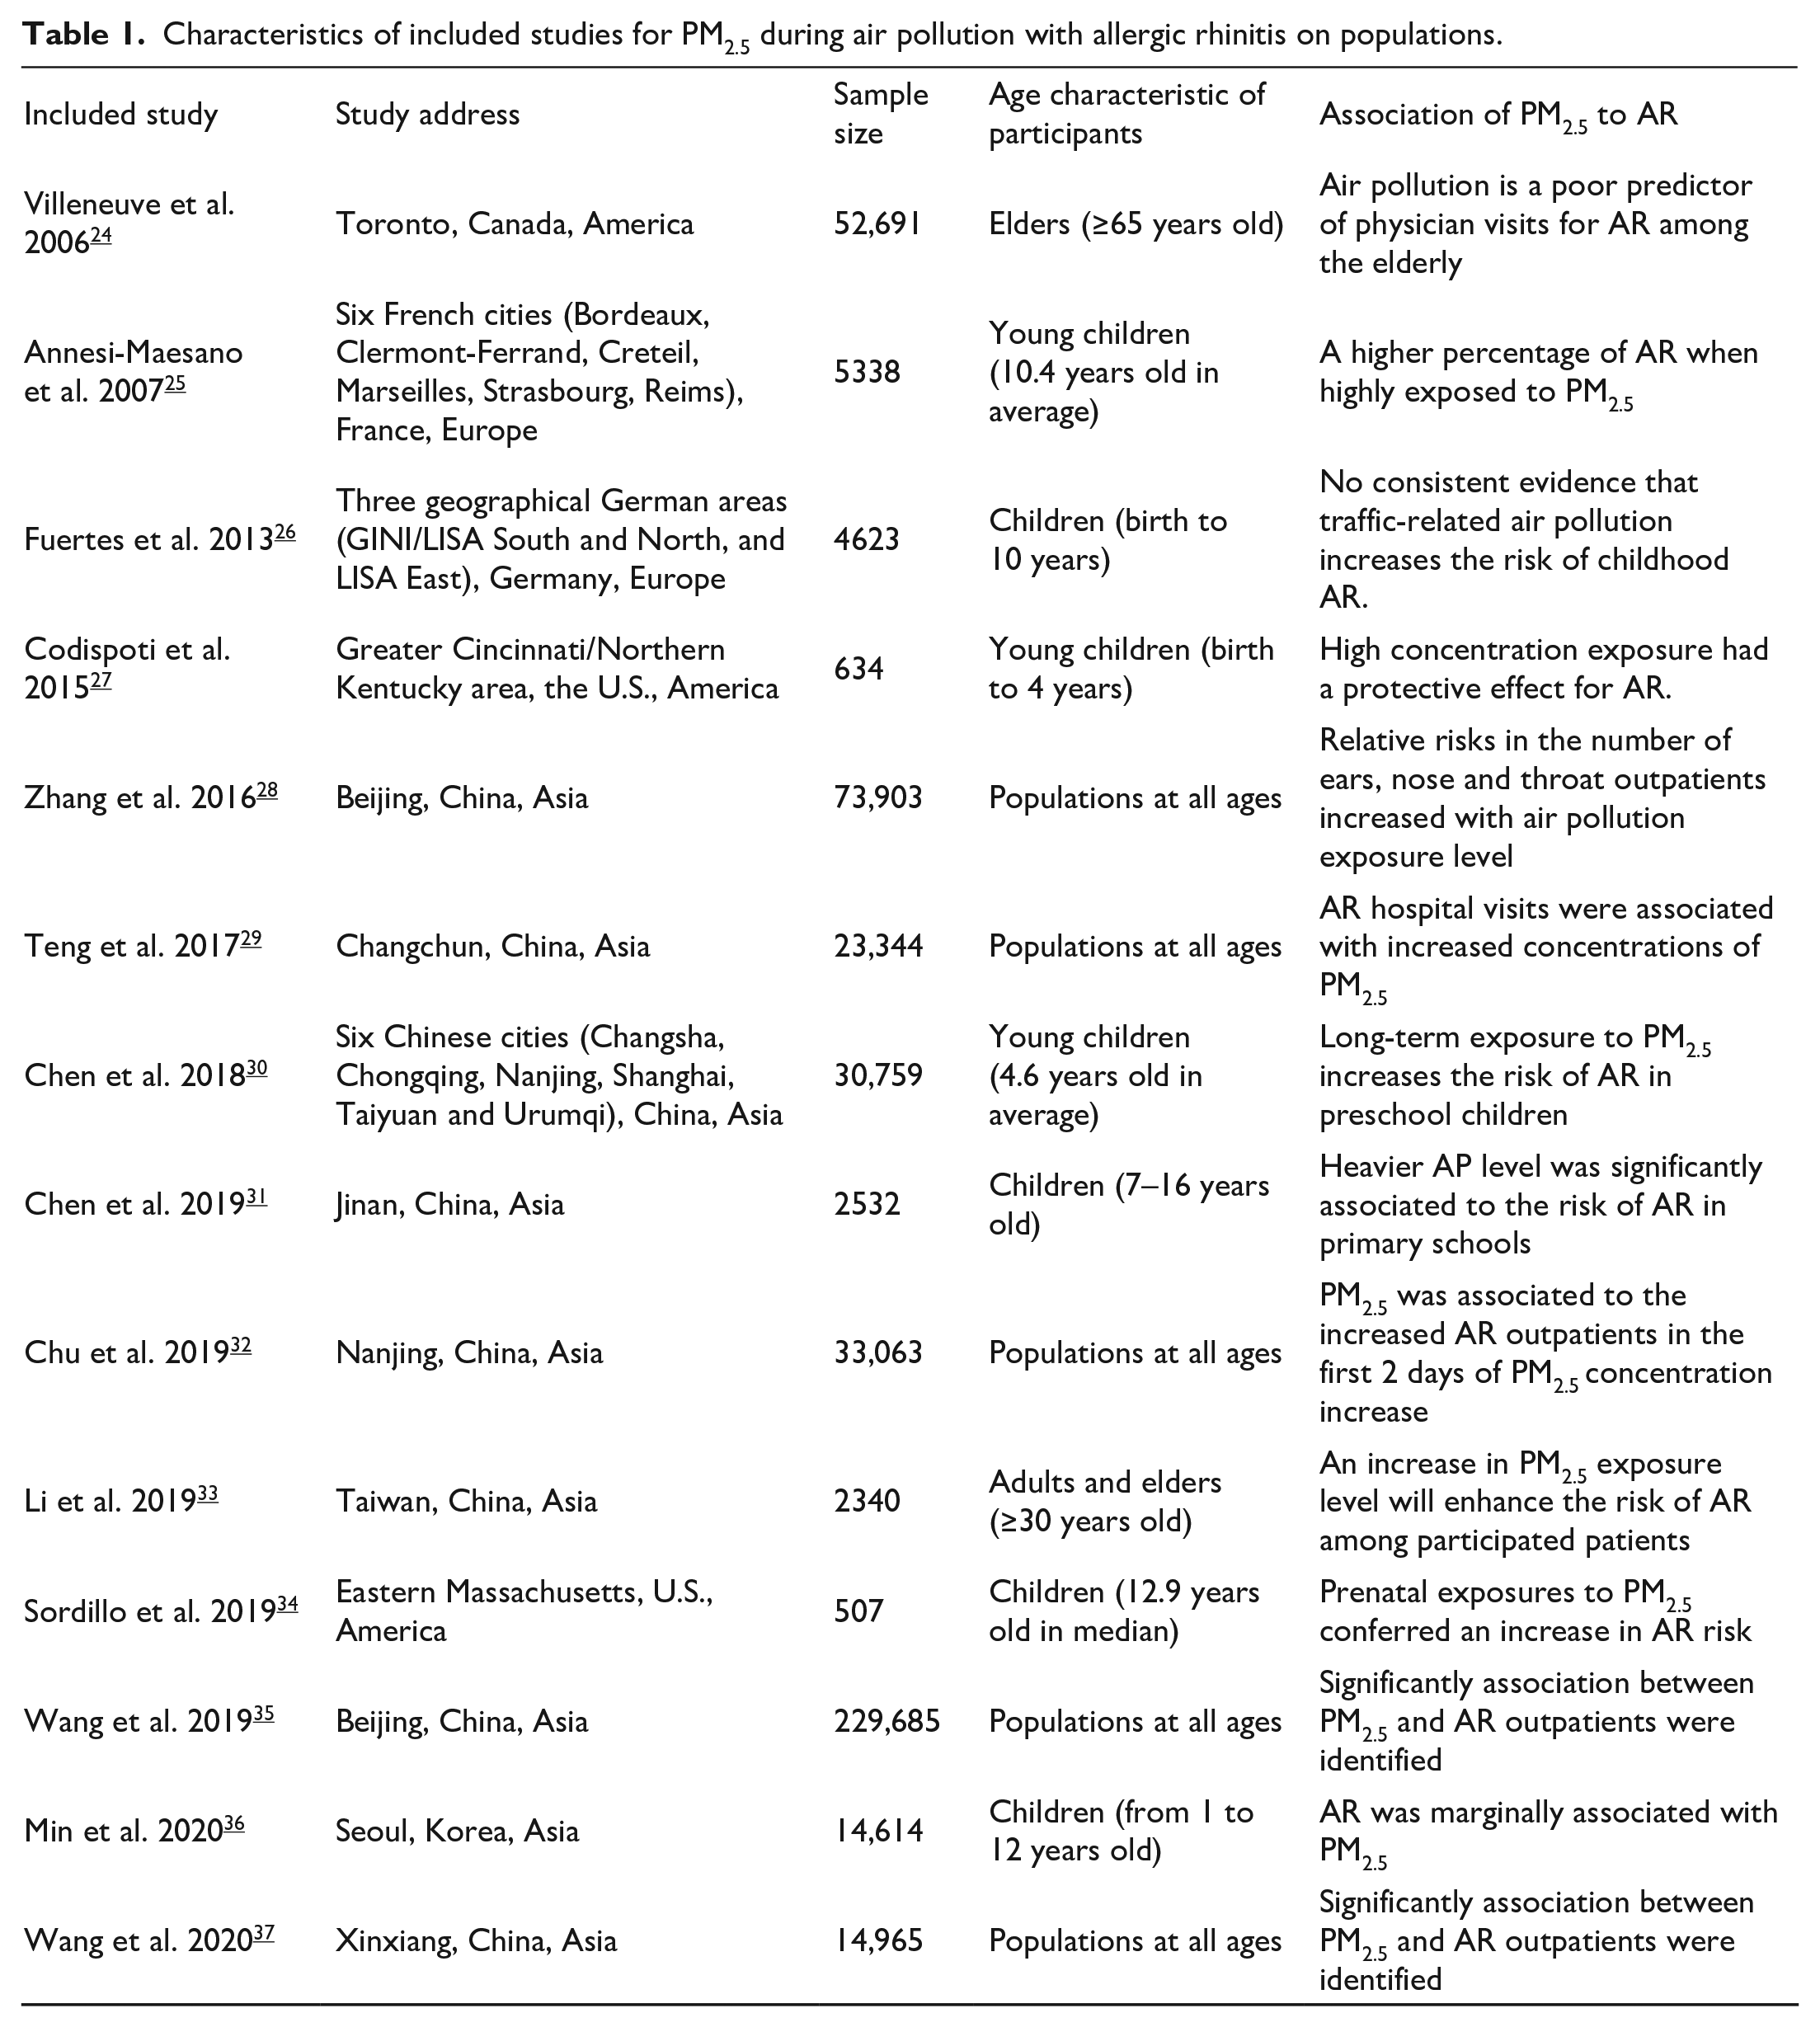
The included studies were published between January 2006 and April 2020. A total of 488,998 participants were included in the studies, including 426,738 AR outpatients. Of these 14 included studies, nine studies were carried out in Asia, two studies in Europe and three in North America. The average concentration range of PM2.5 in Asia was 18.2–2056.0 μg/m3, whilst the range in European countries was 15.4–23.0 μg/m3, and in North American countries was 4.4–320.0 μg/m3.
Additionally, seven studies carried out their observations on children, five studies among populations of all ages, one study on adults and elders, and another one study on elder participants aged over 64 years. Table 1 describes the characteristics of the included studies. The four studies on populations at all ages reported that PM2.5 exposure was identified as being significantly association with the risk of AR.28,29,32,35,37 A study from elder population in Toronto argued that AP was a poor predictor of physician visits for AR among the elderly 24 ; whilst another study on a population aged more than 30 years old in Taiwan reported that PM2.5 obviously caused the increase in AR risk, especially during the first 2 days of PM2.5 concentration increase. 33 Regarding the other seven studies that reported the results of observation on children, five studies recognised a significant association between increased PM2.5 concentration exposure and higher AR risk,25,27,30,31,34 whilst another study on children in three geographical German areas found no consistent evidence for the association between AP and AR, 26 and the other study on children in Korea reported a marginal association between PM2.5 exposure and the risk of AR. 36
Characteristics of included studies for PM2.5 during air pollution with allergic rhinitis on populations.
Study quality appraisal
Regarding the methodology, the included studies used cohort study designs or cross-sectional designs. The quality appraisal of the included studies was extracted and reported on the basis of an adapted NOS scale. 20 To determine quality, a study was considered very good when the sum up of stars reached the maximum number of 9. All 14 papers were rated as very good on methodological qualities, as all these papers were rated as full stars. The results of the assessment of bias risk in these studies (including six cohort studies and eight cross-sectional studies) could be found in Supplemental Appendix 2.
Contribution of PM2.5 to allergic rhinitis
Of the 14 included studies, seven studies provided ORs corresponding to AR and their 95% CIs for exposure to increased PM2.5 concentrations, and these seven papers were carried out in communities.25–27 ,30,33,34,36 Corresponding forest plots and estimations were analyzed accordingly. Additionally, the verification of heterogeneity analysis was mainly performed using sensitivity analysis and the Cochran Q statistical test. For the sensitivity analysis, the results were more stable overall in our analyses. Because the heterogeneity was p =.05, I 2 = 79%, we used the random effect method for evaluation. Figure 2 shows the forest plots with reported ORs and relevant 95% CIs for the seven papers. Accordingly, ORoverall = 1.14, 95% CI are 1.00–1.29. The test result for overall effect was Z = 1.98, and p =.05; the overall test result was not statistically significant.
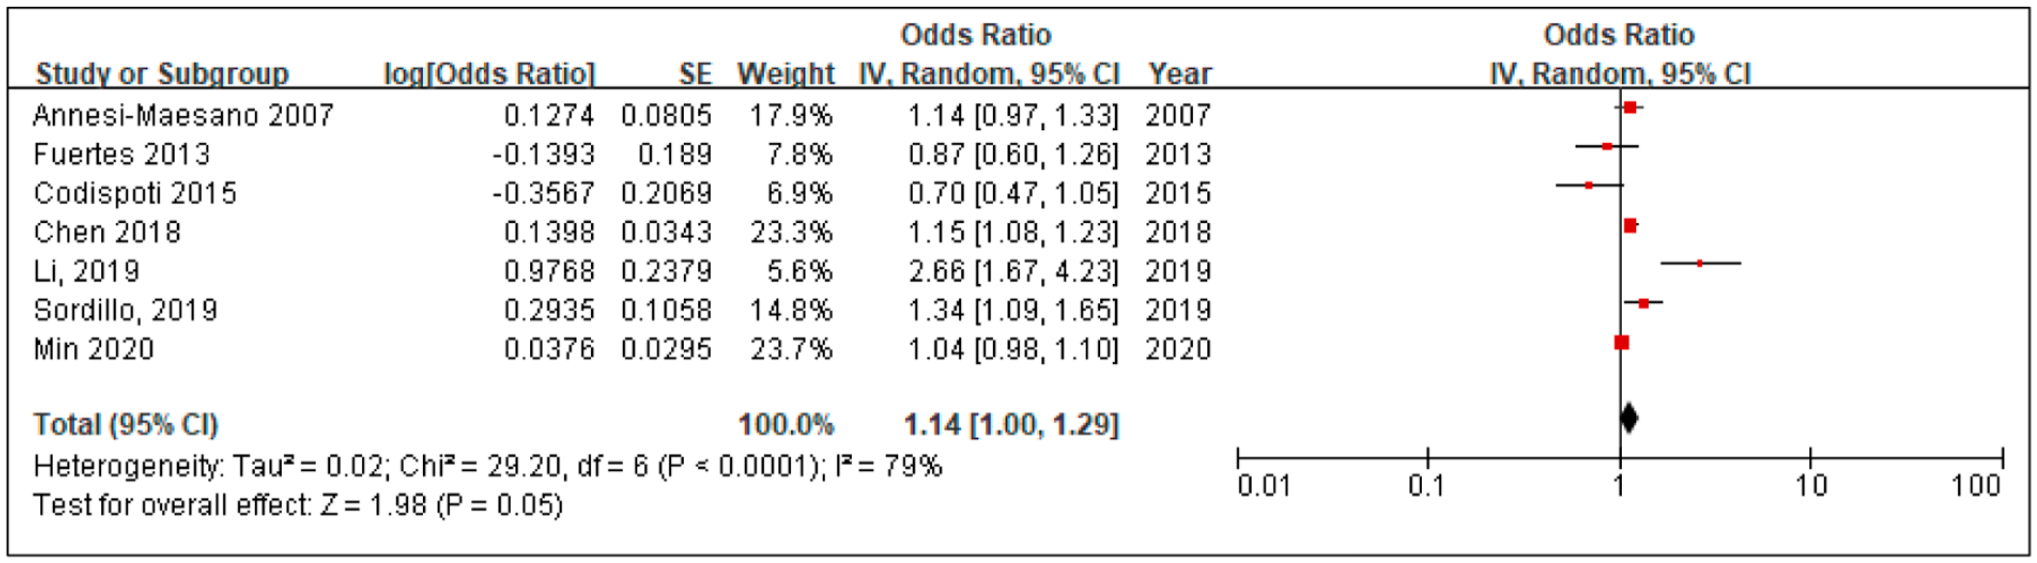
Forest plots of the risk of PM2.5 with allergic rhinitis.
A subgroup of studies reported on the association of PM2.5 within or outside of Asia were evaluated. Because seven papers reported statistical findings for the association between PM2.5 and AR, we drew forest plots for these papers with their reported values for ORs and 95%CIs. Hence four papers on PM2.5 and AR in Asia were selected in this study, whereas three papers were selected as a subgroup for risks outside of Asia. Since the heterogeneities were PAsia = 0.04, I 2 = 89%, POut-Asia = 0.76, I 2 = 70%, the random effects method was used for evaluation. Figure 3 shows a group of forest plots with the risks reported in the included papers. Accordingly, ORAsia = 1.20, 95% CI are 1.01–1.44; whilst OROut-Asia = 1.04, and 95% CI are 0.82–1.31.
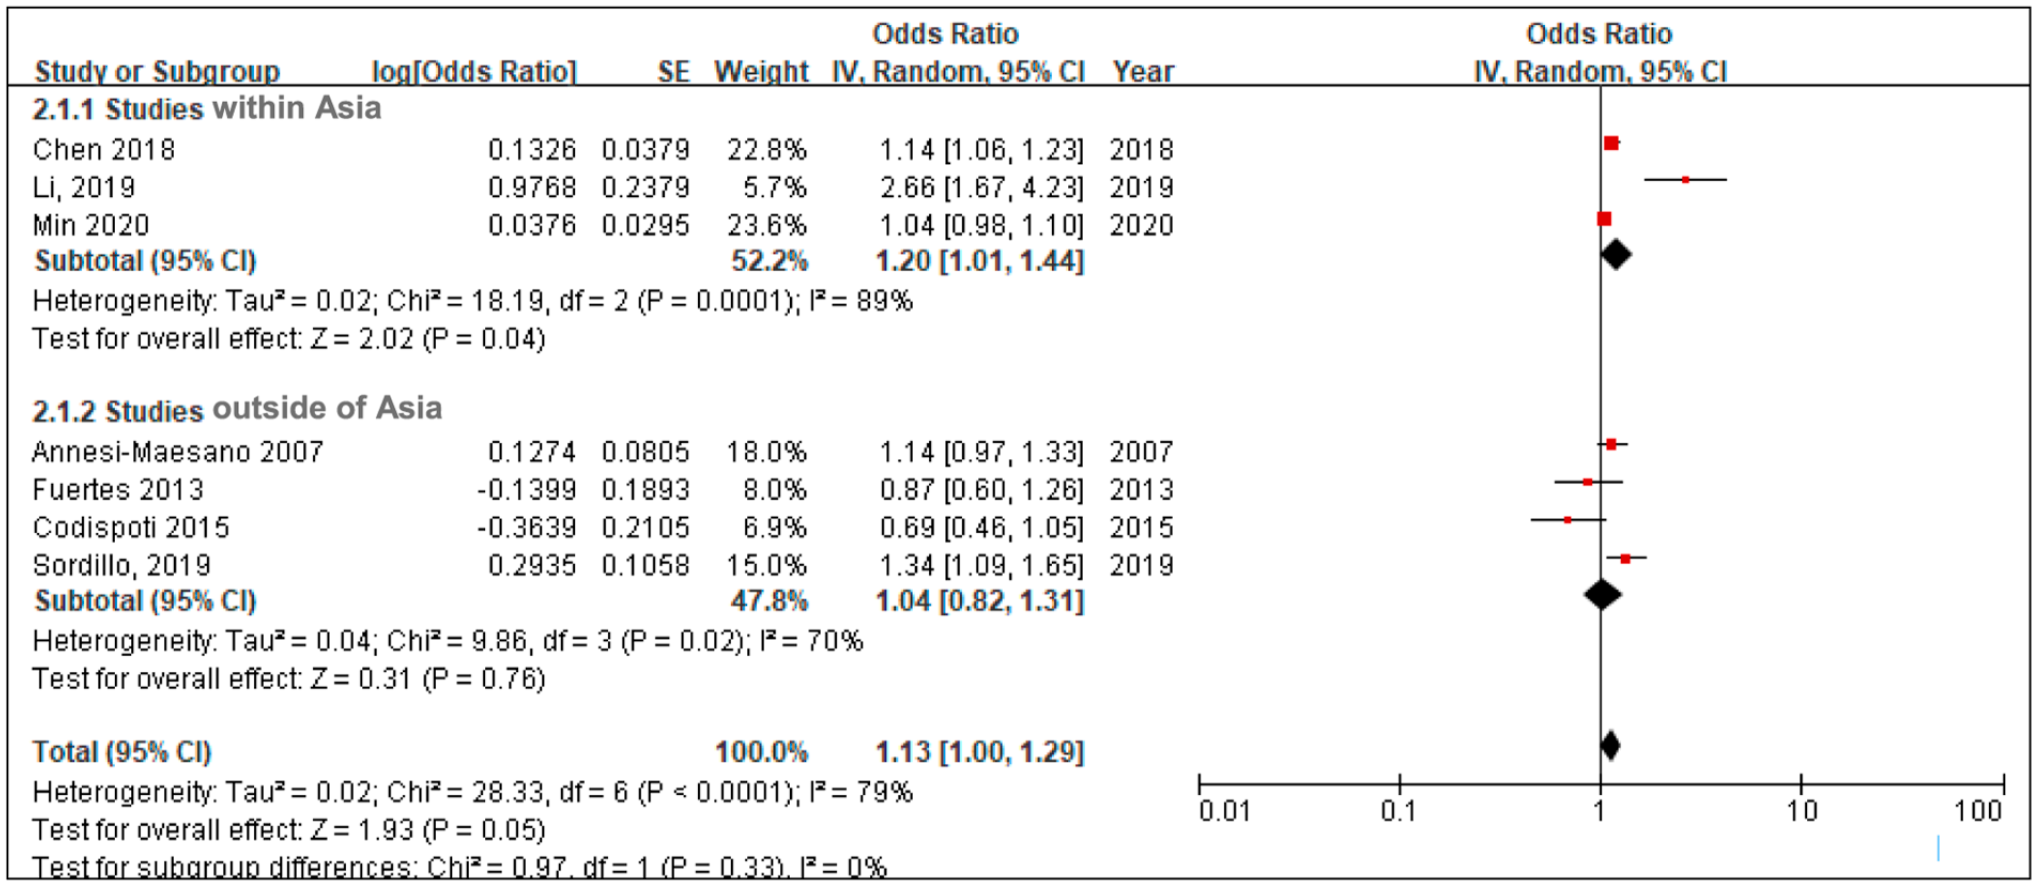
Forest plot figures for subgroups of studies within and outside of Asia.
Of these seven papers, five reported the study results of the relationship between PM2.5 and AR in children (aged from birth to 12 years),25–27 ,30,36 one reported the relationship in teenagers, 34 and one in adults. 33 We created forest plots as reported ORs and 95% CIs from these seven papers as three age-related subgroups. Since the heterogeneities were PChildren = 0.02, I 2 = 64%, PTeenager and PAdult were not applicable because there was only one included study for each of the two subgroups. The random effects method was used for evaluation. Supplemental Appendix 3 shows a group of forest plots with reported risks for the subgroups of different ages. The heterogeneity of the subgroups overall was p <.01, and I 2 = 79%; the test result for overall effect was Z = 4.43, and p <.01. According to the results from the analysis, ORChildren = 1.08, 95% CI ranges from 1.04 to 1.13; OROther ages = 1.50, 95% CI ranges from 1.24 to 1.81.
Results of publication bias test and sensitivity analysis
The figures of funnel plot for publication bias test results and results of sensitivity test were summarized in the Supplemental Appendix 4. The results of publication bias test showed that there is no statistically significant publication bias (the p value of the Begg’s test was 0.7639 and of Egger’s test was 0.1069, and the funnel plot did not show asymmetry obviously (see Figure A4). The result of sensitivity analysis shows that the combined OR and the 95% CI will not change significantly after excluding a study, thus, the analysis result suggests stable and reliable original meta-analysis results.
Discussion
AR is a multifactorial, common respiratory disease induced by an interaction between the genes and the environment. 38 It has been argued that PM is the most representative and harmful pollutant among various air pollutants because of its high surface area to volume ratio, and it is particularly harmful to paediatric health. 20 However, how important PM2.5 to the risk of AR is not yet well-known. To our knowledge, this is the first systematic review and quantitative summary of the association between PM2.5 and the risk of AR at all ages on a global level. A total of 14 studies were included in our review, including eight cohort studies and six cross-sectional studies. Regarding the countries and regions of these studies, nine studies were developed in Asia; three were from North America; and two were from Europe. A total of 488,998 participants were observed in the 14 included papers, including 426,738 AR patients. Additionally, a quality assessment of the included papers showed a low risk of bias in study selection, comparability and outcome sections.
Our meta-analysis found that an increase in PM2.5 concentration would enhance the risk of suffering from AR (see Figure 2). PM2.5 originates from various combustion sources (diesel and gasoline engines, biomass burning and coal combustion) and non-combustion sources (road dust, including sea spray aerosols, ammonium sulphate, ammonium nitrate and secondary organic aerosols), and these are known as the major sources of PM2.5.13,18,22,39 Evidence has shown that the incidence of allergic disease is higher in areas of poor air quality than in other areas.26,31 The largest study, having 229,685 AR outpatients, included in our review found that per each 10 μg/m3 increase in concentration of PM2.5, there was a 0.47% increase in daily hospital outpatients for AR in China. 35 PM2.5 aggravates AR symptoms through the high production of IgE to activate mast cells and eosinophils, which results in increasing vascular permeability, mucus secretion, blood vessel dilation and stimulation of the sensory nerves.13,14 PM2.5 can also interact with other allergens to enhance their allergic responses by recruiting both neutrophilic and eosinophilic. 14 Moreover, PM2.5 has been shown to induce DNA methylation changes in vivo, which are believed to contribute to AR susceptibility. A genome-wide association meta-analysis of AR in 13,000 European adults showed that genetic variations in thymic stromal lymphopoietin (TSLP), Toll-like receptor 6 (TLR6), and nucleotide-binding oligomerisation domain containing 1 (NOD1/CARD4) were involved in susceptibility to AR. 40
In the region subgroup analysis, we found that the effect of PM2.5 on AR was particularly noticeable in Asia. This result could be explained by the developing industrial activities and motor vehicle emissions in Asian countries, which produce ambient AP and decreased air quality. 41 A meta-analysis identified a stronger significant influence of PM2.5 on AR in developing countries than in other countries. 20 The heterogeneities of our study were large, due to the different control variables between the included studies. Factors such as the timing of the cohort studies and the control of the outcome may be the affiliated causes (20). Nevertheless, environmental issues have gained great adverse effects on human health.2,8,11,42 In the latest WHO report, the PM2.5 concentration in Southeast Asia (57 μg/m3) and the Western Pacific Region (43 μg/m3) were two times higher than in the other regions. 43 Hence, global strategies for the comprehensive reduction of PM2.5 still need to be organised and implemented. Such a global strategy should include limiting industrial and vehicle PM2.5 production, as well as transitioning to new energy technologies that produce more environmentally friendly emissions. For example, Germany has developed a federal strategy of air quality control, including federal environmental quality standards, the best technology-based emission reduction requirements available, product regulations, and emissions ceilings. 44 Reducing ambient PM2.5 and incorporating AR into primary health care requires a whole-of-society approach. 45 In communities, the establishment of scientific, high-efficiency network management in primary healthcare services for AR patients and AR-susceptible populations is essential. 45 A framework that includes treatment and outcome management for AR patients, as well predictive measurement and a pre-allergic disease warning system for community populations at AR risk needs, is needed to be established. In addition to being based on the interaction between doctors, patients and meteorological departments, this framework should also be based on 4Ps basis defines as: predictive basis (risk assessment for allergic disease development and exacerbation), preventive basis (comprehensive evaluation of the environmental contributors to allergic disease burden), participatory basis (appropriate interventions to reduce individual- and environment-related factors as well as effectiveness evaluations) and personalised basis (improvement of intervention compliance by patient promotions on preventive interventions through effective health communication). 46
In our review, PM2.5 may simultaneously impact AR risk in populations of all ages. Children, adults and the elderly who have AR or who are susceptible to AR can initiate prevention. Firstly, high-efficiency particulate air filters with more than 95% filtration efficiency can improve indoor environments 47 ; secondly, when people are outdoors, wearing masks (especially KN95) and using nasal allergen-blocker mechanical barrier gel quite helpful. 48 Additionally, mobile applications, such as ‘Allergy Diary’ can realise the real-time monitoring of the atmosphere, guide medication and offer advice for travelling. 49 Children with severe AR can do next-generation sequencing to identify AR-related genes, to confirm a diagnosis, instruct the use of allergy medicine and guide eugenics. However, the analysis results show a significant heterogeneity between different age groups. This may because the detailed age-related subgroups such as infants, children, teenager, adults and elders, are not applicable because of data limitation. Another potential reason is that the participants of the included studies resided in different living environments. Thus, further studies on the risk difference between age groups would be an interesting research topic.
Limitations
To our knowledge, this study is the first systematic review that summarises the associations between PM2.5 and the risk of AR in populations of all ages across countries and regions based on worldwide studies worldwide. However, due to the varied methodological statistics used in the included studies and the limited number of studies, as well varied living environments in which the participants resided, the results showed both non-significant differences in effect among age-related groups and a significant heterogeneity. Hence, based on the development of further research and reports on the topic of the impact of PM2.5 on human health, further studies on the topic of comparation in different age groups of people could be expected. Moreover, the diagnosis of AR based on symptoms such as sneezing, a runny and blocked itchy nose which is fully compliant with national guidelines. Thus, patients having hay fever patients and those having perennial rhinitis are mixed according to symptoms. However, because the study periods of the included papers were longer than 1 year, the proportion of both should not be high.
Conclusion
This is the first systematic review and meta-analysis on the contribution on PM2.5 to the risk of AR. In our results, PM2.5 was found to be a risk factor for AR, and this risk was more significant in Asia than in the rest of the world. However, the included studies from Europe and North American regions showed a less significant risk of AR from PM2.5. Furthermore, the attributions of PM2.5 to AR risk among age-related subgroups showed fewer significant differences. These findings highlight the need for multifaced atmospheric control policies combined with population health management by government departments.
Supplemental Material
sj-docx-1-eji-10.1177_1721727X221089839 – Supplemental material for Association of fine particulate matter to allergic rhinitis: A systematic review and meta-analysis
Supplemental material, sj-docx-1-eji-10.1177_1721727X221089839 for Association of fine particulate matter to allergic rhinitis: A systematic review and meta-analysis by Xiaofei Jia, Zhengzheng Shen, Rongrong Liu, Yue Han, Yanzhong Yang, Qi Chen and Naichao Duan in European Journal of Inflammation
Supplemental Material
sj-docx-2-eji-10.1177_1721727X221089839 – Supplemental material for Association of fine particulate matter to allergic rhinitis: A systematic review and meta-analysis
Supplemental material, sj-docx-2-eji-10.1177_1721727X221089839 for Association of fine particulate matter to allergic rhinitis: A systematic review and meta-analysis by Xiaofei Jia, Zhengzheng Shen, Rongrong Liu, Yue Han, Yanzhong Yang, Qi Chen and Naichao Duan in European Journal of Inflammation
Supplemental Material
sj-docx-3-eji-10.1177_1721727X221089839 – Supplemental material for Association of fine particulate matter to allergic rhinitis: A systematic review and meta-analysis
Supplemental material, sj-docx-3-eji-10.1177_1721727X221089839 for Association of fine particulate matter to allergic rhinitis: A systematic review and meta-analysis by Xiaofei Jia, Zhengzheng Shen, Rongrong Liu, Yue Han, Yanzhong Yang, Qi Chen and Naichao Duan in European Journal of Inflammation
Supplemental Material
sj-docx-4-eji-10.1177_1721727X221089839 – Supplemental material for Association of fine particulate matter to allergic rhinitis: A systematic review and meta-analysis
Supplemental material, sj-docx-4-eji-10.1177_1721727X221089839 for Association of fine particulate matter to allergic rhinitis: A systematic review and meta-analysis by Xiaofei Jia, Zhengzheng Shen, Rongrong Liu, Yue Han, Yanzhong Yang, Qi Chen and Naichao Duan in European Journal of Inflammation
Footnotes
Authors’ contributions
XF J. and NC D. were responsible for the initial study concept and contributed to the study design. XF J. and ZZ S. developed the search strategy and carried out the article screenings and data extraction. YZ Y. and NC D. settled any discordance between the reviewers as an additional reviewer. XF J. and Q. C. analyzed data and drafted the manuscript. XF J. provided editing of the manuscript. XF J. and NC D. provided critical review of the manuscript and approved the final version for submission. All authors have read and agreed to the published version of the manuscript.
Declaration of conflicting interests
The author(s) declared no potential conflicts of interest with respect to the research, authorship, and/or publication of this article.
Funding
The author(s) disclosed receipt of the following financial support for the research, authorship, and/or publication of this article: This work was supported by the Hebei Key Programs of Medical Research from Health Commission of Hebei Province (Grant No.20180298).
Availability of data and materials
The datasets used and/or analyzed during the current study are included in this article and Supplemental Appendixes 1, 2 and ![]() .
.
Supplemental Material
Supplemental material for this article is available online.
References
Supplementary Material
Please find the following supplemental material available below.
For Open Access articles published under a Creative Commons License, all supplemental material carries the same license as the article it is associated with.
For non-Open Access articles published, all supplemental material carries a non-exclusive license, and permission requests for re-use of supplemental material or any part of supplemental material shall be sent directly to the copyright owner as specified in the copyright notice associated with the article.