
Abstract
Hemorrhagic shock (HS) induces a compensatory endocrine and cytokine response which aims to restore homeostasis. This response can be modulated by general anesthetics. To our knowledge, no studies have evaluated if etomidate modulates this response in experimental HS. After being premedicated with buprenorphine (0.05 mg/kg subcutaneously), male Wistar rats were anaesthetized with 5% isoflurane and divided into three groups: G1 (control, n = 16), G2 (n = 13), and G3 (n = 14). G2 and G3 were subjected to HS by collecting 30% of their blood volume and resuscitated 90 min later with the collected blood and normal saline, in a 1:3 ratio, respectively. G3 received etomidate (1 mg/kg IV) before HS. Blood gas analysis, adrenocorticotropic hormone (ACTH), corticosterone, and plasma levels of tumor necrosis factor (TNF)-α, interleukin (IL)-6, IL-10 and of TNF-α, IL-6, and IL-10 mRNA obtained through real-time polymerase chain reaction (RT-PCR) were measured at 0, 90, 150, and 240 min after HS induction. Compared with G2, etomidate-treated animals had significantly lower corticosterone, PO2, PO2/FiO2, base excess and HCO3, and higher TNF-α, IL-6, IL-10, and TNF-α mRNA levels (P <0.05). Etomidate-treated rats showed impaired adrenal and increased cytokine response to HS and evidence of worse tissue oxygenation and lung dysfunction. Based on these results, and until further studies are performed to confirm if these findings occur in clinical patients, we suggest that etomidate should be used cautiously in HS.
Keywords
Introduction
Hemorrhagic shock (HS) is a common complication from accidental and surgical injury, being responsible for significant morbidity and mortality. HS-associated tissue hypoperfusion, hypoxia, and secondary infection trigger a neuroendocrine and inflammatory response, which increases cytokine production and release and which aims to restore hemostasis. 1
The management of the HS patient may include the use of general anesthetics. It is known that anesthetics have modulatory properties in the stress and cytokine response to critical illness. Whether this modulation is beneficial or deleterious is still incompletely understood. It is most probable that its impact will depend on factors such as type, dosage, and route of administration of the anesthetic, the nature of the underlying condition, and host factors.
Etomidate is considered one of the anesthetics of choice for rapid sequence induction and intubation in critical illnesses, including HS. Etomidate does not inhibit sympathetic tone and has a minimal influence in myocardial function and blood pressure, 2 maintaining cardiovascular stability in hemodynamically unstable patients. 2 Etomidate also has adrenal suppressive properties through direct enzymatic inhibition of hormone synthesis, which are manifest even when the drug is administered in single bolus. 2 It has been shown that etomidate-associated adrenal suppression affects the stress response to experimental sepsis3,4 and surgery. 5
Etomidate also has effects on the immune system. Some of these are related with etomidate-associated suppression of endogenous corticosterone (CS) production, which leads to increased inflammatory responses, including augmented systemic cytokine levels. 3 However, direct effects of etomidate in the immune system have also been demonstrated by several studies.6,7 How etomidate exerts these effects is incompletely understood although it is known that the drug can inhibit NFκB nuclear translocation. 8
Whether etomidate’s associated adrenal suppression has an impact on the morbidity and mortality of critically ill patients is still being debated, and in particular regarding septic shock. In trauma patients, etomidate has been associated with increased incidence of pneumonia and acute respiratory distress syndrome (ARDS), 9 and increased duration of intensive care and hospital stay. 10 In addition, a recent meta-analysis concluded that etomidate was associated with increased risk of developing critical illness-related corticosteroid insufficiency (CIRCI) and multi-organ failure in critically ill patients. 11 CIRCI is defined as an inadequate glucocorticoid anti-inflammatory activity in critically ill patients due to either insufficient glucocorticoid availability or to the presence of resistance/insensitivity to glucocorticoid actions at the cellular level. 12
The use of etomidate in HS has been reported in both clinical13,14 and experimental settings. 15 The latter studies were mainly performed to evaluate whether etomidate was able to maintain cardiovascular stability or whether hypovolemia induced significant changes in the drug’s pharmacokinetics and pharmacodynamics. To our knowledge, no clinical or experimental study has evaluated the influence of etomidate in the stress and cytokine response to HS. In addition, there are only two clinical studies which reported a possible influence of etomidate’s adrenal suppressive actions in the development of CIRCI following HS, with conflicting results.13,14
This study aimed to evaluate if etomidate interferes significantly with the hypothalamic–pituitary–adrenal (HPA) axis and cytokine responses to HS in a rat model. Our primary hypothesis was that this interference does occur and it is mainly manifested by a decreased CS production and an increased cytokine response. Our secondary hypothesis was that this interference in the endocrine and cytokine compensatory responses would be translated into pathological consequences, namely in metabolic indicators of tissue perfusion. To evaluate the HPA axis response, we measured adrenocorticotropic hormone (ACTH) and CS serum levels. The cytokine response was evaluated by measuring the serum levels of tumor necrosis factor-α (TNF-α), Interleukin 6 (IL-6), and Interleukin 10 (IL-10), and the correspondent cell-free cytokine’s mRNA. Finally, the influence of etomidate on tissue perfusion was assessed by performing blood gas analysis and the measurement of metabolic indicators such as lactate, bicarbonate, and base excess (BE).
Methods
All experiments were performed in accordance with the ethical standards of Faculdade de Medicina Veterinária da Universidade de Lisboa, in compliance with the Portuguese legislation for the use of animals for experimental purposes (Decreto-Lei no. 129/92 and Portaria no. 1005/92, DR no. 245, série I-B, 4930-42) and with the European Union legislation (EU Directive 2010/63/EU).
Experimental animals
Twelve-week-old male Wistar rats (Rattus norvegicus) (Charles Rivers, Barcelona, Spain), weighing 250–450 g, were used in this study. We only used male rats because this gender is associated to a higher degree of organ damage with HS. 16 Animals were housed (n = 3 per cage) in a climate-controlled room under standard conditions (20–24°C; 12 h light/dark cycle). Water was provided ad libitum and food consisted of rat chow (Harlan, 2014 ®). All animals were acclimatized for seven days before the experiments, to minimize stress.
Study groups
Rats were randomly and blindly allocated to one of three body weight-matched groups: G1 (n = 16), G2 (n = 16), and G3 (n = 16). Randomization was made after attributing a piece of paper with a number to each animal. The animals were than allocated to each group in rotation based in a computer-based random number generator. Rats from G1 (the control group) were submitted to general anesthesia, mechanical ventilation, and surgical intervention. Rats from G2 had the same procedures as G1 but were also submitted to HS. Rats from G3 were treated exactly like G2, except that they received etomidate.
Experimental procedures
In Figure 1, the experimental procedures are described in the form of a diagram. A more detailed description will follow in the next sections.

Experimental time line. G1: control animals with general anesthesia, mechanical ventilation, and buprenorphine; G2: similar to G1 but also subjected to HS; G3: similar to G2 but also with etomidate administration. POP, preoperative period; SUR, surgical intervention; StP, stabilization period; IP, intermediate period (in G3 only, lasting 5 min); HS, hemorrhagic shock; RSC, resuscitation; M, maintenance stage; E, euthanasia; HP, histopathological analysis; Bup, buprenorphine; ETO, etomidate; ACTH, adrenocorticotropic hormone; CS corticosterone; TNF-α, tumor necrosis factor-α; IL-6, Interleukin 6; IL-10, Interleukin 10; TNF-α, circulating levels of mRNA of TNF-α; IL-6, circulating levels of mRNA of IL-6; IL-10, circulating levels of mRNA of IL-10. ETO was only administered in G3. In G1, after StP, the animals went directly to M until E because they did not have the HS and RSC stages.
Anesthesia and surgical procedure. Rats from all experimental groups were premedicated with 0.05 mg/kg buprenorphine (Budale®, Dechra, UK) to induce pre-emptive analgesia. Buprenorphine was injected subcutaneously, 20 min prior the induction of general anesthesia. General anesthesia was initiated by placing the animals in an induction chamber (World Precision Instruments, UK) previously saturated with 100% oxygen and 5% isoflurane (IsoFLo®, Abbott, USA). Once anesthetized, rats were moved and placed in dorsal recumbency over a water-based heated pad. Isoflurane anesthesia was maintained through face mask until placing the tracheostomy tube. ECG was registered continuously through lead wire probes (ECG; ML136 Animal Bio Amp, ADInstruments, UK). A respiratory sensor was placed over the thoracic wall to measure respiratory rate. A rectal probe (MLT1403, ADInstruments, UK) and an oximetry tail sensor (ADInstruments, UK) were placed to record continuously rectal temperature (kept in the range of 35–38°C) and pulse oximetry, respectively. The pedal withdrawal reflex was used to help in assessing the depth of anesthesia. The anesthetic plane was considered adequate if a toe pinch did not induce the withdrawal reflex. An intravenous catheter (Introcan®, 26 Gauge, B. Braun Medical, Portugal) was placed in the left femoral vein for fluid and drug administration. Another catheter was placed in the right external carotid artery and connected to a three-way stopcock for blood sampling and arterial blood pressure measurement. The carotid catheter and the three-way stopcock were connected to a fluid-filled pressure transducer (MLT844, ADInstruments, UK) which was connected to blood pressure amplifiers (ML221 Bridge Amp, ADInstruments, UK). Arterial blood pressure (systolic, diastolic, and mean arterial pressure [MAP]), ECG, rectal temperature, pulse oximetry, and respiratory frequency data were transmitted to a data acquisition unit (PowerLab®, ADInstruments, UK) where it was analyzed by a specific software (LabChart Pro®, ADInstruments, UK).
After placement of the carotid catheter, a tracheostomy tube was placed. Volume-controlled ventilation was initiated with a small animal ventilator (CWE Small Animal Ventilator, World Precision Instruments, UK). General anesthesia was maintained with isoflurane at concentrations in the range of 1.5–2%, administered through the tracheostomy tube. Oxygen was also delivered through the tracheostomy tube and the inspiratory fraction of O2 (FiO2) was maintained at 100% until the end of the experiment. Initial ventilator settings consisted in a tidal volume of 10 mL/kg and respiratory rate of 110–125 breaths/min. These parameters were adjusted as the experiment progressed, accordingly to the results of arterial blood gas analysis, in order to maintain normocapnia (35–45 mmHg) and normoxemia (arterial pressure of O2 [PO2] >85 mmHg). Once surgical instrumentation was completed, a 10-min recovery period was allowed before inducing HS in G2 and G3. This period permitted the recovery from the hemodynamic instability caused by initiation of mechanical ventilation. At T3 and after blood sampling, euthanasia was performed by pentobarbital administration (Eutasil®, Ceva, Portugal) at 100–150 mg/kg through the femoral catheter.
Sample collection and anesthesia monitoring. At four time points (T0, T1, T2, and T3), a sample of blood (500 µL) was collected. To prevent activation of the HPA axis following blood collection, after each sampling, 1 mL of normal saline was administered IV, except at T0 in G2 and G3, when blood collection coincided with HS induction. At T0, T1, T2, and T3, MAP, heart rate (HR), temperature, ECG, ventilator parameters, and depth of anesthesia were recorded. T0, the initial time point, was set at the end of the 10-min recovery period. T1, T2, and T3 were set at 90, 150, and 240 min post T0, respectively. HR and MAP collected at each time point were used for analysis and constituted the hemodynamic variables.
Immunological and hormonal variables. At all time points, plasma levels of TNF-α, IL-6, IL-10, ACTH, and CS were determined. To obtain plasma, blood samples were collected into 200 μL sterile heparin-coated tubes (FactorMed, Portugal) followed by centrifugation at 12,000 rpm for 15 min. Plasma was then stored at −20°C until further analysis. ACTH, CS (rat stress hormone panel Millipore, Arium Laboratórios, Portugal), TNF-α, IL-6, and IL-10 (Rat Cytokine/Chemokine, Millipore, Arium Laboratórios, Portugal) plasma levels were determined by Multiplex/Luminex technology, as described by others. 17
Metabolic variables. At all time points, 100 μL of blood was used to measure metabolic variables, including pH, PO2, arterial pressure of CO2 (PCO2), BE, HCO3, and lactate, through a portable blood gas analyzer (I-STAT Analyzer 300, I-STAT Corporation, Abbot, USA). The PO2/FiO2 ratio was calculated as the indicator of lung dysfunction.
Molecular biology variables: Sample collection, mRNA extraction, and cDNA synthesis. At all time points, the correspondent mRNA of TNF-α, IL-6, IL-10, and β-actin genes (β-actin was chosen as the reference gene) was determined in blood. For this, 200 μL of blood samples were collected into tubes containing RNA stabilizer specific for RNA extraction in animal blood (Qiagen, Hilden, Germany). After collection, samples were refrigerated at 4°C for 24 h until further processing. RNA was extracted from blood using the “Q-Amp RNA blood mini kit” (Qiagen), according to the manufacturer’s instructions. Once obtained, it was dissolved in diethylpyrocarbonate-treated water and stored at −70°C until further analysis. DNA digestion was performed with the RNase-free DNase Set (Qiagen) according to the manufacturer’s instructions. RNA concentration and purity were determined spectrophotometrically at 260 and 280 nm. cDNA was produced by using the “Transcriptor High Fidelity CDNA Synthesis Kit” (Roche, Portugal) as described by others. 18 Primer pairs for β-actin, TNF-α, IL-6, and IL-10 genes were designed from various exons using specific murine sequences obtained from the GenBank database, as shown in Table 1.
Primer sequences for IL-6, TNF-α, IL-10, and β-actin used for real-time polymerase chain reaction and obtained from the GenBank database.

IL-6, Interleukin 6; IL-10, Interleukin 10; TNF-α, tumor necrosis factor-α.
Relative quantification of TNF-α, IL-6, IL-10, and β-actin mRNA expression. TNF-α, IL-6, IL-10, and β-actin mRNA were quantified by fluorescence-based quantitative real-time polymerase chain reaction (RT-PCR) according to MIQE guidelines. 19 Amplicons for TNF-α, IL-6, IL-10, and β-actin were obtained by using an Applied Biosystems 7300 RT-PCR thermocycler machine (Perkin Elmer, Portugal) following the manufacturer’s instructions. 18 Data on relative mRNA quantification was analyzed using a RT-PCR Miner algorithm. 20
HS induction and resuscitation. At T0, after blood sampling, HS was induced in G2 and G3 by collecting 30% of blood volume (estimated as 54 mL/kg) 21 from the carotid artery. Blood collection was divided into two stages. In the first stage, the first 15% of the blood volume was collected in 10 min. The remaining 15% was collected in the next 20 min. By dividing blood collection into two stages of different velocities, we aimed to induce a more natural model of hypovolemia, as it was proposed by some authors. 22 Because our goal was to induce a mild state of HS, hemorrhage was stopped when 30% of the estimated blood volume was removed and/or when MAP reached and stabilized at 45 mmHg. In this way, the survival rate of the animals at the end of the experiment was 100%. All blood which was not used to determine hormonal, immunologic, metabolic, and molecular biology variables was collected into several 1 mL sterile aliquots previously filled with 0.12 mL of sodium citrate. Once filled, the aliquots were maintained in constant motion by using a laboratory agitator (LIC Instruments), until the blood was used in the resuscitation phase. The difference between the estimated and the amount of blood which was actually collected to induce HS (Δvolume) was determined for each rat. The individual Δvolumes were used to calculate an average Δvolume for G2 and G3.
At T1, after blood sampling, resuscitation was initiated by administering the collected blood with normal saline in a 1:3 ratio, respectively. Both fluids were warmed at body temperature and administered through the femoral vein catheter with a syringe pump (Perfusor® fm (MFC), B. Braun Medical, Portugal). The resuscitation phase lasted 30 min. Once resuscitation was completed, fluid therapy was maintained with warmed normal saline administered at maintenance rate (2 mL/kg/h) until the end of the experiment.
Etomidate administration. In rats from G3, 5 min before T0, etomidate (Etomidate®, Lipuro, 2 mg/mL, B. Braun Medical, Portugal) was administered by a single IV bolus at the dose of 1 mg/kg. This dose of etomidate was based on a previous study. 23 In this study, this dose corresponded to the ED50 to produce LORR in the animals studied. Furthermore, the study also demonstrated that when etomidate was administered at 2 mg/kg, it led to a significant decrease in MAP and HR which lasted several minutes. Because our main aim was to evaluate etomidate’s adrenal suppression in a HS model, we opted for using the lower dose. In this way we pretended to maintain etomidate’s adrenal suppressive properties and, at the same time, try to prevent significant hemodynamic changes. We were confident that this dosage of etomidate would be associated to adrenal suppression because etomidate’s potency for inhibiting 11β-hydroxylase, the enzyme involved in adrenal synthesis, is ⩾100-fold greater than its hypnotic potency. 23 The total volume of anesthetic solution was 0.5 ml/kg for each animal. In rats of G1 and G2, the same amount of normal saline was given instead of etomidate.
Statistical analysis
Statistical analyses were carried out with the Statistica software, version 8.0 (Statsoft Ibérica, Lisbon, Portugal). To perform the statistical analysis, a mixed linear model was applied to the data. Data were expressed as mean and standard error. For each variable, a two-way ANOVA was used where variance components were obtained through the Variance Estimation and Precision (VEPAC) Statistica module. Variance components in the model were estimated by restricted maximum likelihood (REML) estimation. Least squares (LS) means and standard errors for LS means were computed from the solution to the mixed model equations. Statistical significance was set at P <0.05.
Results
In all animals in G1, it was possible to obtain data for analysis. In three animals in G2 and two animals in G3, there were insufficient data for several types of variables and time points so these animals were excluded for analysis.
Hormonal variables
The analysis of hormonal variables is shown in Figure 2. ACTH levels were always higher in G3 than in G2, except at T3 where the opposite occurred. Its levels were also higher in G3 than in G1 at all time points. G2 also had higher levels of ACTH than G1 in all time points except T0. None of these differences reached statistical significance except the one between G2 and G3 with G1 at T1 (G2 with G1, P = 0.003; G3 with G1, P = 0.000). In both HS groups, ACTH reached its highest level at T1 (after HS). From here, ACTH concentrations evolved differently between G2 and G3. In G3, the values decreased progressively until the end of the experiment. In G2, the values decreased from T1 to T2 and then increased again from T2 to T3. A statistical significant interaction between ACTH and time was also found (P = 0.016).
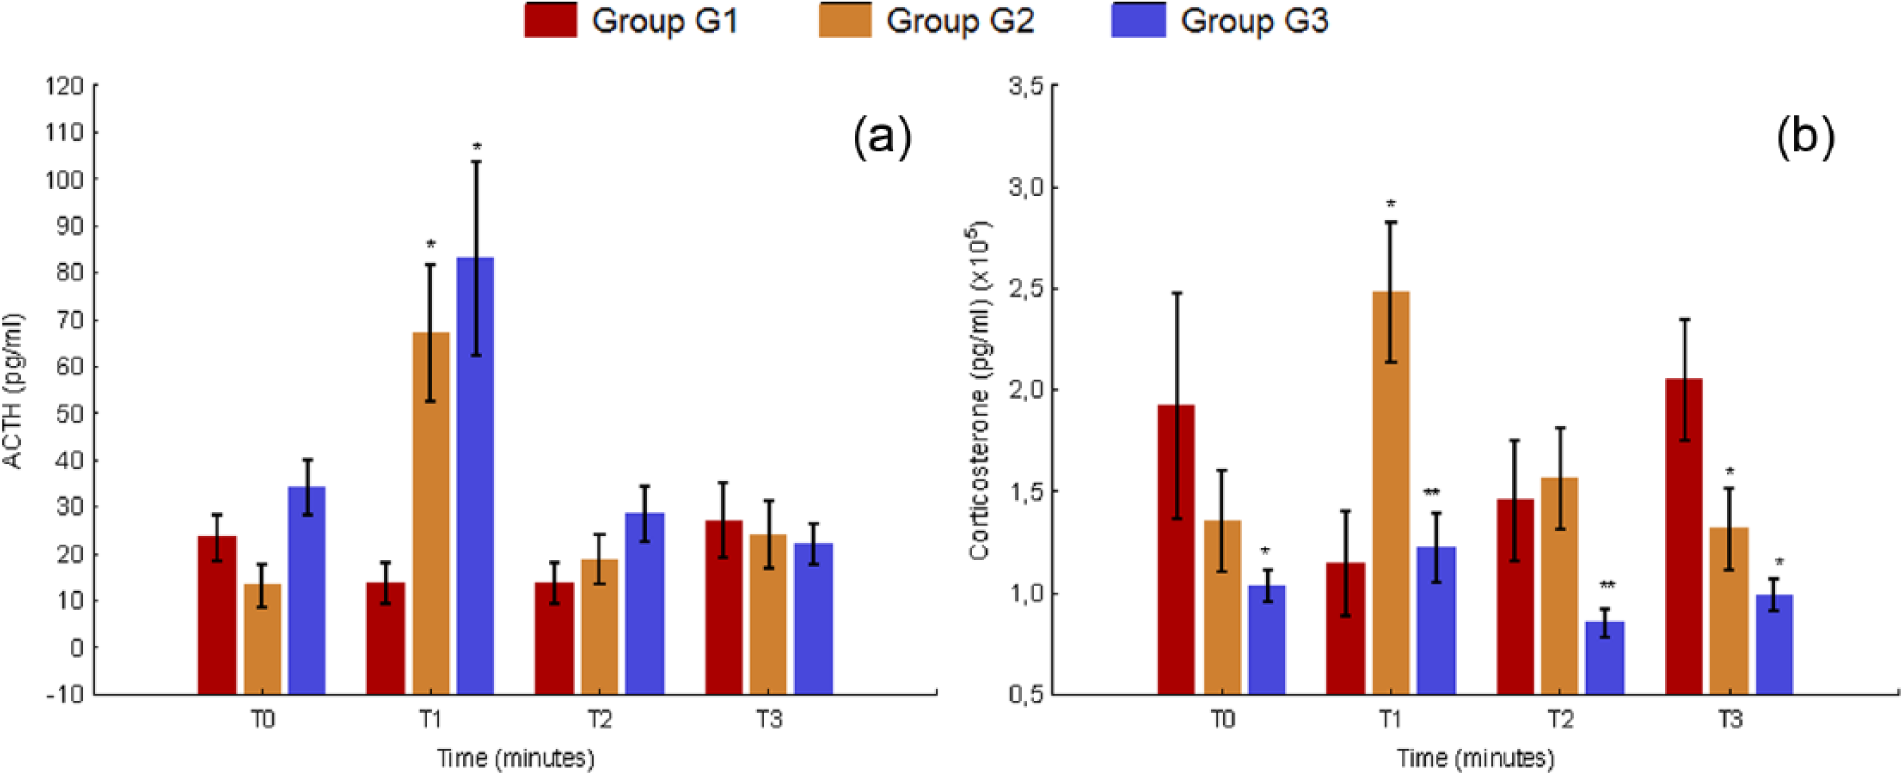
Variation of hormonal variables from T0 to T3 in G1, G2, and G3; (a) ACTH; (b) Corticosterone. G1: control animals with general anesthesia, mechanical ventilation, and buprenorphine; G2: similar to G1 but also subjected to HS; G3: similar to G2 but also with etomidate administration. Data are expressed as the mean ± SE. * indicates statistically significant differences between G2 or G3 and G1; ** indicates statistically significant differences between G2 and G3. Statistical significance was established at P <0.05. ACTH, adrenocorticotropic hormone.
Regarding CS, etomidate-treated rats always had lower levels of CS than G2 although significant differences were only found at T1 (P = 0.000) and T2 (P = 0.031). CS levels were also lower in G3 than in G1 at all time points except at T1 although the differences were only statistically significant at T0 (P = 0.049) and T3 (P = 0.001). G1 differed significantly from G2 at T1 (P = 0.000) and T3 (P = 0.046). CS highest and lowest levels were observed in G2 at T1 and G3 at T2, respectively. In G3, CS levels were lower than 10,000 pg/mL−1 at T0, T1, and T2. A statistical significant interaction between CS and time was also found (P = 0.004).
Immunological variables
Immunological variables are displayed in Figure 3. In G1 and G2, TNF-α was always below the lower limit of detection. In contrast, etomidate-treated rats had detectable levels of TNF-α at all time points. The differences between G3 with G1 and G2 were significant at T1 (G3 with G1, P = 0.049; G3 with G2, P = 0.050), T2 (G3 with G1, P = 0.014; G3 with G2, P = 0.020), and T3 (G3 with G1, P = 0.034; G3 with G2, P = 0.045). The differences between G1 and G2 were not statistically significant. In G3, the cytokine increased progressively until T2 and then decreased slightly at T3.

Variation of immunological variables from T0 to T3 in G1, G2, and G3; (a) TNF-α; (b) IL-6; (c) IL-10. G1: control animals with general anesthesia, mechanical ventilation, and buprenorphine; G2: similar to G1 but also subjected to HS; G3: similar to G2 but also with etomidate administration. Data are expressed as the mean ± SE. * indicates statistically significant differences between G2 or G3 and G1; ** indicates statistically significant differences between G2 and G3. Statistical significance was established at P <0.05. TNF-α, tumor necrosis factor-α; IL-6, Interleukin 6; IL-10, Interleukin 10.
IL-6 levels were always higher in G3 than in G1 and G2. However, these differences were only statistically significant at T3 (G1 with G3, P = 0.001; G2 with G3, P = 0.003). At the remaining time points there were no statistically significant differences between the three groups. Contrary to G1 and G2, where IL-6 levels were stable along the experiment, in G3 they increased continuously from T0 to T3.
IL-10 was higher in both HS groups when compared with G1 and higher in G3 than in G2 at all time points. However, the only statistically significant difference between the three groups was found between G3 and G1 at T2 (P = 0.003) and T3 (P = 0.004). Interestingly, the evolution of IL-10 levels in both HS groups was similar (although at higher levels in G3): in both groups, IL-10 increased progressively from T0 to T2 and then decreased at T3.
Metabolic variables
The metabolic variables are displayed in Figures 4 and 5. G1, G2, and G3 showed significant differences in pH (P = 0.000), PO2 (P = 0.000), PO2/FiO2 (P = 0.000), BE (P = 0.000), HCO3 (P = 0.000), and lactate (P = 0.014), but not in PCO2 (P = 0.266).
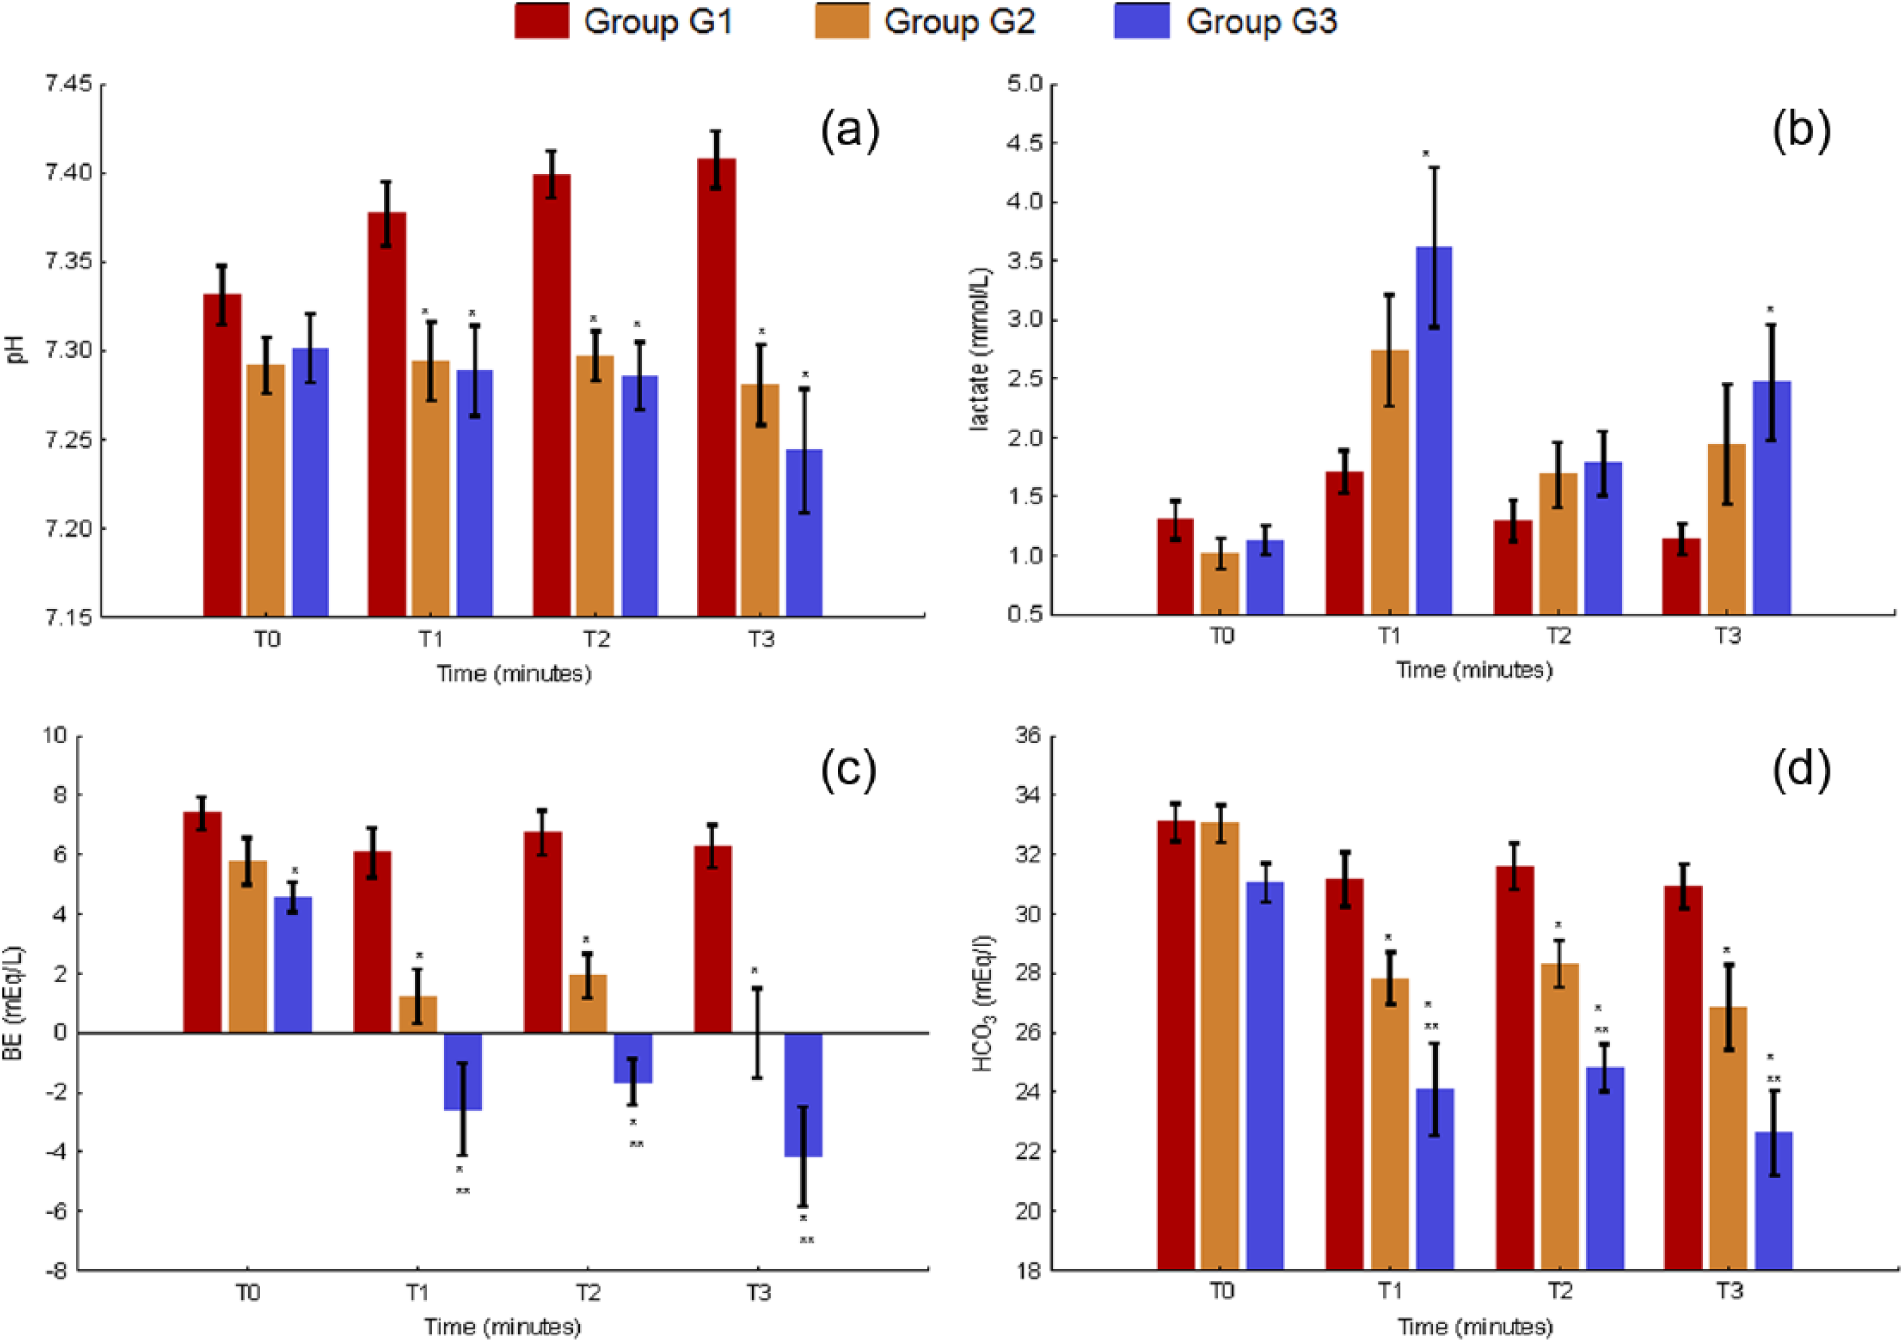
Variation of metabolic variables (pH, lactate, BE, and HCO3) from T0 to T3 in G1, G2, and G3. (a) pH; (b) lactate; (c) BE; (d) HCO3. G1: control animals with general anesthesia, mechanical ventilation, and buprenorphine; G2: similar to G1 but also subjected to HS; G3: similar to G2 but also with etomidate administration. Data are expressed as the mean ± SE. * indicates statistically significant differences between G2 or G3 and G1; ** indicates statistically significant differences between G2 and G3. Statistical significance was established at P value <0.05. BE, base excess.
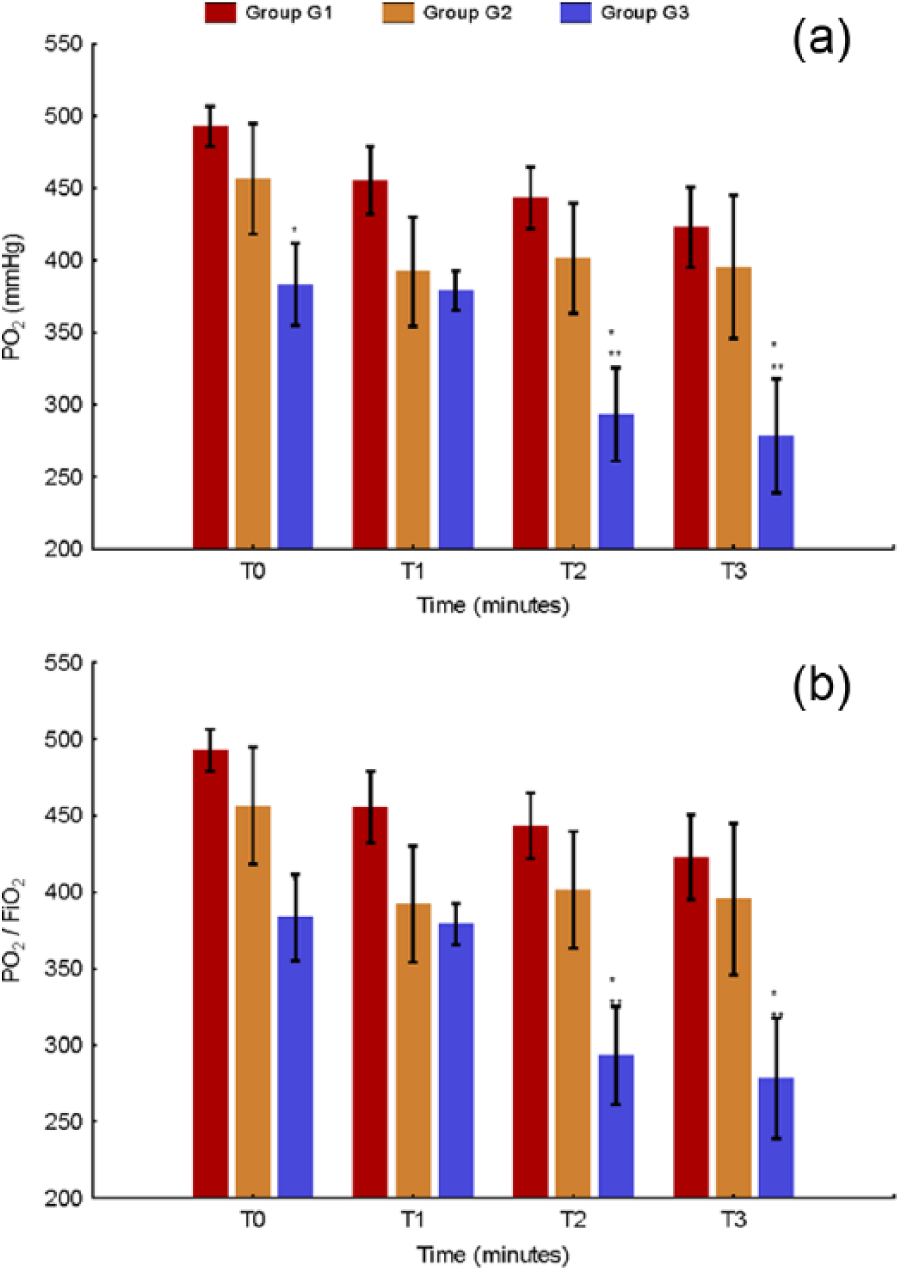
Variation of metabolic variables (PO2 and PO2/FiO2 ratio) from T0 to T3 in G1, G2, and G3. (a) PO2; (b) PO2/FiO2. G1: control animals with general anesthesia, mechanical ventilation, and buprenorphine; G2: similar to G1 but also subjected to HS; G3: similar to G2 but also with etomidate administration. Data are expressed as the mean ± SE. * indicates statistically significant differences between G2 or G3 and G1; ** indicates statistically significant differences between G2 and G3. Values that are significantly different between times in the same group are indicated by different lowercase letters. Statistical significance was established at P <0.05.
Both HS groups had lower values of pH than G1 and this difference was statistically significant at T1 (for G1 and G2, P = 0.005; for G1 and G3, P = 0.002), T2 (for G1 and G2, P = 0.000; for G1 and G3, P = 0.000), and for T3 (for G1 and G2, P = 0.000; for G1 and G3, P = 0.000). Except for T0, G3 always had a lower pH than G2 although the differences were not statistically significant in any of the time points. In both HS groups, pH decreased as the experiment progressed, with its lowest value being observed in T3. In G1, the opposite occurred, with pH increasing progressively towards T3, where it reached its highest level.
Lactate levels were higher in G3 than in G2 at all time points, although the differences were not statistically significant. The same occurred between G3 and G1 in T1 and T3, although in these the differences were statistically significant at T1 (P = 0.002) and T3 (P = 0.028). Both HS groups had higher levels of lactate then G1 except at T0, where the opposite occurred. The evolution of lactate levels was similar in both HS groups, reaching its highest level after hemorrhage, decreasing with resuscitation and having a last increase from T2 to T3.
BE values were always lower in HS groups than in G1. This difference was statistically significant between G1 and G3 at all time points (T0 with P = 0.042 and T1 to T3 with P = 0.000) and between G1 and G2 at T1, T2, and T3 (P = 0.000). The levels of BE were always lower in G3 than in G2, with this difference being statistically significant at T1 (P = 0.009), T2 (P = 0.014), and T3 (P = 0.005). Contrary to G1, where BE was stable across the experiment, in both HS groups BE progressively decreased from T0 to T3. A statistical significant interaction between BE and time was also found (P = 0.012).
The results of HCO3 paralleled those of BE differing in small aspects. At T0, the levels of HCO3 were similar between G1 and G2 and lower in G3, but no statistically significant difference was found between groups. From T1 to the end of the experiment, HCO3 levels were always lower in the HS groups than G1. The differences between G1 and G2 were statistically significant at T1 (P = 0.017), T2 (P = 0.019), and T3 (P = 0.04), and between G1 and G3 at T1 (P = 0.000), T2 (P = 0.000), and T3 (P = 0.000). G3 had always lower levels of HCO3 than G2, with these differences being statistically significant at T1 (P = 0.008), T2 (P = 0.014), and T3 (P = 0.004).
The PO2 of both HS groups was lower than in G1 at all time points. G3 differ significantly from G1 at T0 (P = 0.013), T2 (P = 0.000), and T3 (P = 0.001). The differences between G1 and G2 were not found to be statistically significant. The levels of PO2 were always lower in G3 than in G2, although they only reached statistical significance at T2 (P = 0.017) and T3 (P = 0.010). In addition, in G3 and G1 the levels of PO2 decreased continuously from T0 to T3. In the etomidate-treated groups, this was particularly marked after resuscitation (from T1 to T2). On the contrary, in G2, they decreased with hemorrhage (T0 to T1) but then remained stable until the end of the experiment.
The results of the PO2/FiO2 ratio were similar to the ones described for PO2. In etomidate-treated rats, the PO2/FiO2 ratio decreased progressively from T0 to T3, reaching values below 300 at T2 and T3.
Hemodynamic variables
The analysis of hemodynamic variables is shown in Figure 6. HR was always lower in G3 than in G2, a difference which was statistically significant at T2 (P = 0.049) and T3 (P = 0.005). HR was also lower in G3 than in G1 at T1, T2, and T3 although this difference was only statistically significant for T2 (P = 0.012). The HR of G1 and G2 did not differ statistically at any time point. Interestingly, in both HS groups, HR decreased as the experiment progressed, contrary to G1, where it increased continuously until T2. From here it decreased from T2 to T3.

Variation of hemodynamic variables from T0 to T3 in G1, G2, and G3; (a) heart rate; (b) MAP. G1: control animals with general anesthesia, mechanical ventilation, and buprenorphine; G2: similar to G1 but also subjected to HS; G3: similar to G2 but also with etomidate administration. Data are expressed as mean ± SE. * indicates statistically significant differences between G2 or G3 and G1; ** indicates statistically significant differences between G2 and G3. Statistical significance was established at P <0.05. MAP, mean arterial pressure.
Regarding MAP, no statistically significant differences were found between groups, except between G2 and G3 at T0. At this time point, MAP was significantly lower in etomidate-treated animals (P = 0.011). In G1 and G2, MAP decreased continuously from T0 to T3. In G3, it decreased from T0 to T1 (hypovolemia), increased with resuscitation (from T1 to T2), and suffered a new decrease from T2 to T3. Interestingly at T0 and T1, MAP was higher in G2 than in G3, but the opposite occurred at T2 and T3.
Molecular biology variables
Molecular biology variables are shown in Figure 7. We could not obtain mRNA from all rats at several time points. The levels of TNF-α mRNA were always higher in G3 than in the other two groups. Statistically significant differences were found between G3 and G1 at T0 (P = 0.002), T1 (P = 0.005), and T2 (P = 0.015). G3 differed from G2 in a statistically significant way at T1 (P = 0.004) and T2 (P = 0.019). Although TNF-α mRNA was numerically higher in G2 than in G1 no statistically significant differences were found between these two groups. The highest value of TNF-α mRNA expression was observed in G3 at T1, after hemorrhage. This was followed by a progressive decrease of its levels until the end of the experiment.

Variation of molecular biology variables from T0 to T3 in G1, G2, and G3; (a) logTNF-α; (b) logIL-6; (c) logIL-10. G1: control animals with general anesthesia, mechanical ventilation, and buprenorphine; G2: similar to G1 but also subjected to HS; G3: similar to G2 but also with etomidate administration. Data are expressed as the mean ± SE. * indicates statistically significant differences between G2 or G3 and G1; ** indicates statistically significant differences between G2 and G3. Statistical significance was established at a P <0.05.
No statistically significant differences were observed between the levels of IL-6 and IL-10 mRNA expression of the three groups. However, the levels of IL-6 and IL-10 mRNA were numerically higher in G3 than in G2 at all time points. In both HS groups, the highest level of IL-6 mRNA was found at T1. In G3, the highest level of IL-10 mRNA was also found at T1, whereas in G2 it was at T0.
Δvolume
Δvolume values for G2 and G3 groups are shown in Figure 8. Although Δvolume was higher in G3 than in G2, the difference was not statistically significant
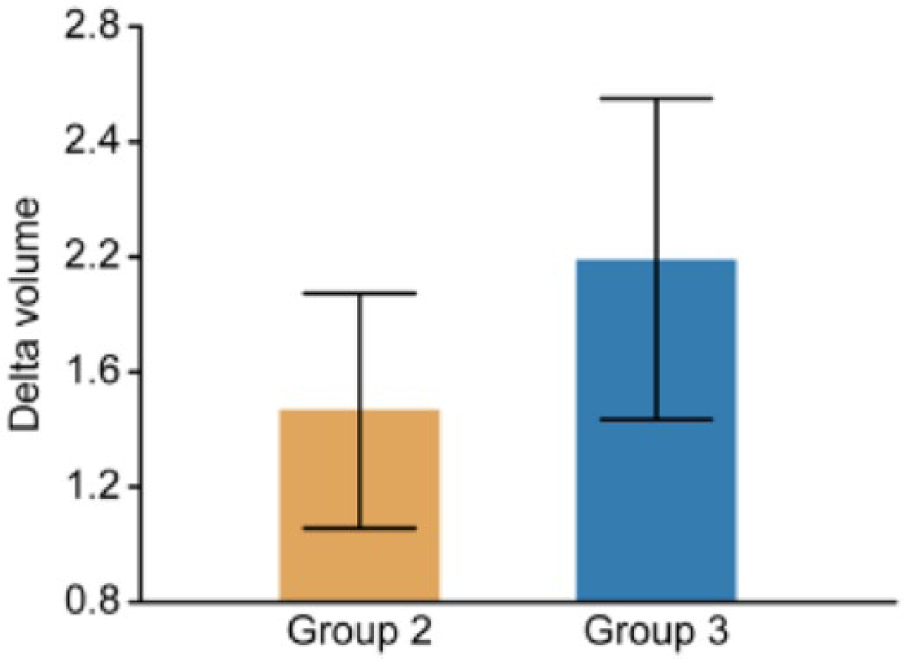
Δvolume in G2 and G3. G2: animals submitted to general anesthesia, mechanical ventilation, buprenorphine administration, and HS; G3: similar to G2 but also with etomidate administration. Statistical significance was established at P <0.05.
Discussion
This study demonstrated that etomidate administration to rats submitted to HS affected significantly the subsequent stress and cytokine responses to HS. It also increased tissue oxygen debt and was associated to a higher degree of lung injury.
Influence of etomidate on hormonal variables
Etomidate-treated animals had lower levels of CS than G2 at all time points. Although this was expected due to etomidate’s effects in adrenal function,23,24 a complete inhibition of the adrenal response to HS was not. Etomidate-treated animals also had levels of CS lower than 100,000 pg/mL at several time points. Levels of this order of magnitude were considered indicative of CIRCI in rat models of HS and acute necrotizing pancreatitis21,25,26 and in human clinical patients. 12 It is then possible that animals of G3 had CIRCI as well. CS levels were also lower than what has been reported in normal rats after etomidate administration. 23 Possible explanations for this include an increased potency and/or duration of action of etomidate associated to HS 15 or an increased metabolism of CS by hepatic 11β hydroxysteroid dehydrogenase (11β-HSD). The latter hypothesis is unlikely, however, because etomidate does not increase 11β-HSD activity 27 and HS is actually associated to an impairment of its activity. 26
ACTH secretion was also different between G2 and G3. In G3, despite the progressive decrease of CS levels from T1 to T3, there was no compensatory increase in ACTH secretion. It is unlikely that this was due to a direct effect of etomidate because this was associated to increased ACTH secretion 24 or from an interaction of etomidate with isoflurane, because isoflurane does not affect the stress response in rats.
An inhibition of ACTH release and dissociation between ACTH and cortisol levels has been described in critically ill human patients and attributed to high levels of atrial natriuretic peptide, endothelin, macrophage-inhibitory factor, cortisol, TNF-α, and IL-6.12,26 It maybe hypothesized that the higher levels of TNF-α and IL-6 in etomidate-treated animals could have interfered with ACTH secretion, but the role of other mediators remains unclear because they were not evaluated. In sepsis, decreased ACTH synthesis due to increased expression of inducible nitric oxide synthetase in hypothalamic parvocellular neurons has been reported. 28 To our knowledge, if the same also occurs in HS, it has not yet been reported.
Etomidate has been reported to impair the adrenal response to experimental septic shock.3,4 However, in these studies the decrease in CS levels was less marked and was followed by a compensatory increase in ACTH secretion. These differences with our results can be explained by differences in study methodology (e.g. different doses of etomidate between studies) or from differences in the pathophysiology of HS and sepsis. In addition, HS and sepsis might affect differently etomidate’s pharmacokinetic and pharmacodynamics.
Influence of etomidate on immunological variables
To our knowledge this is the first experimental study that describes a significant increase in the cytokine response to HS following etomidate administration. Etomidate was associated with increased systemic cytokine levels before, an effect which was mainly attributed to its adrenal suppression of glucocorticoid production.3,29 Increased cytokine levels following etomidate administration can also result from a direct effect of the drug in the immune system, as shown in several studies.6,7 How etomidate exerts these effects is still not completely understood, although in part, they seem to involve suppression of NFκB nuclear translocation. 8
Regarding our results, although a direct immune effect of etomidate cannot be ruled out, we believe that the increased cytokine levels of G3 animals were mainly due to the decreased CS levels. This hypothesis is the most plausible, based in available evidence, which includes both clinical and experimental studies. Increased cytokine levels following etomidate administration were found in adrenalectomized rats subjected to HS 30 and in models of septic shock,3,4,7 and also in critically ill patients with CIRCI. 29
In addition, by revealing the significant role of CS in modulating cytokine levels in this setting, this hypothesis can explain, at least partially, why G2 animals did not have increased TNF-α and IL-6 levels following HS. In G2 we believe that HS-associated increase in the systemic levels of TNF-α and IL-6 was refrained by the increased production of CS which followed HS. Furthermore, we hypothesize that our model, by being of mild hypovolemia, was associated with a modest increase in TNF-α and IL-6 levels. Although HS alone is able to increase TNF-α, recent studies suggest that a threshold of overall injury exists and must be exceeded before TNF-α elevations are observed in the circulation. 31 The increase of IL-6 is also related with the severity of HS. 31 In addition, studies with rats subjected to HS have shown that IL-6 increase is more related to soft tissue injury than TNF-α. 32 Because soft tissue injury was also mild in our model, when compared with other studies in the literature, a lower increase in IL-6 levels would also be expected. The mechanism on how severer injuries are associated with higher levels of TNF-α and IL-6 is still not completely understood. One hypothesis is that severer injuries lead to higher release of damage-associated molecular patterns, which subsequently induces a higher inflammatory response. All this considered, we believe that in G2, the mild severity of our model led to a modest pro-inflammatory response that was prevented from becoming systemic by the compensatory CS response that followed HS.
Finally, in G2, differences in citokine kinetics could have also contributed to our findings, especially regarding TNF-α. TNF-α’s half- life is very short (around 20 min), and to be detected the cytokine must be continuously released in significant amounts. Experimental studies have shown that its increase following HS peaks at around 30–60 min. From then on, its levels start to decrease, becoming undetectable several hours later. 32 In our experiment, T1 was set at 90 min. It is possible that at this time TNF-α’s peak levels were missed, especially because its levels were not expected to be much increased, as previously explained.
Influence of etomidate on metabolic and hemodynamic variables
In HS, the development of increased lactate and decreased pH, HCO3, and BE levels is indicative of decreased tissue perfusion and higher tissue oxygen debt. Consequently, this means that etomidate-treated rats had a higher degree of hypoperfusion and tissue oxygen debt than animals of G2.
Hypoxemia, acute lung injury, and etomidate
One reason that can explain the higher tissue oxygen debt of etomidate-treated animals could have been their higher degree of arterial hypoxemia. This in turn can be explained by several possibilities. One is the known effect of etomidate to increase alveolus-arterial oxygen gradient and intrapulmonary shunting. 33 Another was the development of a progressive lung dysfunction, manifested by the continuous decrease of the PO2/FiO2 ratio, which reached levels below 300, indicative of acute lung injury (ALI) in human patients. To our knowledge, this is the first experimental study where etomidate is associated with the development of lung injury. In clinical patients, however, etomidate had already been associated with an increased risk of developing ARDS 9 and hospital-acquired pneumonia. 10
Why etomidate-treated animals developed a higher degree of lung dysfunction than G2 animals remains unclear. One possibility is that etomidate directly promoted lung injury through its pro-oxidant properties, 34 although to our knowledge, this has not been reported. Another possibility was that the increased systemic and local inflammation associated with decreased CS levels aggravated a lung injury which was initiated by other mechanisms. These include HS itself, 1 mechanical ventilation, supplementation with 100% oxygen for several hours, and resuscitation with large volume of crystalloids. Although plausible, this hypothesis needs to be confirmed in future studies.
Hypoperfusion and etomidate
The administration of etomidate was associated with a significantly lower MAP at T0. This can in part justify why HS was more easily induced (as suggested by a higher Δvolume) in etomidate-treated animals. However, the higher Δvolume, and in particular the lower HR and MAP of etomidate-treated animals at T1, when compared with G2, can also reflect an interference by etomidate in the compensatory cardiovascular response to HS. 1 This would be more likely to occur if the effects of etomidate were potentiated and/or extended for longer periods than normal. Interestingly this is what was reported in other study in rats, where HS changed etomidate pharmacokinetics to the point of increasing its potency and duration of action. 15 To further corroborate this hypothesis, it is also known that etomidate at higher concentrations decreases systemic vascular resistance. 35 An increase in etomidate’s potency and duration of action could also justify the lower HR of G3 animals found at T2 and T3, although we cannot rule out that this resulted from other factors such as increased cytokine levels and systemic acidosis.
Because corticosteroids act together with catecholamines to induce the normal cardiovascular response to HS, 1 it may also be hypothesized that its lower levels in G3 could have contributed to the possible impairment of that response. To our knowledge, this has not been reported in HS. In addition, in G3, at T2 and T3, when CS was at its lowest level, MAP was actually higher than in G2. Why etomidate-treated animals had a higher MAP after resuscitation remains unclear. Possible explanations include a compensatory increase in vasoactive substances such as vasopressine, norepinephrine, and renin following the decrease in CS levels 36 or a protective effect of higher ACTH levels in preventing vascular dysfunction. 37 Finally, it is also possible that the increased cytokine levels of G3 also aggravated HS-induced microcirculatory disturbances, 1 further compromising tissue oxygen debt. Thus, through a combination of effects in both the macrocirculation and microcirculation, etomidate might have contributed to increased tissue hypoperfusion and oxygen debt.
Influence of etomidate on molecular biology variables
Etomidate-treated rats had significantly higher levels of TNF-α mRNA expression. Although increased tissue expression of TNF-α mRNA in several organs following HS has been reported before, to our knowledge, this is the first studying which reported increased plasma levels of cell-free cytokine-mRNA in HS. These findings should be considered preliminary because the use of this technique to evaluate the immune system is very recent and many of its aspects still require validation. However, it may be hypothesized that the increased plasma levels of TNF-α mRNA of etomidate-treated animals were related to the “relative deficiency” of CS, because glucocorticoids decrease cytokine expression through transcriptional and post-transcriptional mechanisms. Other possible explanations include the increased levels of TNF-α, which induces its own expression or a direct role of etomidate in gene expression. 8
This study had several limitations. One is that etomidate was administered before the induction of HS. Clinically, etomidate is normally administered in patients who are already or were in HS, and consequently when the compensatory systemic inflammatory and endocrine response is already underway. It is possible that in these circumstances, etomidate administration leads to different effects. We also used a model of HS of mild severity. Although it is plausible that in more severe cases the results would be similar and even potentiated, this remains unproven. To clarify these issues, future studies which included the administration of etomidate during or after HS and where HS is of higher severity should be performed. In some animals it was not possible to obtain mRNA of enough quantity and quality. If this was related to methodological issues which need to be refined or to some specific aspect of HS is currently unknown, although it might have limited our analysis especially regarding IL-6 and IL-10. Finally, HS was induced in young male Wistar rats. Because the response to HS is strongly influenced by gender, strain, and age, 16 it is possible that these findings are specific to this model.
In conclusion, in this rat model, etomidate was associated with a significant impairment of the HPA axis’s response and a significant modulation to the cytokine response (at genomic and protein levels) to HS. These findings might have an impact on both research and clinical settings. In the research setting, etomidate administration may interfere with data interpretation and become a source of experimental error. On the other hand, it can be used to induce a state of “artificial adrenal insufficiency,” providing an opportunity to model this condition in HS and other critical illnesses. In the clinical setting, these results suggest that etomidate should be used cautiously in HS and in patients with pulmonary complications, especially ALI/ARDS, until studies confirm if these findings occur in clinical patients.
Footnotes
Acknowledgements
The authors thank CIISA/FMV for financial support (Project PEst-OE/AGR/U10276/2014, funded by Fundação para a Ciência e a Tecnologia-FCT). We acknowledge Dr. Jeanne Kehren for revising the final version of the manuscript and Dr. Tiago Rafael for assistance during the experimental procedures.
Declaration of conflicting interests
The author(s) declared no potential conflicts of interest with respect to the research, authorship, and/or publication of this article.
Funding
This work was supported by Fundação para a Ciência e a Tecnologia-FCT (Project PEst-OE/AGR/U10276/2014).