
Abstract
Health state prediction is an effective way to improve the reliability for sensors. In the process of sensor degradation, it is difficult to obtain more effective monitoring data. And in the classification of health states, how to identify the adjacent state is also a problem. This paper proposed a health state prediction model based on belief rule base (BRB) and membership function (MF), which is called BRB-MF. In the model, BRB can make full use of expert knowledge and poor effective data. In the prediction results of BRB, it may be not completely logical or not entirely appropriate facing adjacent states of sensor. In order to solve the problem, MF is used to continue the analysis of the predicted results of BRB. In the BRB-MF model, the covariance matrix adaptation evolutionary strategies (CMA-ES) optimization algorithm is used to update the model parameters to make up for the uncertainty of expert knowledge. In the end, the brightness sensor of the rail vehicle LED lighting system is taken as a case study. The results show that the BRB-MF model can predict the health state of sensor with a high accuracy and a reasonable state.
Introduction
Sensors play important roles in engineering field, such as condition monitoring, pattern recognition, and automatic control, which make a significant contribution in the field of engineering practice. The accuracy of information collected by sensors can affect the normal operation of research object. Besides, the health states of sensor can affect the accuracy of information collected. So, it is necessary to establish a health state prediction model for sensor, which can guarantee the work in a normal health state.1,2 A reasonable health state prediction model can achieve optimum maintenance decision-making and effectively reduce the casualties and economic losses caused by system failure.
The methods of health state prediction for sensors can be divided into three categories: analytical-based models, data-driven-based intelligent learning models, and qualitative knowledge-based models. In a research object with an accurate math model, the analytical-based model has been widely used, such as Kalman Filter3,4 and improved Kalman Filter.5,6 However, it is difficult to establish a unified mathematical model which can predict the health states of sensors precisely due to the wide variety of sensors. In recent years, data-driven-based intelligent learning models have been rapidly developed and extensively applied. This method can achieve the health prediction problem of the nonlinear model through a large amount of effective monitoring data, with a high accuracy.7–9 For example, the literature 10 studied a health prediction model of sensor system based on data-driven intelligent learning model under extreme condition. This paper takes driverless car’s sensor system as research object to verify the advantage of this model, the result shows that the data-driven model has a high accuracy. However, the final evaluation results are parameter indicators, which have no actual physical meaning. Besides, the date-driven-based health state prediction model needs a huge number of effective monitoring data, while there is limited effective fault data in actual environment. So the date-driven-based health state prediction model cannot be used widely. The literature 11 focused on the sensor system of machine tool during the intelligent control and health management. This paper combines the neural network algorithm and data-driven methods, a typical “black box system,” which makes the result of the health states less interpretable. The most representative method is expert system during the qualitative knowledge-based health state prediction models.12,13 The literature 14 designed a sensor online diagnosis system by expert knowledge, which solves the problem of “redundancy” in the process of sensor health prediction. Nevertheless, owing to the subjectivity of expert knowledge, this health state prediction model is extremely dependent on expert knowledge, which leads this model to a low accuracy.
The above methods need a large amount of monitoring data or extremely rely on expert knowledge. It is difficult to establish a health state prediction model only through monitoring data in many occasions because the effective monitoring data which can reflect the health states of sensor is poor. The methods which extremely rely on expert knowledge cannot guarantee the accuracy of health state prediction model. So it is necessary to establish a health state prediction model which can use limited effective monitoring data and expert knowledge.
BRB is an advanced and widely used method which can combine the limited monitoring data and expert knowledge to establish models making contributions to fault diagnosis, fault probability prediction, health state assessment, etc.15–19 In the field of health state assessment and prediction, the traditional BRB model cannot give the reasonable health state, like the state when the sensor is between two neighbor states. In actual engineering, it is necessary to determine the membership related to different health states, which can provide a reasonable basis for sensor replacement and maintenance. In order to solve the problem, this paper proposed a health state prediction model based on BRB-MF. In the BRB-MF model, BRB is used to predict the health states by poor effective data of sensor, and MF as a fuzzy evaluation method is used to calculate the membership related to different states by the relationship between failure probability and health states of sensor.
This paper is organized as follows. In Section “Problem formulation,” the problem is formulated. In Section “The proposed health state prediction model based on BRB-MF,” the health prediction model based on BRB-MF is established, and the detailed steps are described. Section “Case study” presents a case study for brightness sensor of LED lighting system in rail vehicle. Finally, the conclusions are given in Section “Conclusions.”
Problem formulation
Based on above discussion, this paper focuses on the following three problems to establish a health state prediction model by using poor effective data and expert knowledge to determine the membership related to different health states of sensor.
In order to solve the above problems, the process of the health state prediction model of sensor contains three steps: 1. Sensor failure mechanism analysis to exert health state feature, health states classification. 2. Faulty probability prediction of sensor. 3. Determine the membership of different health states by MF.
It is assumed that the failure probability of sensor is represented by


where
Thus, the health state prediction model of sensor can be described as:
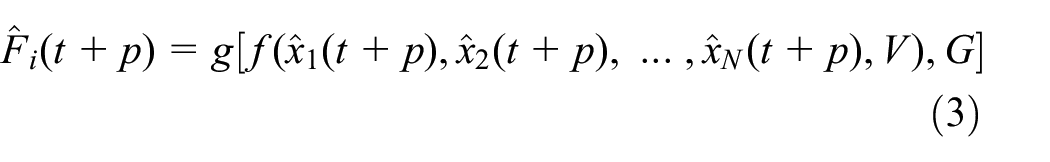
where

where M denotes the set of health prediction model.
So the health state prediction model can be described as:

where
This paper focuses on how to establish a nonlinear model, which contains g, f, h, and determines the model parameters V, G, M.
The proposed health state prediction model based on BRB-MF
This paper proposed a health state prediction model based on BRB-MF for sensor, the structure of BRB-MF is shown in Figure 1. This model contains three parts: Part I is sensor failure mechanism analysis to confirm health state features and establish health states evaluation system for classification. The function of Part II is setting a faulty prediction model to achieve prediction of sensor failure probability. It is by Part III that we can obtain membership of different health states, achieving the goal that predicts the health state of sensor.

Health prediction model of sensor based on BRB-MF.
Failure mechanism analysis of sensor
For example, when a doctor diagnoses with a cold, the doctor needs to know the patient’s temperature, whether he has a dry cough, and other information related to the cold given the patient an appropriate treatment plan. So it isn’t important if the lipid of patient is normal or not. Thus, it is extremely important that find the appropriate health state features by failure mechanism analysis of sensor before predicting the health state of sensor. The schematic diagram of failure mechanism analysis is shown in Figure 2.

Flow chart of failure mechanism analysis.
According to the failure size of sensor, the sensor failure form can be divided into soft fault and hard fault. The hard fault is fault caused by the damage of the sensor’s own structure and the general change is particularly large. The sensor cannot work properly when a hard fault occurs. Thus, if the sensor has a hard fault, we can replace it immediately. During the using process of sensor, the soft fault is that the sensor produces phenomena such as deviations, drifts, drop in accuracy level of measurement data, and so on, whose degree of change is particularly small. And, it is difficult to find it when the soft fault occurs, and the serious consequences will be incalculable in the event of a soft fault occurs for a sensor. 20 Therefore, it is very important to analyze failure mechanism of sensor according to the type of sensor. Based on this, it is easy to find the features of sensor, which can reflect health state of sensor.
Besides, the health state prediction results of current studies can only judge whether the health state of sensor is “Healthy” or “Faulty.” Obviously, the way of classifying health states is very unreasonable, and it is difficult to judge the states of sensor is “soft faulty” or not, which the accuracy of measurement data will be affected. Therefore, it is necessary for us to classify different health states of sensor with different corresponding “Security description” and “Risk description,” which can make reasonable plans for maintenance and replacement. 21
Failure probability prediction model based on BRB
Time series prediction and failure probability based on BRB
By analyzing the failure mechanism of a certain sensor, it is easy to find the health state features which can reflect the health state of sensor. The BRB model can combines limited effective monitoring data of certain sensor and expert knowledge to predict the monitoring data in time series. 22 The kth rule of time series prediction based on the BRB is shown in equation (6):
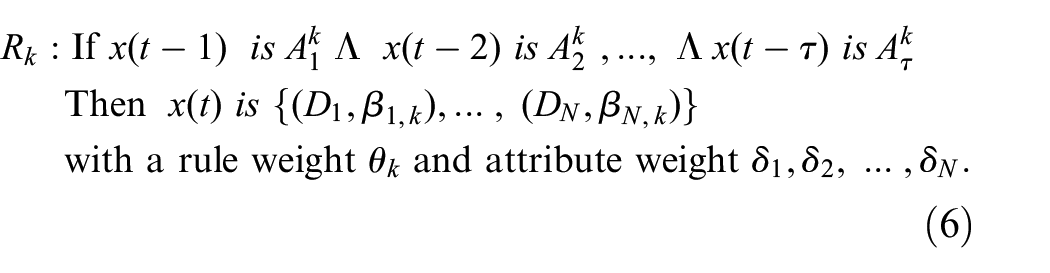
where
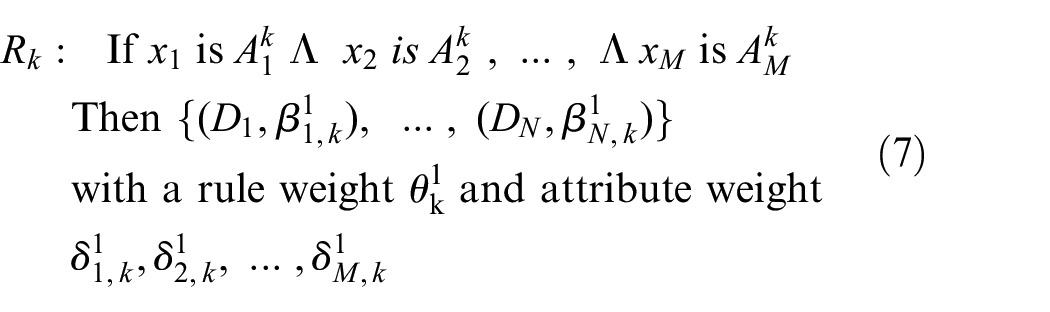
Based on the above results of time series, this section combines expert knowledge with the results of time series to predict the failure probability by BRB. 23 This model only takes the single fault of sensor as the research object, rather than the interactions induced, strengthened, and so on. In ER analytic algorithm, the initial belief degree is given by experts. The kth rule of the failure prediction based on the BRB is shown in equation (7). The process of ER includes three steps, which is shown in Figure 3, the specific steps are not covered here.

The process diagram of ER.
where
The algorithm for parameters updating based on CMA-ES
The initial parameters are given by expert knowledge, while the expert knowledge is subjective, which will make the prediction results less accurate. Therefore, the parameters given by the expert need to be updated by CMA-ES optimization algorithm. The results of time series are calculated by equation (2.3). Then the following mean square error (MSE) objective function can be constructed.

where
In order to make
The above objective function is constrained by the following, which is shown in equation (9).

In order to solve the objective function with some constraints which are shown in equation (9), the CMA-ES algorithm, a new intelligent optimization method, is chosen in this paper. The CMA-ES algorithm is able to solve nonlinear and non-convex real continuous optimization problems.24–26 This model contains four steps, whose specific calculation process is shown in literature. 27
Determination of sensor health state based on MF
According to studies, there is a close relationship between the sensor’s failure probability and the sensor’s health state. Moreover, there is a fuzzy transition relationship between the health states of sensor. When the sensor’s health state is between “Health” and “Sub-health,” the health state of sensor may be either in a “Health”“Sub-health” state, or the sensor may have the features of two states at the same time. For example, it is assumed that the threshold corresponding to “Health” state is [0, 0.5], and “Sub-health” state is (0.5, 1]. If the current parameter happens to be 0.5, it will be very difficult to judge the state of sensor. It is unreasonable if the health states of sensor are simply classified as the “Health” state or the “Sub-health” state. Therefore, it is important to introduce a fuzzy evaluation method to determine the probability of sensor’s states, which can provide a basis for sensor’s repair and replacement.
The MF is a concept of fuzzy evaluation function, whose characteristic is expressed by a fuzzy set, rather than absolutely affirmative or negative. If there is a number A(x) ∈ [0, 1] corresponding to any element in the universe of U (the scope of research), it is called the membership degree of x to A. When x changes in U, A(x) is a function called the membership function of A.28,29 The membership degree A(x) is closer to 1, the degree of x belongs to A is higher, which can be expressed by the MF with a threshold [0, 1]. Thus, the MF can be used to establish the relationship between failure probability and health state. The fuzzy evaluation characteristics of MF can be used to determine the sensor’s membership of the current health state relative to different health states.
Therefore, we can determine the membership of the sensor’s current health state relative to different health states by the sensor’s failure probability and the classification of the sensor’s health states. The “Security description” and “Risk description” can make a reasonable plan for the maintenance of the sensor.
The steps of sensor’s health state prediction model
The specific implementation process is as follows, which is shown in Figure 4.
Step1: Sensor failure mechanism analysis. It is very important to find out the health state feature of sensor by failure mechanism analysis.
Step2: Establish the initial BRB model. The initial parameters of BRB are given by expert knowledge.
Step3: The update of initial parameters. In order to compensate for the uncertainty of expert knowledge, the initial parameters are updated by CMA-ES optimization algorithm.
Step4: Health prediction result of sensor. The membership of sensor relative to different health states is determined by the MF.
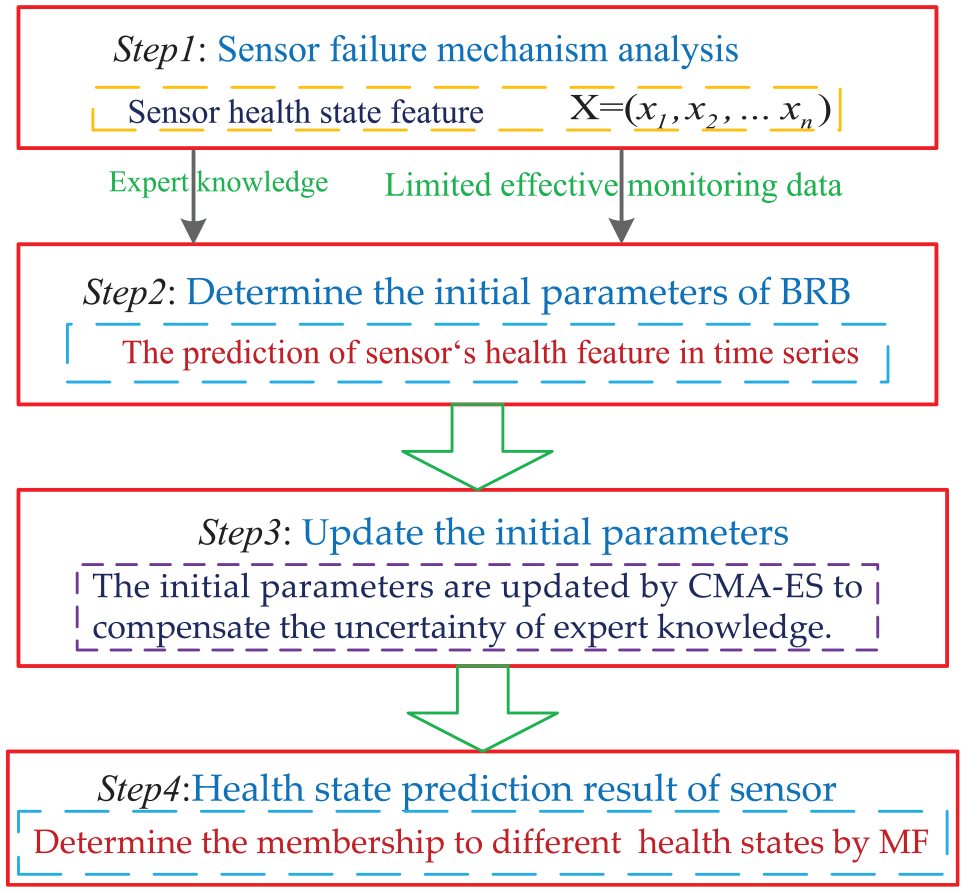
Schematic diagram of the model execution process.
Case study
In order to verify the effectiveness of the proposed health state prediction model based on BRB-MF, this paper selects a rail vehicle LED lighting system brightness sensor as the research object. The experimental process of obtaining data can be displayed by Labview software, which is shown in Figure 5.

Schematic diagram of the test system.
Brightness sensor’s analysis of the working mechanism and failure mechanism
The brightness sensor is an important part of the LED lighting system in the rail vehicle, while it is also a component which is more prone to failure in the brightness collection module. The brightness sensor is a relatively reliable electronic component, however, the form of its failure becomes more complicated in the special application environment of rail vehicles. In general, the failure modes of the brightness sensor are: dark current tolerance, open circuit fault, low insulation resistance between input and output, large reverse current of light emitting tube, failure of photoelectric transmission characteristics, and so on, which are caused by performance defects of the device itself. Under the circumstance that the quality of the brightness sensor is well, it will cause damage to the brightness sensor and prevent the brightness sensor from working properly by the weather, vibration, sand, and other factors when the train is running normally in addition to the above failure forms. During the operation of the rail train, if the temperature of the brightness sensor chip rises, it will be caused by the bad environment or the decline of its own performance. The increase of the brightness sensor temperature has a great influence on the accuracy of its acquisition. The increase in temperature affects the luminous flux of the brightness sensor, which causes distortion of the data collected by the sensor. According to reliable research, the luminous flux decreases by 0.55 lm every time the temperature rises by 10°C. 30
Base on the above studies, it is necessary to divide the health states of the sensor. The brightness sensor’s division of the health states can neither be too broad nor too fine, so it is common to choose one to nine states to describe the health states of the brightness sensor. According to reliable research, it is very well to choose the odd number of health states to make the “Security description” and “Risk description” of the brightness sensor has symmetry and complementary properties. If three is selected for division, it is too broad. However, nine is too cumbersome. Five has a good divisibility when it is used as a divisor. Besides, seven will produce infinite acyclic decimals when it is used as a divisor. So it is the most scientific to divide the health states of the brightness sensor into five. According to different states of brightness sensor’s health state, the detailed descriptions of “Security description” and “Risk description” are made to describe the health state of brightness sensor, which can give technicians a very reasonable plan to repair and replace the brightness sensor. As is shown in Table 1.
Health states of brightness sensor.

Constructing the initial BRB prediction model
Through the above in-depth analysis of the brightness sensor’s failure mechanism, it is easy to know that the chip temperature and the voltage at the outlet of the brightness sensor have the greatest correlation with the brightness sensor’s health states which can be used as health state feature to predict the health state of brightness sensor.
In this case, the variation range of the two health states feature quantities is small and the monitoring data is limited. According to expert knowledge, it is decided to set four reference points for the voltage U and chip temperature T of the brightness sensor by using “N,”“M,”“H,”“VH” to represent “Normal,”“Medium,”“High,”“Very High,” whose specific quantization value is shown in Table 2.
Reference levels of the brightness sensor’s health state features.

There are 16 rules in total because the reference points of T and U are set to four. The initial BRB prediction model is established based on the limited effective health state feature monitoring data, whose initial belief degree is shown in Table 3.
Belief degrees of the initial BRB prediction model.

The updated BRB prediction model
The initial belief degree is given by experts in the above BRB model, while expert knowledge is subjective. Thus, it is necessary to update the initial belief degree by the CMA-ES optimization algorithm, which is given in the initial BRB model. The updated belief degree of the voltage is shown in Table 4 and the updated belief degree of the chip temperature is shown in Table 5.
The updated belief degrees of voltage.

The updated belief degrees of temperature.

As shown in Figures 6 and 7, the blue realization denotes actual monitoring data and the green dotted line represents the prediction curve which is predicted by the initial BRB model, while the red dotted line is predicted by the updated BRB model, and the belief degree is updated by CMA-ES optimization algorithm whose training data is 149 and the number of iterations is 500. It can be seen from Figures 6 and 7 that the red dotted line can better fit the variation of the actual monitoring data of the brightness sensor, whose belief degree is updated by CMA-ES optimization algorithm.

The prediction results of U in time series.

The prediction results of T in time series.
It can be seen that the prediction results, predicted by the updated BRB model through the CMA-ES optimization algorithm, can better fit the monitoring data’s vibration. The error of the updated U prediction model is reduced from 18.85% to 1.49% by calculating the mean absolute error (MAE), and the updated model T prediction model error is reduced from 6.31% to 5.03% by calculating the MAE. The above analysis shows that the CMA-ES algorithm can change the parameters of the initial prediction model, effectively improve the accuracy of the prediction model, which can achieve the accurate prediction of the monitoring data.
Based on the above result predicted by the BRB in time series, the risk probability of brightness sensor can be calculated by combining the health state feature and expert knowledge. The reference level is the same as above, which is shown in in Table 2. The result of risk probability which is predicted by BRB is shown in Figure 8.

The risk probability of brightness sensor.
The probability value relative to the risk states of the brightness senor is shown in Figure 8. It is easy to see that the failure degree of the brightness sensor calculated through initial BRB and updated BRB both increase with step generally. However, when the variation of health state characteristic quantity is very small, the risk probability got from initial BRB is not accurate enough compared to updated BRB. And, the model initial BRB could not make precise predictions about the risk probability at the beginning and the end, thus, the initial BRB unable to predict the risk probability accurately, while the predicted results of updated BRB obtain a good fitting effect.
The prediction output generated by CMA-ES can predict the actual changing of failure probability in higher accuracy and the risk probability prediction results are relatively intuitive. However, the results of this prediction can only distinguish whether the current brightness sensor is in a fault state or not, which cannot make a more detailed prediction of the current brightness sensor health states. Meanwhile, this model cannot handle problem when the brightness sensor health state is between the two neighbor health states. Therefore, it is necessary to classify the health states of the brightness sensor in more detail and use the fuzzy evaluation principle of MF to achieve the health states prediction of the sensor.
Determination of the brightness sensor’s health states
According to Table 1, there are five health states of brightness sensor with the detailed description. From low to high of health states, the safety level of the health state gradually decreases, while the risk increases in turn. Thus, it is important to establish the relationship between the failure probability of brightness sensor and the membership degree to different health states. In each section, if the risk probability is lower, the safety of the brightness sensor will be higher. Therefore, if the risk probability is less than 10%, the brightness sensor has the best safety, which should be classified as “State I: Health.” The state I of the brightness sensor has the highest degree of membership at the same time. Similarly, if the risk probability is higher than 90%, the MF value of level V is the largest. Thus, it is necessary that chose different types of MF to express the relationship between risk probability and health states of brightness sensor relative to the different health states.
As shown in Figure 9, “Z” type MF is used to describe the membership degree between risk probability and health state level I of brightness sensor. The three triangle MFs are selected to describe the membership degree with risk probability and heath states in level II, III, and IV respectively. The membership degree between risk probability and heath state level V is expressed in “S” type MF.

Relationship between risk probability and the membership degree of health states.
According to the relationship between risk probability and the membership degree of different health states, the membership of different health states can be obtained based on the risk probability, which is shown in Table 6.
The result of health state prediction model.
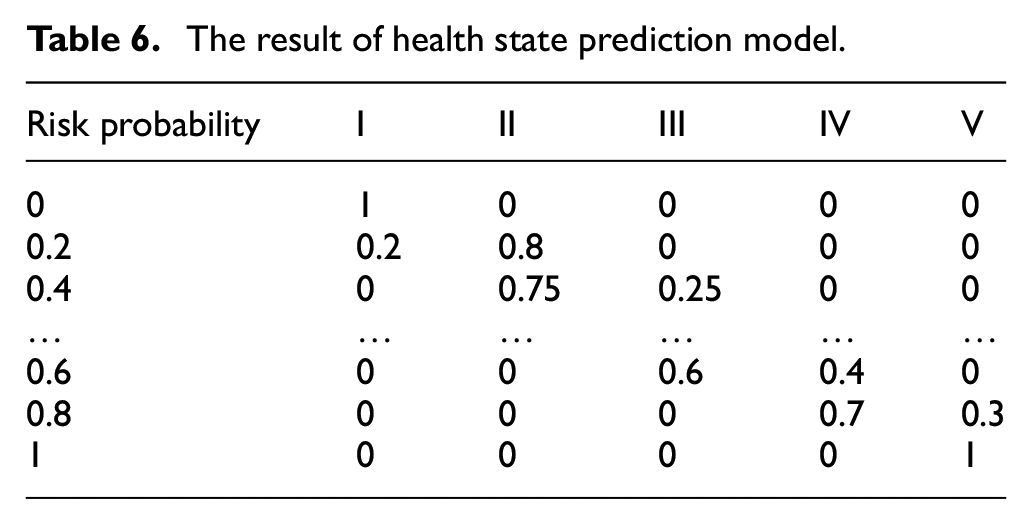
So it is easy to obtain the membership of the above health states based on the failure probability of brightness sensor, which is shown in Figure 9. In this way, the health state of brightness sensor can be obtained by the relationship between the membership and the failure probability. Meanwhile, the problem when the health state is between the two neighbor states can be solved.
Discussion
The results show that MF-BRB has obvious advantages because of using expert knowledge fully in the problem of less available data. Naturally, in the problem of full variety of available data, the results are not different from the other data-driven methods such as neural net-work. When the rules are multiple in a BRB model, the learning ability of model is poor. But now, we use a few rules, and consider the problem of unclear description of adjacent health states to establish the high-precision model with an excellent learning capability. In the further study, a more accurate health estimation model should be built using more characteristics.
Conclusions
In this paper, a new BRB-MF model is proposed to predict the health state of sensor. BRB is employed to establish relationship between the health state with both limited effective monitoring data and expert knowledge. In order to improve the rationality of the proposed model, MF is employed to calculate the membership to different health states of sensor. To enhance the accuracy of the proposed model, the CMA-ES algorithm is used to update the initial parameters. The case of brightness sensor shows that the proposed model can predict the health state of sensor very well. This model provides an effective approach to predict the health state of sensor by using expert knowledge when a large amount of effective monitoring data cannot be obtained, and provides a more reasonable health states classification method facing adjacent states.
In the proposed model, the influence of environment factors, such as temperature, vibration, and other factors, which can influence the accuracy of monitoring data, are not taken into consideration. Therefore, in future studies, if the accuracy of the monitoring data can be taken into consideration, the accuracy of health state prediction model for sensor will be improved.
Footnotes
Handling Editor: Chenhui Liang
Author contributions
Methodology: X.J. Y, G.X. S, and S.X. P; Project support: B.C.Z and X.J.Y; Writing – original draft: G.X.S and S.X.P; Experiment: X.J.Y and H.C.G; Writing – review and editing: X.J.Y, G.X.S, and S.X.P.
Declaration of conflicting interests
The author(s) declared no potential conflicts of interest with respect to the research, authorship, and/or publication of this article.
Funding
The author(s) disclosed receipt of the following financial support for the research, authorship, and/or publication of this article: This work is supported by the National Natural Science Foundation of China under Grant 61803044, Project of the Science and Technology Department of Jilin Province of China under Grands 20200403036SF and 20200301038RQ, and National Natural Science Foundation of China under Grant 61973046.