
Abstract
The aim of this research was to investigate the density, thermal conductivity, and viscosity of dispersions of agricultural biomass particles in ionic liquid [HMIM][NTf2] used as a base fluid. This research is a continuation of the development of IoBioFluids, a new class of dispersions obtained by suspending particles produced from agricultural biomass, as a sustainable alternative to IoNanoFluids. Dispersions with different mass concentration of particles (0, 0.5, 1, 2.5, and 5 wt%) were studied at different temperatures (20°C, 30°C, 40°C, and 50°C). Agricultural biomass, namely sunflower stalks, was used for particle production. The dispersion was prepared by applying the commonly used two-step method. In the first step, particles were produced as dry powder from hydrothermal carbonization and heat treatment in the inert atmosphere oven. In the second step, the particles were dispersed into ionic liquid. A rheological investigation showed that dispersions exhibited Newtonian behavior for shear rates over 10 s−1. Density, thermal conductivity, and dynamic viscosity of dispersions increased with greater mass concentration of particles. Two applied merit criteria suggested a lack of any currently benefit of using the dispersions for heat transfer in the laminar flow regime due to high viscosity of dispersion. The results of criterial analysis showed that experimental data are relatively close to the limit values. Indications are suggesting the possibility of further improvement of IoBioFluid properties as a new heat transfer fluid.
Introduction
Nanofluids (NFs) are advanced colloids obtained by dispersing 1–100 nm nanoparticles (NPs) in conventional liquids. 1 The first research on NFs was done by Masuda et al. 2 in 1993. The authors suspended ultra-fine particles of Al2O3, SiO2, and TiO2 in the water as the base fluid. The effective thermal conductivities for water-Al2O3 and water-TiO2 systems increased with bigger particle concentrations. Pak and Cho 3 investigated the hydrodynamics and heat transfer characteristics of the fluid obtained by suspending NPs of metal oxides in water. They realized that the fluid produced in this way, even with higher viscosity compared to the base fluid, could be beneficial in terms of heat transfer intensification. From that moment, the intensive development of a new type of fluid called nanofluid began.
The NFs obtained from suspended nanoparticles of different materials in base fluid were investigated to improve the thermophysical properties. The research was done with nanoparticles of metals, oxides, nitrides, carbides, and allotropes of carbon (graphite, diamond, nanotube, grapheme, etc.).1,4 Common base fluids include water, ethylene glycol, and oil.1,4
Ionic liquids (ILs) are an innovative class of fluids composed entirely of ions (organic cations and organic/inorganic anions). 5 There is a great potential for the development and synthesizing of new heat transfer fluids (HTFs) by adjusting the cation-anion structure in order to obtain the desired physicochemical properties for specific applications. 6 Ionic liquids are characterized by the following thermophysical properties: negligible vapor pressure and volatility, high thermal stability, low melting point, high ionic conductivity, high solvating capability, and a tendency toward air and moisture stability. 7 Ionic liquids are often considered environmentally friendly fluids due to their possibility of recycling. 6
Nieto de Castro et al. 8 have introduced a new class of NFs named IoNanoFluids (INFs). A new heat transfer fluid was defined as a dispersion of NPs in IL as the base fluid. From that moment, the intensive development of INFs began. The aim of the research was to further improve the thermophysical properties of ILs ([C4mim][BF4], [C6mim][BF4], [C4mim][PF6], [C6mim][PF6], [C4mim][CF3SO3] [C4mpyrr][(CF3 SO2)2N], and [C4mim][PF6]) by dispersing multiwalled carbon nanotubes (MWCNTs).
It is well known that the density of base fluids increases after dispersing NPs1,9 because the density of NPs is higher than that of the base fluid. Paul 10 and Paul et al. 11 synthesized INFs by dispersing different mass particle concentrations (0.5, 1.0, and 2.5 wt%) of alumina Al2O3NPs (<50 nm) of two different particle shapes (spherical and whiskers) into [C4mpyrr][NTf2], [C4mim][NTf2], [C4mmim][NTf2], and [N4111][NTf2] as base ILs and recorded higher density of INFs compared to base fluids. Cherecheş et al. 12 dispersed alumina Al2O3 NPs into IL [C2mim][CH3SO3] and also recorded higher density relative to base fluid. Interestingly, there are cases of ILs density decreasing after the NPs dispersion. Shevelyova et al. 13 recorded that the densities of the studied INFs (MWCNTs in [C4mim][BF4] and [C4mim][PF6]) were lower than the densities of dispersions of ionic and molecular liquids. The authors discovered that the reason was high viscosity of INFs that did not allow penetration of ions into MWCNTs and removal of gases from inner parts of MWCNTs. Patil et al. 14 dispersed fixed concentration of Ru (0.003 M) into ILs [C4mim][Cl], [C4mim][I], [C4mim][Br], and [C4mim][BF4] and revealed slight decrease in density due to the addition of a small concentration of Ru NPs.
Higher thermal conductivity with increased NP concentration in INFs indicates to the potential use of INFs as HTFs. Nieto de Castro et al. 8 recorded thermal conductivity enhancement of INFs (temperature range from 20°C to 80°C) with 0.01 wt% of MWCNTs of ∼3.4%, 1.8%, and 5% for ILs [C4mim][PF6], [C6mim][PF6], and [C4mpyrr][(CF3SO2)2N], respectively, and ∼9% and 7% for ILs [C6mim][BF4] and [C4mim][CF3SO3]. Ribeiro et al. 15 revealed enhancement of thermal conductivity of INFs (temperature range from 20°C to 80°C) with 1 wt% of MWCNT in ILs [C4mim][PF6], [C6mim][BF4], [C6mim][PF6], [C4mim][CF3SO3], and [C4mpyrr][(CF3SO2)2N] from 2% to 9%. Wang et al. 16 recorded thermal conductivity enhancement of INFs Au/[Bmim][PF6] with volume fraction 1.02 × 10⁻³ at 81°C of 13.1%. The common opinion these authors share is that such a large thermal conductivity enhancement could be attributed to micro-convection caused by the Brownian motion of Au. Wang et al. 17 achieved a remarkable thermal conductivity enhancement ratio of more than 10% for INFs (temperature range from 25°C to 65°C) in IL [HMIM][BF4] and graphene (GE) with the mass fraction of as low as 0.03%. According to the authors, this was the result of the extraordinary high thermal conductivity of GE and Brownian motion of NPs at molecular and nanoscale levels. Nieto de Castro et al. 18 reported 35.54 % enhancement of thermal conductivity of INFs with 1 wt% of MWCNT in IL [C4mim][NTf2] at room temperature. The authors believe that interaction between ionic liquid ions and dispersed nanotubes is the key factor of the enhanced thermal conductivity of INFs. Ferreira et al. 19 recorded a minor increase in thermal conductivity from 0.5% to 1% for MWCNTs in ILs ([(C6)3PC14][Phosph], [(C4)3PC1][C1SO4], [(C6)3 PC14][NTf2], [(C6)3-PC14][FAP]) with mass particle concentration from 0.1 to 0.2 wt% at a temperature range from 6.85°C to 86.85°C. At lower temperatures, from 20°C to 30°C, INF MWCNTs/[C4mmim][NTf2] with 0.5 wt% depicted a maximum 4% thermal conductivity enhancement. 20 Paul et al. 11 observed higher thermal conductivity of INF Al2O3/[C4mim][NTf2] for whiskers NPs compared to the spherical ones. The thermal conductivity of INFs was enhanced by ∼9% and ∼13% at a temperature range from 9.85°C to 69.85°C and 2.5 wt% NPs loading of spherical and whiskers NPs, respectively. Patil et al. 14 revealed the enhancement of thermal conductivity of about 4% with the addition of just 0.003 M Ru precursor for the temperature range from 20°C to 60°C. The highest thermal conductivity enhancement of up to 11%, with 2.5 wt% of Al2O3 in ILs ([C4mim][NTf2], [C4mpyrr][NTf2], [N4111][NTf2], [C4mmim][NTf2]) and temperature range from 10°C to 70°C was recorded by Paul et al. 21 Liu et al. 22 achieved enhancement of 10% in thermal conductivity of INFs MGE/[HMIM][BF4] with 0.05% of NPs for temperature range from 20°C to 145°C. Cherecheş et al. 12 achieved less than 2.9% thermal conductivity enhancement of INF Al2O3/[C2mim][CH3SO3] with 15 wt% of NPs and temperature range from 10°C to 60°C.
NFs are well known to have higher dynamic viscosities compared to conventional fluids. This is the reason why NFs consume more pumping power during transport. 1 There is an isolated case when the suspension of ZnO NPs reduces the viscosity of NFs compared to ethylene glycol as the base fluid. 23
The tendency that dynamic viscosity of INFs increases with higher NP concentrations has been also confirmed in the case of rheological research of INFs. Chen et al. 24 prepared INFs by dispersing SiC NPs in [HMIM][BF4] with the mass particle concentrations of 0.01, 0.03, and 0.06 wt%. The authors attributed increased viscosity to the presence of NPs aggregate, which could capture free ions and then directly cause the increase of viscosity in the suspension system. Fox et al. 20 investigated thermopysical properties of INFs obtained by dispersing NPs of alumina Al2O3 (whiskers and spherical), SiO2, Au, ZnO, CuO, Fe2O3, stacked graphene nanofiber (SGNF), MWCNTs, single wall carbon nanotubes SWCNTs, and carbon black (CB) into the [C4mmim][TNf2] as the base fluid. The authors compared viscosities of INFs with the same mass particle concentration of 0.5 wt% at a temperature of 25°C. They recorded negligible increase in viscosity (<6%) for all considered nanoparticles, except for MWCNTs (∼10.44%) and CB (∼50.6 %), compared to pure ionic liquid. The authors identified a high pore volume and surface area of CB nanoparticles as a possible reason for the viscosity’s increase.
Some studies have recorded a reduction in viscosity of INFs compared to base ILs. Wang et al 25 studied the rheological behaviors of the functionalized multi-walled carbon nanotubes F-MWCNTs/[Bmim][PF6] of INFs. The viscosity of the INFs was lower than that of pure ILs, especially under high shear rates. The authors attributed this tendency to the self-lubrication of F-MWCNTs. Wang et al. 17 prepared INFs by dispersing GE and MWCNT (0.03, 0.06, and 0.09 wt%) into ionic liquid [HMIM][BF4] without using any surfactant. The authors revealed that INFs exhibited lower viscosity with mass particle concentration of 0.03 wt% at a temperature of 25°C compared to their base fluid (MWCNTs ∼23% and GE ∼12%). This could be attributed to the self-lubrication of GE and MWCNT. Patil et al. 14 found that viscosity of the Ru-ILs was lower compared to ILs ([C4mim][Cl], [C4mim][I], [C4mim][Br] and [C4mim][BF4]) because of the lower density and lubricating properties of NPs. Ferreira et al. 19 found that the viscosity of INFs is considerably lower when compared to the base ILs. The decrease of viscosity was 82% in the case of 0.1 wt% of INFs MWCNT-[(C6)3PC14)][Phosph].
Queirós 26 has proposed a dispersion of biomass particles in ILs as a sustainable alternative to INFs. This type of dispersion was named IoBioFluids (IBFs). Queirós produced powder by grinding cherry stones to the grains with average diameter of 200 μm. The surface of the material has micropores (dimensions around 10μm), but these micropores have nanopores smaller than 1 μm. These pores can trap gases and ionic liquid molecules so they increase the thermal conductivity and heat capacity, and enhance heat transfer interface in an IL. Queirós et al. 27 prepared IBFs as dispersions of ground lignocellulosic biomass (almond shells, walnut shells, pine nutshells, and Hakea sericea fruits) in the mixture of [emim][OAc] with water (xIL = 0.099) as a base fluid. This way, the IBFs are microfluids with biomass particles less than 0.180 mm in size. The authors studied thermal conductivity of IBFs in a temperature range from 19.85°C to 69.85°C. With a small addition of biomass particles (<1 wt%), base fluid did not increase its thermal conductivity. However, a significant enhancement of the order of 35% was achieved with mass particle concentrations of 3% at room temperature. It should be mentioned that Osman et al. 28 managed to synthesize activated carbon and unconventional multi-walled carbon nanotubes from low-value Miscanthus giganteus lignocellulosic biomass. These multipurpose particles could also be used for the preparation of future IBFs.
Therefore, the authors of this paper have focused their research on the fluids obtained by suspending biomass particles in ILs as base liquids to develop IoBioFluids as new HTFs. To the authors’ knowledge, no such study involving carbonization of agricultural biowaste has been conducted so far with suspensions in ionic liquids to obtain IoBioFluids. Higher content of carbon can enhance the thermal conductivity of biomass particles and, consequently, the thermal conductivity of IoBioFluids. The subject of this research was density, viscosity, and thermal conductivity of dispersions of agricultural biomass particles in IL as the base fluid. We assumed that density, viscosity, and thermal conductivity of IoBioFluids will increase with increased particle concentration. The aim of the research is to continue the development of a new class of dispersions obtained by suspending particles produced from agricultural biomass as a sustainable alternative to INFs.
Materials and methods
Sample preparation
The dispersions were prepared by applying a widely used two-step method. In the first step, the particles were ground to dry powder by hydrothermal carbonization and heat treatment in the oven with inert atmosphere. In the second step, the particles produced from biomass were dispersed in IL as the base fluid.
Particles from sunflower stalks were used. First, the sunflower stalks were ground in a mill, and particle separation and sizing analysis were conducted by a sieve shaker, model AS 200 (Retsch, Netherland). Particle fractions ≤63 µm were used for hydrothermal carbonization process. The mixture of distilled water and particles was prepared in 1:4 ratio with the addition of citric acid of 1% by weight of water. The mixture was poured into the reactor and stirred. The mixture in the reactor was heated up to 90°C. After that, nitrogen (99.8% purity) was added to the reactor for external pressurization until the pressure of 1 MPa was reached. The temperature and pressure were gradually increased to 260°C and 8 MPa to keep the mixture in the liquid phase. Hydrothermal carbonization was performed in a stirrer at 260°C and 229 rpm for 2 h. Solid and liquid components of the obtained product were separated by filtration, which was performed with distilled water, paper filter and vacuum pump. The hydrochar was dried at a temperature of 60°C for 20 h using a hot air sterilizer model SSW70 (VIMS Elektrik, Serbia). The hydrochar was heated in the oven, model PŽ-A (VIMS Elektrik, Serbia), in the inert atmosphere of nitrogen of 99.8% purity. The hydrochar samples were heated from room temperature to 900°C for 2 h. The heat treatment was conducted at constant temperature of 900°C for a duration of 1 h. After that, the oven was turned off and the samples were left to cool down to room temperature.
Ionic liquid 1-hexyl-3-methylimidazolium bis (trifluoromethylsulfonyl)imide of 99.5% purity was purchased from a German producer, Iolitec GmbH. The sum formula of this compound is C12H19F6N3O4S2 and its molecular weight is 447.42 g/mol. This compound is well known by its abbreviation [HMIM][NTf2] and the producer also mentioned the following synonyms: [HMIM][BTA], [HMIM][TFSI], [HMIM][BTI], [C6C1Im][BTA], [Im16][BTA]. Other synonyms for this compound listed by Zhang et al. 29 are also: [C6MIm] [NTf2], [C6C1Im][Ntf2], [C6mim][Tf2N], [C6mim][NTf2], [C6MIM][NTf2], [hmim][Tf2N].
The particle mass and base fluid mass were measured on analytical balance, model ALS (Kern, Germany) with 1 × 10⁻⁴ g precision. The samples were prepared without the use of any surfactant. The following mass concentrations of particles 0, 0.5, 1, 2.5, and 5 wt% were taken into consideration. The samples were mechanically stirred for 10 min on vortex model Lab dancer (Ika, Germany). High energy ultrasound generator model Sonoplus mini 20 (Badelin, Germany) was used for 45 min. Ultrasonic waves with amplitude of 75% were emitted from a horn that was directly immersed in the sample. Finally, the samples were sonicated for 45 min in the water bath, model Elmasonic P (Elma, Germany). The frequency of ultrasound wave was 37 kHz.
Particle characterization
The size and morphology of the dry nanoparticles were studied by using scanning electron microscope model JSM – 6460LV (JEOL, Japan). According to the manufacturer’s declaration, the scanning electron microscope magnifies from 5 to 100,000 times and has a 10 nm resolution. The scanning electron microscope showed both micron and nanoparticles (Figure 1). It could be seen that the surface of the material has micropores with dimensions around 1 μm. The nanoparticles with quasi-spherical shape can be observed at 100,000 times magnification.

The SEM picture of dry particles produced from sunflower stalks.
Size distribution by number of agricultural biomass particles dispersed in [HMIM][NTf2] was measured by a Malvern Zetasizer Nano ZS (Malvern Panalytical, UK). According to data declared by the manufacturer, the measuring range of the equipment is from 0.3 nm to 10 µm. Three recordings of size distribution by number of agricultural biomass particles were done and very similar results were obtained (Figure 2). The intensity of fine particles with mean peak diameter of 729.5 nm was about 20%.

Particle size distribution by number.
The chemical characterization of produced powder was conducted using an energy dissipative X-ray spectrometer (EDS) model INCA (Oxford Instruments, UK). Figure 3 presents the results of energy-dispersive X-ray spectroscopy of particles. Figure 3(a) shows the field emission of scanning electron microscope with the picture of the sample and marked area which was used in energy-dispersive X-ray spectroscopy measurements. Figure 3(b) shows EDS spectra of particles. EDS spectroscopy indicated that particles were mainly composed of carbon with 77.45 wt% (Table 1).
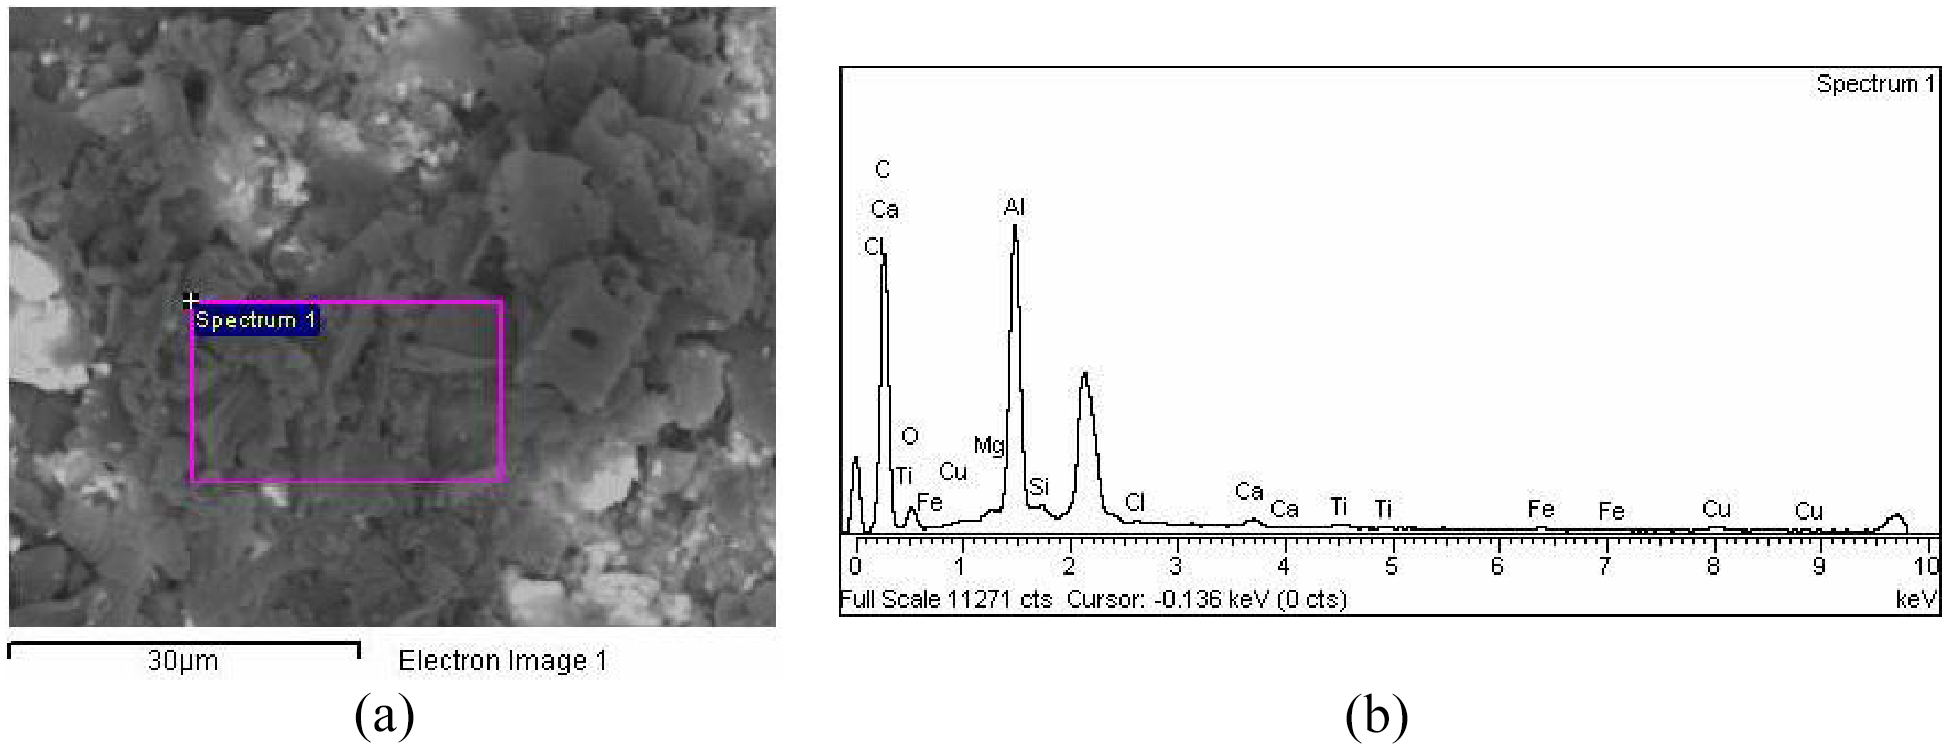
Results of energy-dispersive X-ray spectroscopy of particles: (a) the picture of the sample and (b) EDS spectra of particles.
Mass concentrations of chemical elements of particles.

Measuring systems
The density of dispersions was measured by a class A pycnometer with a stopper (Glassco, India). The manufacturer declared the volume of pycnometer to be 10 mL at a temperature of 20°C. Before measuring, the pycnometer was calibrated and a more accurate volume of pycnometer was determined using distilled water. The weighing of the samples was done on the analytical balance model ALS (Kern, Germany). The pycnometer and the samples were placed in a thermal bath WCH-12 (Witeg, Germany) to maintain a uniform temperature.
The thermal property analyzer, model Meter Tempos (Meter Environment, USA), was used to measure thermal conductivity of dispersions. The thermal property analyzer uses the transient line heat source method to measure the thermal conductivity of liquids. The thermal conductivity of dispersions was measured using sensor KS-3. The sensor has a single needle with 1.3 mm diameter and is 60 mm long, and according to the manufacturer, its measuring range is from 0.02 to 2 W/mK. In order to provide as accurate measurements as possible, the thermal conductivity of the sample was calculated on the basis of 10 consecutive measurements with intervals of 15 min. The thermal property analyzer was checked using the glycerin supplied from the analyzer’s producer. The producer recorded thermal conductivity of 0.278 W/mK at temperature of 22.1°C while the authors of the manuscript recorded 0.2733 W/mK (the relative difference was −1.72%).
Dynamic viscosity of dispersions was measured using the rotational viscometer, model V2-R (TQC, Netherland). The LCP adapter for low viscosity materials was used to measure the viscosity of dispersions. A cylindrical geometry measurement was performed with a spindle of 25 mm in diameter and 90 mm long. The spindle rotates inside the container with a sample of about 18 mL volume. The manufacturer’s specifications are as follows: measuring range from 3.2 to 64000 mPa s, accuracy ±1% of full scale, and repeatability of ±0.2%. The container fits into the circulating water jacket for precise temperature control.
The thermal bath model WCH-12 (Witeg, Germany) was used for precise temperature control of samples. The manufacturer of the thermal bath specified the following data: temperature range from 5°C to 250°C, temperature control resolution 0.1°C, and temperature accuracy ±0.1°C.
Evaluation of heat transfer performance of dispersions
The following two merit criteria were used for evaluation of the heat transfer performance of dispersions. The merit criteria proposed by Prasher et al. 30 for a laminar flow regime is:


where Cη and Ck are viscosity and thermal conductivity enhancement coefficients determined from experimental viscosity ηd/ηbf and thermal conductivity kd/kbf ratios.
The volume fraction of dispersions ϕv was determined on the basis of density ratio ρd/ρbf and mass fraction of the dispersions ϕm. The following two equations were used to determine the volume fraction of dispersions: the density equation proposed by Pak and Cho 3 :

and the well-known equation used by Żyła et al. 31 :

where ρp and ρbf are the density of particles and density of the base fluid.
The merit criteria of performance evaluation of the nanofluids used in the research of Berberović and Bikić 32 was applied in this work:

It represents a simple comparison of the ratios of thermal conductivities kd/kbf and viscosity ηd/ηbf of the dispersions and the base fluid. The dispersion could be considered to be beneficial for use if the thermal conductivity ratio is greater than the third root of viscosity ratio in the laminar flow regime.
Results and discussion
Density
Figure 4 shows relative deviations of density between our experimental data and those from the literature (Papović et al. 33 , Tariq et al. 34 , Seoane et al. 35 , Widegren and Magee 36 , Gomes de Azevedo et al. 37 and Fröba et al. 38 ) for pure ionic liquid [HMIM][NTf2] in terms of temperature.

Relative deviations of density between our experimental data and those from the literature for pure ionic liquid in terms of temperature.
The highest relative deviation of density between our experimental data and those from the literature for pure ionic liquid of 0.607 % at a temperature of 40°C has been found in the work reported by Fröba et al. 38
The lowest relative deviation of −0.011% at a temperature of 70°C was found for the values reported by Widegren and Magee. 36 If the values of densities reported by Fröba et al. 38 were excluded, then the relative deviation of density between our experimental data and those from the literature for pure ionic liquid would be within the limits ±0.2%.
Figure 5 presents the dependence of density and temperature of the dispersions with the following concentrations: 0, 2.5, and 5 wt%. It can be seen that the density decreases with temperature and increases with particle concentrations in the dispersion. These trends are quite expected and well known in the literature. The density of INFs decreases with temperature regardless of the nanoparticle concentration.10–14,39 This happens because liquids tend to expand when their temperature increases. The density of the dispersions increases with mass concentrations of particles because the density of NPs is higher compared to IL.

Dependence of density, temperature, and mass particle concentrations of the dispersions.
Table 2 presents the values of density ρd and density enhancement ρ d /ρ bf of dispersions for different mass concentrations of particles ϕm at a temperature of 30°C and atmospheric pressure of 0.1 MPa. It can be seen that the density enhancement of the dispersion increased by 1.16 % relative to IL in the case of a mass concentration of particles of 5 wt%.
Density and density enhancement of dispersions for various mass concentrations of particles at a temperature of 30°C and atmospheric pressure of 0.1 MPa.

Figure 6 shows the dependence of density of dispersions on the volume fraction of particles at a temperature of 30°C and pressure of 0.1 MPa. It could be noticed that density linearly increases with the volume fraction of particles in the dispersion. The linear dependence of the density and concentration of particles of INFs was also recorded in the research by Paul, 10 Paul et al., 11 and Cherecheş et al. 12

Dependence of density and volume fraction of particles at a temperature of 30°C and a pressure of 0.1 MPa.
Figure 7 shows the dependence of density enhancement of dispersions on the volume fraction of particles at a temperature of 30°C and a pressure of 0.1 MPa. It could be seen that the dependence of density enhancement on the volume fraction of particles is nonlinear.
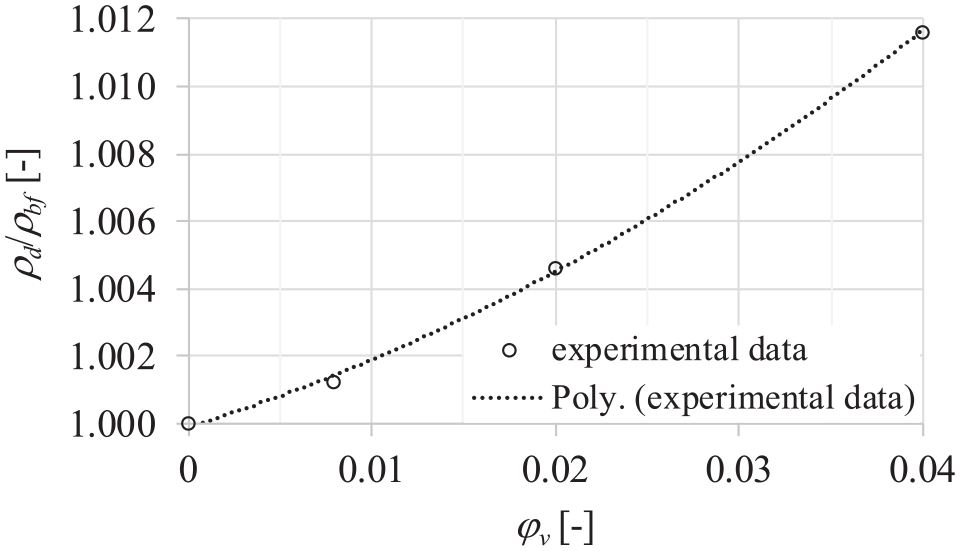
Dependence of density enhancement and volume fraction of particles at a temperature of 30 oC and a pressure of 0.1 MPa.
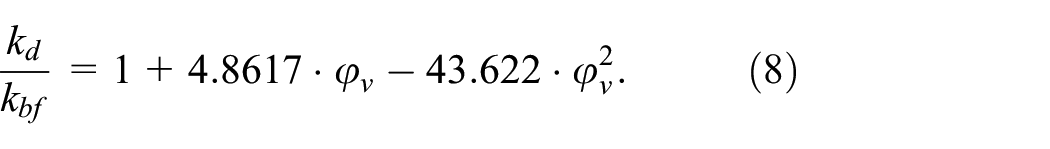
The density enhancement can be modeled by the following nonlinear function in the measured volume fraction range with a coefficient of determination R2 = 0.9993:

Thermal conductivity
Fröba et al. 38 measured the thermal conductivity of IL [HMIM][NTf2] using a parallel-plate instrument. The authors stated that this equipment was designed to fulfill the ideal one-dimensional form of the Fourier law of heat conduction for a planar sample. They reported 0.1219 W/m K at a temperature of 20°C for thermal conductivity of pure ionic liquid. In our research, we obtained 0.1139 W/m K thermal conductivity of the IL for the same temperature. The experimental thermal conductivity values strongly depend on the used measurement method.1,6 In both studies, the temperature had a negligible effect on the thermal conductivity of the IL, which was also observed in many other studies (Nieto de Castro et al., 8 Cherecheş et al., 12 Patil et al., 14 Ribeiro et al., 15 Wang et al., 17 Fox et al., 20 Paul et al., 21 Ge et al., 40 Tomida et al., 41 Ribeiro et al. 42 ).
Thermal conductivity of dispersions for different mass concentrations was obtained by calculating the arithmetic values of the measured thermal conductivities under the same conditions. In Table 3, there are calculated values of thermal conductivity kd and thermal conductivity enhancement kd/kbf of dispersions for various mass concentrations of particles ϕm in dispersions at a temperature of 20°C and atmospheric pressure of 0.1 MPa. It could be seen that thermal conductivity increases with mass concentration of the particles in the dispersion. The thermal conductivity enhancement of the dispersion increased by 12.46% relative to IL in the case of 5 wt% mass concentration of particles. It is worth mentioning that Nieto de Castro et al. 18 revealed thermal conductivity enhancement of 6.81% for INFs MWCNTs/[HMIM][NTf2] with mass particle concentration of 1 wt% at room temperature. The authors believe that thermal conductivity enhancement of dispersions could be attributed to micro-convection caused by the Brownian motion of particles and interaction between ionic liquid ions and dispersed particles.
Calculated values of thermal conductivity and thermal conductivity enhancement of dispersions for various mass concentrations of particles in dispersions at a temperature of 20°C and atmospheric pressure of 0.1 MPa.

Figure 8 presents the dependence of thermal conductivity of dispersions on the volume fraction of particles. It could be noticed that thermal conductivity increases with the volume fraction of particles in the dispersion. Figure 9 shows the dependence of thermal conductivity enhancement of dispersions on the volume fraction of particles. It could be seen that the dependence of thermal conductivity and thermal conductivity enhancement with particle volume fraction is nonlinear. The nonlinear dependence between thermal conductivity of INFs and particle concentration was also recorded in the works of Paul, 10 Paul et al., 11 Paul et al., 21 and França et al. 43
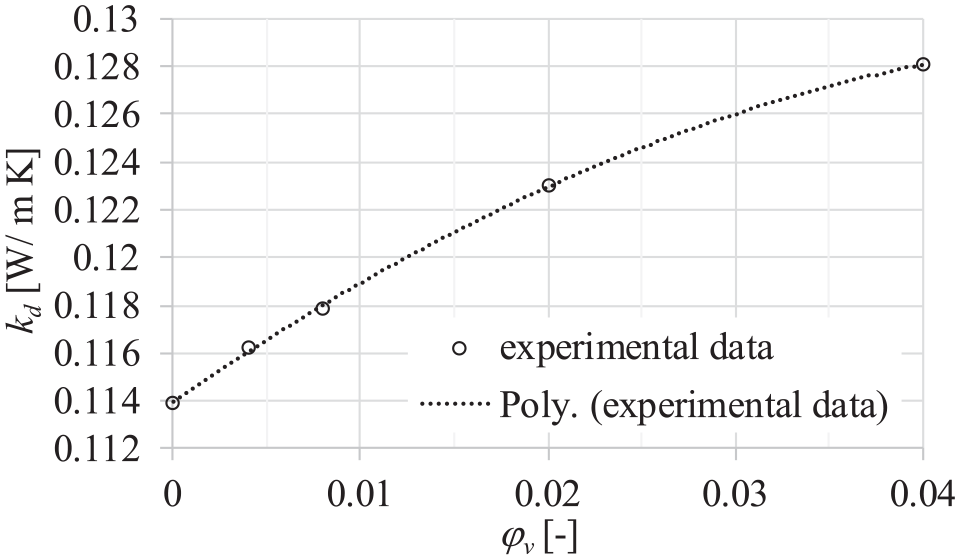
Dependence of thermal conductivity and volume fraction of particles at a temperature of 20°C and 0.1 MPa pressure.

Dependence of thermal conductivity enhancement and volume fraction of particles at a temperature of 20°C and 0.1 MPa pressure.
The thermal conductivity enhancement can be modeled by a nonlinear function in the examined volume fraction range (coefficient of determination R2 = 0.9997):
To evaluate the heat transfer performance of dispersions, the thermal conductivity enhancement was also modeled by linear function in the examined volume fraction range (coefficient of determination R2 = 0.9634):

Dynamic viscosity
Figure 10 shows deviations of dynamic viscosity relative to the temperature between our experimental data and those from the literature for pure IL. The highest relative deviation for dynamic viscosity values was 4.909% at a temperature of 30°C, which was reported by Seoane et al. 35 The lowest relative deviation of 0.401% at a temperature of 40°C was found in the case of the values reported by Widegren and Magee. 36

Relative deviations of dynamic viscosity against temperature between our experimental data and those from the literature for pure ionic liquid.
Figure 11 presents the dependence of dynamic viscosity, temperature, and mass particle concentrations of the dispersions at atmospheric pressure of 0.1 MPa. It could be seen that the dynamic viscosity decreases with temperature and increases with the mass concentration of particles in the dispersion.
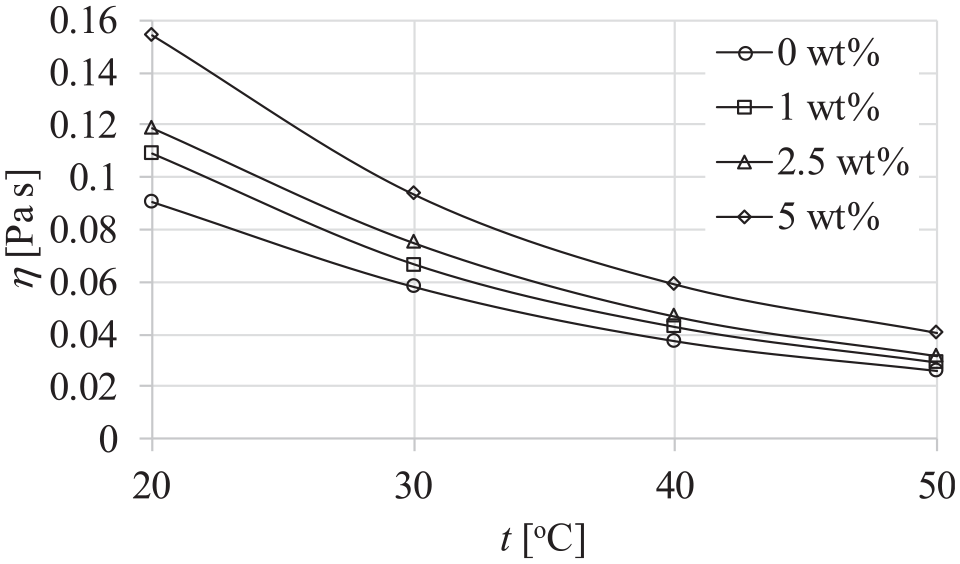
Dependence of dynamic viscosity, temperature and mass particle concentrations of the dispersions at 0.1 MPa pressure.
Nonlinear decrease of dynamic viscosity with the given temperatures of dispersions was expected. This dependency was already recorded in the research on dynamic viscosity of INFs (Paul, 10 Paul et al., 11 Patil et al., 14 Wang et al., 17 Ferreira et al., 19 Fox et al., 20 Paul et al., 21 Chen et al. 24 ). Paul et al. 21 stated that the viscosity of INFs sharply decreases with temperature due to the weakening of intermolecular interactions. Increase of dynamic viscosity of the dispersions with mass concentration of particles is in line with the research by Paul, 10 Paul et al., 11 Fox et al., 20 Paul et al., 21 and Chen et al. 24
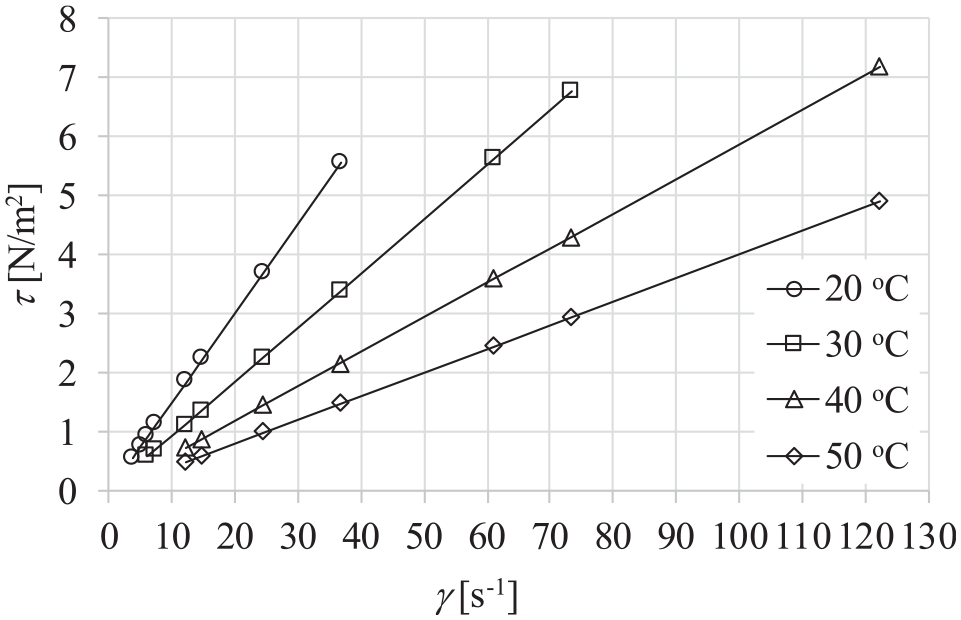
Figure 12 shows the flow curves of dispersions of different mass concentrations of particles at a temperature of 20°C and atmospheric pressure of 0.1 MPa. A linear relationship between the shear rate and shear stress is a possible indication of Newtonian fluid flow behavior of dispersions.

Flow curves of dispersions of different mass concentrations of particles at a temperature of 20°C and pressure 0.1 MPa.
The Newtonian mathematical model is:

where γ is shear rate, τ is shear stress, and η is the dynamic viscosity of fluid.
Dynamic viscosity of fluid η is proportionality factor between the shear stress τ and the shear rate γ, and in the case of Newtonian fluid flow behavior, it does not change with the change of shear rate. Figure 13 shows the dependence of viscosity of dispersions, mass concentrations of particles, and the shear rate, at a temperature of 20°C and atmospheric pressure of 0.1 MPa. It could be seen that the viscosity of dispersion remains constant for shear rates higher than 10 s−1 regardless of the mass particle concentration.
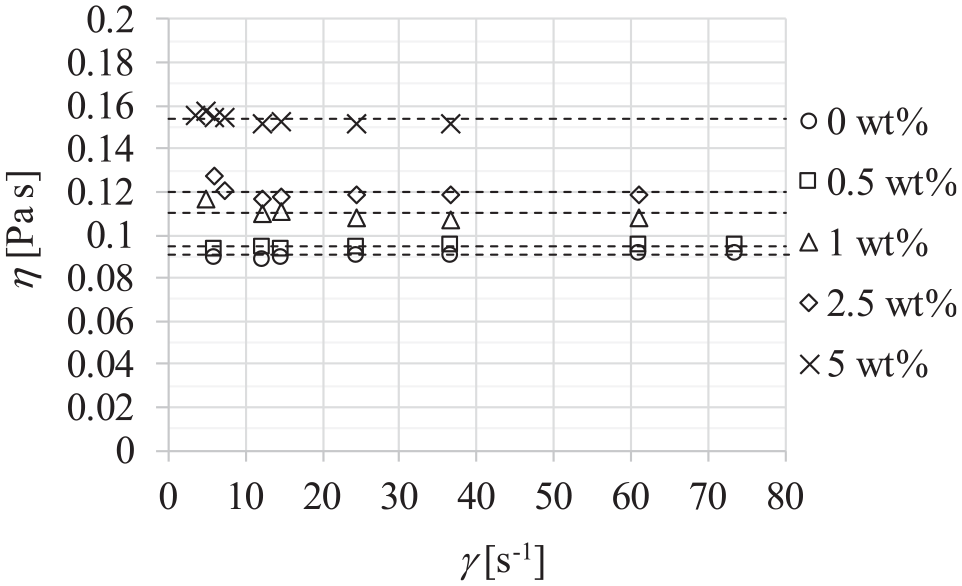
Dynamic viscosity of dispersions of different mass concentrations of particles at a temperature of 20°C and pressure 0.1 MPa.
In order to confirm the Newtonian behavior of the dispersions for the shear rates higher than 10 s−1, flow curves (Figure 14), and dynamic viscosity curves (Figure 15) of dispersion of mass particle concentration of 5 wt% at different temperatures and atmospheric pressure of 0.1 MPa were analyzed. The relationship between the shear rate and the shear stress is linear and dynamic viscosities of the dispersion are constant for shear rates over 10 s−1 regardless of the temperature. It can be concluded that dispersions behave as Newtonian fluid within the examined range of temperatures and mass particle concentrations for shear rates higher than 10 s−1.
Flow curves of dispersions of mass concentration of 5 wt% at different temperatures and pressure of 0.1 MPa.

Dynamic viscosity curves (b) of dispersions of mass concentration of 5 wt% at different temperatures and pressure of 0.1 MPa.
There are some INFs with non-Newtonian, shear-thinning fluid flow behavior as confirmed in the works of Paul, 10 Paul et al., 11 Ferreira et al., 19 Paul et al., 21 and Wang et al. 25 This is the reason why additional rheological research should be done for the shear rates lower than 10 s−1 to completely investigate the fluid flow nature of dispersions.
The viscosities of dispersions of certain mass concentrations of particles were obtained by calculating the arithmetic value of the measured viscosities under the same conditions. Table 4 presents the calculated values of viscosities ηd and viscosity enhancements η d /ηbf of dispersions for different mass concentrations of particles ϕm in dispersions at a temperature of 20°C and atmospheric pressure of 0.1 MPa. In the case of INFs, viscosity enhancement with higher mass concentration of particles was recorded in the studies of the following authors: Paul, 10 Paul et al., 11 Fox et al., 20 Paul et al., 21 and Chen et al. 24 It could be seen that the viscosity enhancement of the dispersion increases by 70% relative to IL in the case of a mass concentration of particles of 5 wt% at a temperature of 20°C. According to the authors of this paper, such a huge dynamic viscosity enhancement of dispersion could be attributed to high pore volume of particles and particle agglomeration. The influence of pore size on viscosity of dispersion was mentioned by Fox et al. 20 The high pore volume of particles and hence high surface area of particles could be seen in Figure 1. The influence of particle agglomeration on viscosity of dispersion has been mentioned by a couple of research groups. Paul et al. 11 stated that at higher concentrations NPs agglomerate and agglomeration increases the viscosity of INFs. Paul et al. 21 see huge tendency of particles to agglomerate as the reason for significant enhancement of the viscosity of INFs. Chen et al. 24 also pointed out agglomeration as the cause of viscosity increase of INFs. Chen et al. 24 also believe that the increase of viscosity can be attributed to the presence of nanoparticles aggregate, which could capture free ions and then directly cause the increase of viscosity in the suspension system.
Calculated values of dynamic viscosities and viscosity enhancements of dispersions for various mass concentrations of particles at a temperature of 20°C and atmospheric pressure of 0.1 MPa.

Figure 16 presents the dependence of viscosity of dispersions on the volume fraction of particles at a temperature of 20°C and pressure of 0.1 MPa. It could be noticed that viscosity nonlinearly increases with the volume fraction of particles in the dispersion. This nonlinear dependence could be proof that, at higher concentrations, particles agglomerate, and agglomeration increases the viscosity of the dispersion.
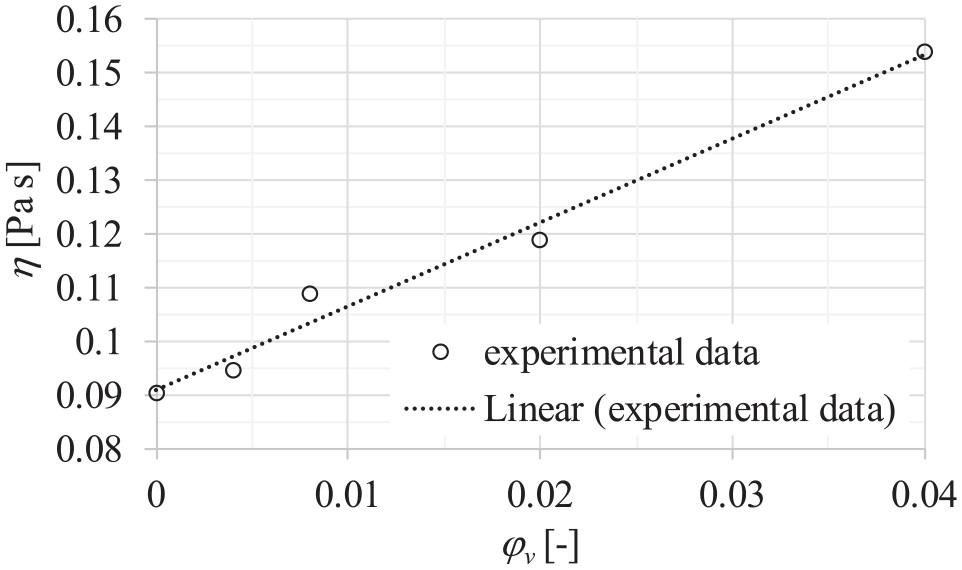
Dependence of the dynamic viscosity of dispersions on various volume fractions of particles at a temperature of 20°C and pressure of 0.1 MPa.
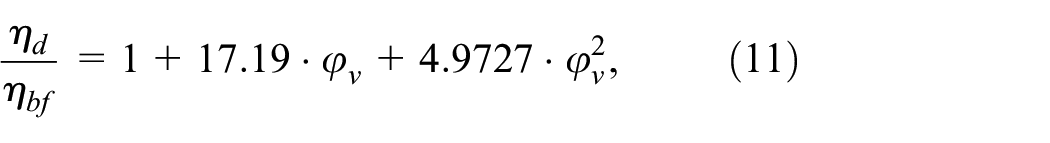
Figure 17 shows the dependence of viscosity enhancement of dispersions on the volume fraction of particles at a temperature of 20°C and pressure of 0.1 MPa. It could be seen that the dependence of viscosity enhancement on the volume fraction of particles is slightly nonlinear. It is worth mentioning that in the studies of Paul et al., 11 Fox et al., 20 and Paul et al, 21 nonlinear dependences between viscosity enhancement and NPs volume fraction were recorded. The dynamic viscosity enhancement can be modeled by a nonlinear and linear function in the examined volume fraction range:


Dependence of the dynamic viscosity enhancement of dispersions on various volume fractions of particles at a temperature of 20°C and pressure of 0.1 MPa.
with approximately the same value of the coefficient of determination R2≈0.981.
Evaluation of the heat transfer performance of dispersions
Figure 18 shows the evaluation of heat transfer performance of dispersions using the first merit criteria. According to this performance evaluation criterion, it is questionable whether the dispersion used in the present study can be considered beneficial for heat transfer applications. It can be seen that only dispersions with volume fraction of 0.004 are far enough from the limit in the beneficial area.
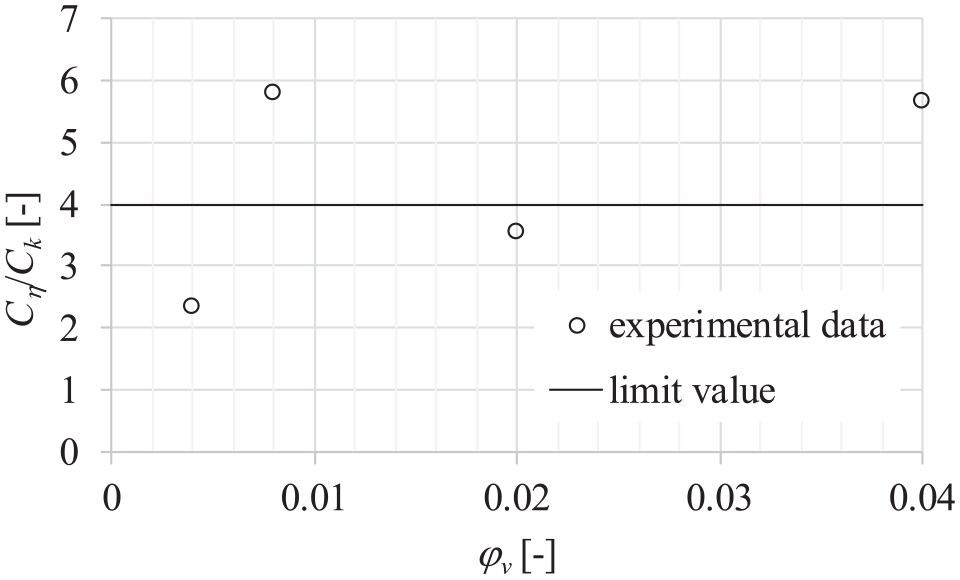
Dependence of ratio Cη/Ck, and volume fraction of particles ϕv in dispersions at constant temperature of 20°C and atmospheric pressure of 0.1 MPa.
Table 5 shows the results of evaluation of the heat transfer performance of dispersions using the second merit criteria. The values for the thermal conductivity ratio and the one-third power of the viscosity ratio are relatively close, but the criterion is not satisfied. Therefore, there is no benefit of using dispersions in the process of heat transfer in case of the laminar flow regime. However, close values of thermal conductivity indicate the possible use of IoBioFluids as heat transfer fluids.
The results of evaluation of the heat transfer performance of dispersions at constant temperature of 20°C and atmospheric pressure of 0.1 MPa.

Conclusion
The experimental research on density, thermal conductivity, and dynamic viscosity of dispersions of agricultural biomass particles in IL [HMIM][NTf2] as a base fluid was presented. The particles were ground to dry powder from sunflower stalk utilizing hydrothermal carbonization and heat treatment in the oven with inert atmosphere. The research was carried with different mass concentrations of particles (0, 0.5, 1, 2.5, and 5wt%) and at different temperatures (20°C, 30°C, 40°C, and 50°C) of dispersions.
A rheological investigation showed that dispersions exhibited Newtonian behavior for shear rates over 10 s−1. Density, dynamic viscosity, and thermal conductivity of the dispersions increased with mass concentration of particles, which was as expected. However, a significant increase in viscosity was recorded with higher mass concentration of particles compared to the increase in thermal conductivity and density. Such a high value of dynamic viscosity is the main reason why dispersions cannot be currently used as a fluid in the heat transfer processes. Based on the two applied merit criteria, it was concluded that it would not be beneficial to use the dispersions as new heat transfer fluids in the case of laminar flow regime due to their high value of dynamic viscosity.
The results of the criterial analysis show that experimental data are relatively close to limit values. The authors believe that there is a reasonable possibility of improving the properties of IoBioFluids and considering them as a new heat transfer fluid. The particles with high pore volume must be broken down into smaller particles and agglomeration of the particles needs to be decreased. The plan for future research of these authors is to continue their work on the production of particles from agricultural biomass by using hydrothermal carbonization and heat treatment in the oven with inert atmosphere in order to reshape and further decrease the particle dimensions. This would decrease the dynamic viscosity and increase the thermal conductivity of the dispersions. The stability of dispersions will also be the focus of our work alongside the development of production of particles from agricultural biomass.
Footnotes
Appendix
Acknowledgements
This paper is the result of research within the project “Research and development of ionic bio fluids – RIDIBF” which is implemented within the Program for excellent projects of young researchers – PROMIS funded by the Science Fund of the Republic of Serbia.
Handling Editor: Chenhui Liang
Author Contributions (Roles)
Bojana Despotović dealt with preparation of sunflower stalk biomass for the processes of hydrothermal carbonization and treatment in furnace with inert atmosphere (milling, sieving, filtration, drying, and mass measurements). Zoran Stamenković conducted hydrothermal carbonization and treatment in furnace with inert atmosphere of samples prepared from sunflower stalk. Milivoj Radojčin prepared the samples of dispersions by suspending of generated particles in ionic liquids by using analytical balance, vortex, high energy ultrasound generator, and ultrasound water bath. Maša Bukurov coordinated activities related to characterization of particles (SEM, EDS, and Zetasizer) and applied merit criteria for the purpose of evaluation of the heat transfer performance of dispersions. Ivan Pavkov measured density of dispersions by a class A pycnometer with a stopper and thermal bath. Nikola Oluški carried out measurements of dynamic viscosity of dispersions by using the rotational viscometer and thermal bath. Siniša Bikić conducted measurements of thermal conductivity of dispersions by using thermal property analyzer and thermal bath. All researchers participated in the data processing and writing of manuscript.
Declaration of conflicting interests
The author(s) declared no potential conflicts of interest with respect to the research, authorship, and/or publication of this article.
Funding
The author(s) disclosed receipt of the following financial support for the research, authorship, and/or publication of this article: This work was supported by The Scientific Fund of the Republic of Serbia under grant “Research and development of ionic bio fluids – RIDIBF.”
Ethical approval/patient consent
In our research we did not use human and animals.