
Abstract
This paper presents a novel method for ejector evaluation by developing a virtual nozzle, which provides the ejector’s maximum ability to overcome its back pressure and the minimum constant cross-section area based on two newly-derived evaluation indexes. The method was developed based on the assumption that the total energy and the ratio of dynamic enthalpy to total energy before normal shock of the virtual nozzle are the same as those of the real ejector. Under the condition that the initial state of the virtual nozzle is the same as that of the primary fluid of the ejector, two evaluation indexes, which include the relative pressure ratio and the relative area ratio, were derived to indicate the extent to which the ability to overcome back pressure and area demand deviate from the benchmark obtained from the virtual nozzle. Using the new method, the case studies of ejector evaluation were carried out involving with theoretical data of 13 refrigerants selected as working fluid of ejector and experimental data of four refrigerants. And the relationship between the two indexes was expressed by a high-accuracy fitting correlation equation that was validated by both theoretical calculation and experimental data and was found meaningful.
Introduction
In recent years, with the strengthening of the awareness of energy-saving and environmental protection, ejector refrigeration has become a research hotspot because that it can be driven by various low-grade heat sources such as solar energy, geothermal energy, and industrial waste heat including that from ship’s engine.1–3 Ejector refrigeration system usually uses supersonic ejector to recover the low-grade heat sources, and the performance of ejector is vital to the efficiency of the whole ejector refrigeration system, therefore, the related researches on the ejector have attracted more and more attention.4,5 In practical terms, the flow state within an ejector is complicated, 6 which may involve supersonic flow, expansion wave, shock wave, turbulence and two-phase flow, etc., 7 and accordingly leads to the big difficulty in establishing a high-accuracy mathematical model for the design and simulation of an ejector. Typically, the constant area mixing (CAM), constant pressure mixing (CPM), and constant rate of momentum change (CRMC) have been developed in literatures8–10 for designing ejectors and analyzing their operating characteristics; and currently computational fluid dynamics (CFD) method has more and more often be employed to build ejector model with the development of computing technology. 10 The CFD model can obtain the three-dimensional local flow characteristics of the ejector, therefore, it is helpful for researchers to understand comprehensively the internal flow structure and shockwave structure of the ejector, and obtain higher simulation accuracy. 11 CFD method is a useful tool to analyze the internal flow field of ejector, but it needs relatively long calculation time and high hardware requirements. Moreover, it is time-consuming and difficult to use CFD to analyze and optimize the whole ejector refrigeration system; therefore, using thermodynamic-based model to study ejector is still adopted by many researches. 12 On the basis of the above methods, many ejector models have been established in combination with the fluid thermophysical properties, these models are suitable for single-phase flow13–16 or two-phase flow.17,18 In addition, since the ejector has three working modes (critical mode, subcritical mode, and back flow mode), 19 the applicability of the ejector model is also studied in relation to the operating modes. 20 Among various models, it seems that CPM combined with CAM can provide a relative simple but clear explanation for the double choke critical operation mode of the ejector, in which the mixing pressure is considered to be constant and equal to the critical pressure of the secondary fluid under choke condition, and the mixing process is completed in the mixing chamber with constant cross-section area, as well as a normal shock wave occurs in the mixing chamber.13,14 The calculation involves primary fluid, secondary fluid, and mixed fluid, which makes it need to be evaluated from many aspects. Besides the two basic parameters including the typical entrainment ratio (ER) defined as the ratio of the mass flow rate of secondary fluid to the mass flow rate of primary fluid and coefficient of performance (COP) adopted as indicators by almost all researchers in this field, the most important evaluation indicators widely used in an ejector are area ratio 21 defined as the ratio of mixing chamber section area to that of nozzle throat section, and pressure lift ratio 1 or suction pressure ratio4,7 defined as the ratio of ejector back pressure to the evaporation pressure of secondary fluid. When an ejector is designed to operate in a refrigeration system, due to the limitations of local site and operating conditions, it usually needs to consider simultaneously the requirements of heat source (generation temperature and mass flow rate of primary fluid), cold source (evaporation temperature and mass flow rate of the secondary fluid corresponds to the cooling capacity), heat sink (temperature and mass flow rate of cooling fluid), and geometry size of ejector (cross-sectional area of mixing chamber and throat area of nozzle). It is recognized that one of the most important objectives for the research of ejector is to obtain the maximum benefit (quality and quantity of cold source) at the minimum cost (quantity and quality of heat source and heat sink, size of ejector); and hence the key is to improve the ability of ejector to overcome its back pressure and reduce the area demand as much as possible under a certain entrainment ratio. Although the area ratio index can supply information about area demand of an ejector, and the pressure lift ratio can reflect the ability of secondary fluid to overcome back pressure, the relationship between the ability to overcome back pressure and the area demand is still rarely studied.
In this paper, a novel virtual nozzle was developed to provide the maximum ability to overcome back pressure and minimum area demand as the baseline for ejector evaluation. Two indexes including the relative pressure ratio (RPR) and the relative area ratio (RAR) were derived to evaluate the extent to which the diffuser outlet pressure and mixing chamber area deviate from the ideal baseline. Employing the RPR and RAR, the evaluation for ejector was carried out for 13 different refrigerants selected as ejector’s working fluid; and some experimental data sets involved different refrigerants are selected to validate the evaluation results obtained using the new method.
Methodology for the ejector evaluation
Before introducing the strategy of virtual nozzle, some assumptions are stated in advance, the primary fluid and the secondary fluid of the ejector are the same working fluid, and they are both ideal gases; in addition, all losses are neglected.
Virtual nozzle and its mathematical equations
The configuration of a real ejector is as shown in Figure 1. The ejector incorporates nozzle, suction chamber, mixing chamber, and diffuser; the high-pressure primary fluid flows through the converging-diverging nozzle and produces an entrainment effect downstream of the nozzle outlet, and sucks in the low-pressure secondary fluid. Then, the two streams are mixed together in a mixing chamber and discharged from the diffuser outlet. The basic equations for calculating the parameters of the ejector can be found in Appendix A attached in this paper, and these equations refer to the references.13–15

Schematic diagram of a supersonic ejector.
Correspondingly, a novel virtual nozzle consists of a nozzle, a constant area section, and a diffuser, is developed here and named as Nozzle V, as shown in Figure 2. When flowing through the nozzle, the working fluid with high pressure and high temperature at the nozzle inlet (location “0”) reaches choking state (i.e. Mach number is 1) at the nozzle throat (location “t”), and changes into a high-speed movement state with low temperature and low pressure at the nozzle outlet (location “1” and “2”); then, the working fluid enters the constant area section and a shock wave occurs at position “3,” which lead to the increase of pressure and the decrease of velocity at the inlet of the diffuser (location “4”); after that, the kinetic energy of the working fluid is converted into pressure energy in the diffuser, and a higher pressure is reached at the diffuser outlet (position “5”) so as to overcome the back pressure.

Schematic diagram of a virtual nozzle (Nozzle V).
Referring to the equations from the Eames et al., 13 Huang et al., 14 Zhu et al., 15 some important parameters of Nozzle V can be calculated as follows. As per the choking state of working fluid at nozzle throat (location “t”), the mass flow rate of Nozzle V can be calculated by

The relationship between the Mach number and cross-section area at location 3 is given by

The pressure before normal shock wave can be determined by
The Mach number and pressure after normal shock wave can be respectively calculated by


The pressure at the diffuser outlet of Nozzle V is given by

As noted in equations (1)–(6), when the geometric values of parameters such as throat area (Avt), constant cross-section area (Av3), and inlet parameters (Pp, Tp) of the virtual nozzle are known, values of other parameters can be obtained. However, when the virtual nozzle is used to evaluate the ejector, two problems will arise; one is that the initial state of the primary fluid and the secondary fluid of the ejector is quite different; the other is that the mixing process does not exist in the virtual nozzle.
Here, two assumptions are made to tackle with the above problems. One is that the total energy of the Nozzle V is the same as the sum of the primary and secondary fluid energy of the ejector, that’s

Here, the mass flow rate of the Nozzle V is correlated with the stagnation enthalpy and mass flow rate of the primary and secondary fluids in the ejector.
The other assumption is that the ratio of the dynamic enthalpy at the outlet of the Nozzle V is the same as that of the mixed fluid after uniform mixing, which can be expressed as

According to the law of conservation of energy, the static enthalpy of the Nozzle V and ejector before normal shock wave are also equal, that’s

As per the definition of Mach number and equations (8) and (9), it can be derived that the Mach number of Nozzle V and ejector before normal shock wave are equal, that’s

Thus, the equation for calculating the Mach number of ejector mixed fluid before normal shock wave can also be used here, and then the following expression can be derived.

In equations (7)–(10), it can be found that the virtual nozzle and ejector are associated with the same Mach number before normal shock wave.
Evaluation indexes
Since the virtual nozzle has only one inlet state with the highest unit energy involved in the ejector. Thus, it provides the minimum constant cross-section area and the maximum ability to overcome back pressure under the same total energy and the same ratio of dynamic enthalpy to total energy before normal shock wave, which can be regarded as a baseline for evaluating the ejector.
By comparing the constant cross-sectional area of the ejector with that of the virtual nozzle, a new evaluation index named as the relative area ratio (RAR) can be obtained, that’s

By comparing the ejector outlet pressure to the virtual nozzle outlet pressure, another new evaluation index named as the relative pressure ratio (RPR) can be obtained, that’s
Parameter calculation
For calculating the RPR and RAR, the necessary input parameters are inlet pressure and temperature of primary fluid (Pp and Tp), inlet pressure and temperature of secondary fluid (Pe and Te), and entrainment ratio (ω or ER). Firstly, equation (11) is used to calculate the Mach number before the normal shock wave depending on the input parameters. Then, equations (12) and (13) are applied to calculate RPR and RAR respectively.
Results and discussions
Theoretical data
In order to evaluate the ejector covering a large temperature range which is often found in the waste heat-driven refrigeration system, five different types of refrigerants or working fluid for ejector which include HFC, HCFO, HFO, HC, and inorganic substance were selected, as listed in Tab. 1. Except with R1233zd(E), which has a very small Ozone Depletion Potential (ODP) of 0.00034, the ODP of other refrigerants selected are all zero, which meets the requirements of environmental protection for ejector refrigeration system.
Refrigerants selected as working fluid for the ejector evaluated.

For deploying investigation under different operation conditions, as shown in Table 2, four data sets were generated. All data sets have the same ER from 0 to 1.8. “Data set 0” was obtained under the following conditions: the evaporation temperature is 10°C and generation temperature is 10°C lower than critical temperatures of refrigerants other than water, while the generation temperature of water is set to be 110°C, 130°C, 150°C, and 170°C, which are denoted as W110, W130, W150, and W170, respectively. For other three data sets, the evaporation temperatures of Data set 1, 2, and 3 are 5°C, 10°C, and 15°C respectively, while other operating condition parameters are the same: the generation temperatures of water are the same as “Data set 0”; other refrigerants have three generation temperatures, which are 10°C, 15°C, and 20°C lower than their own critical temperatures, respectively.
Operation conditions and data sets generated.

Using “Data set 0,” the relationship between the RAR and RPR is given in Figure 3. It can be seen that with the increase of RPR, the RAR decrease rapidly, which is consistent with the design goal of ejector, that is, improving the ability to overcome back pressure and reducing the area demand under a certain ER condition. Another noteworthy finding is that, for all 13 selected refrigerants, the distribution of all data is very regular. Therefore, a fitting correlation equation was established using the nonlinear least squares method, as given by equation (14).


RAR versus RPR of ejector for all selected refrigerants.
In order to further investigate the applicability of the fitting correlation equation, the operation range for the ejector refrigeration system was extended to other three data sets shown in Table 2.
Figure 4 shows the prediction accuracy of all four data sets respectively, the values of predicted RAR is calculated from the fitting model shown in equation (14), which is compared with the theoretically calculated RAR. From Figure 4, it is evident that the prediction accuracies of all four data sets are very high, and their R2 values reach 0.9997. Compared with the “Data set 0” used in the fitting correlation equation, although the operating range has been extended to cover more evaporation temperatures and more generation temperatures, and the range of RAR data also varies with the change of operating conditions, the fitting correlation equation still has very good applicability. It can hence be concluded that the change of operating conditions will change the values of RPR and RAR, but only change their position on the curve, and they are still on the curve fitted by limited “Data set 0.”

Prediction accuracy of all data sets: (a) prediction accuracy of Date set 0, (b) prediction accuracy of Data set 1, (c) prediction accuracy of Data set 2, and (d) prediction accuracy of Data set 3
From the above analysis, a very meaningful result is that, there is no contradiction between improving the ability to overcome the back pressure and reducing the area demand, in other words, improving the ability to overcome back pressure is conducive to reducing the area demand.
Experimental data
In order to further deploy validation studies, some experimental data sets involved different refrigerants in the open literature are adopted including water from Eames et al., 13 R141b from Huang et al., 14 R245fa from Shestopalov et al., 22 and R134a from Li et al. 23
For calculating the RPR and RAR based on the experimental data, the ideal baseline should be provided firstly, that is, the possible maximum outlet pressure of virtual nozzle and minimum area demand of virtual nozzle before normal shock wave. According to the experimental data, the possible maximum outlet pressure of virtual nozzle (Pv5) can be calculated by substituting the real ER into equations (3)–(6) and (11), and the possible minimum area demand of virtual nozzle before normal shock wave (Av3) can be obtained by putting the real ER and real ejector outlet pressure (P5) into equations (2)–(7) and (13). After obtaining the maximum Pv5 and minimum Av3 as the baseline, the real ejector outlet pressure (P5) and constant area of ejector mixing chamber (A3) from experimental data are compared with the obtained baseline so as to calculate the RPRreal and RARreal.
Figure 5 shows the RARreal versus RPRreal of some experimental data from those literatures.13,14,22,23 It can be seen that, although four different refrigerants are involved and their operation conditions are very different, all the data of calculated RARreal versus RPRreal are distributed around the fitted curve drawn on the basis of equation (14). It can be concluded that, although the actual ejector experimental data does involve friction losses, the real RPR and RAR obtained by comparing the real data with the maximum ability to overcome back pressure and minimum area demand calculated on the basis of experimental data, still can be found on the fitted curve.
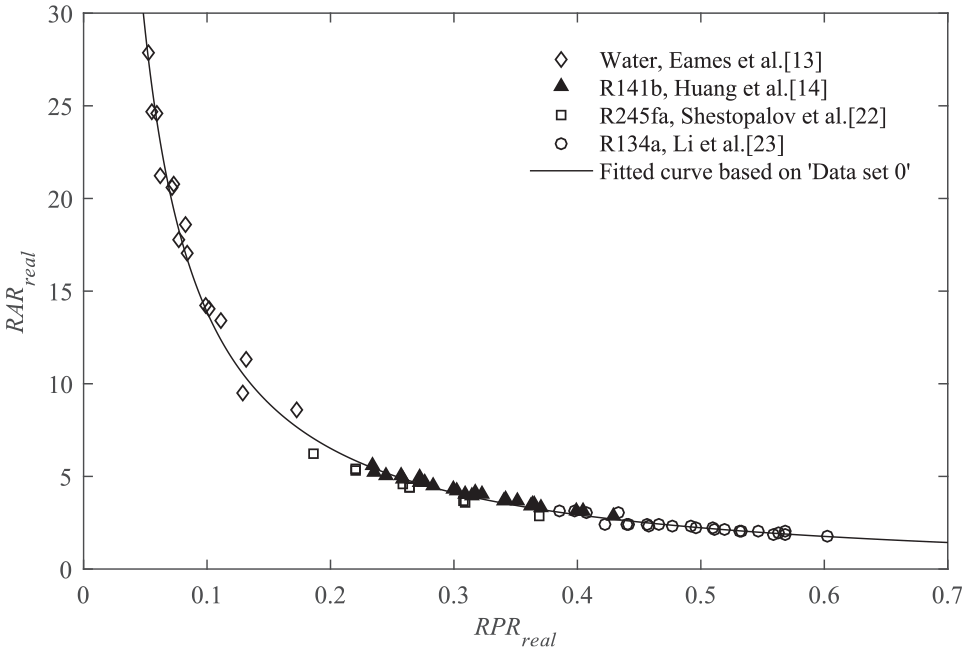
RAR versus RPR of ejector for some refrigerants using experimental data.
The prediction accuracy of experimental data is illustrated in Figure 6. The values of RARpredicted is calculated from the fitting correlation equation shown in equation (14) using RPRreal as independent variable. It can be seen that the prediction accuracy is still very high, the value of R2 reaches 0.9942, which means that the fitting model also has good applicability in the experimental data.

Prediction accuracy of all experimental data.
Conclusions
In order to investigate the relationship between the ability to overcome back pressure and area demand on the supersonic ejector, a novel virtual nozzle was developed and two evaluation indexes were derived. The case studies were deployed based on both theoretical data and experimental data from literatures. Main conclusions drawn can be summarized as follows:
A virtual nozzle with only one inlet state identical to the initial state of the primary fluid of the ejector can be constructed under the condition of the same total energy and energy conversion rate after mixing with the ejector. It provides the minimum constant cross-section area and the maximum ability to overcome the back pressure, which can be regarded as the baseline for ejector evaluation.
The relationship between the RAR and RPR can be expressed by a meaningful fitting correlation equation with high accuracy. And the fitting correlation equation has a wide range of applicability under different refrigerants, different generation temperatures, different evaporation temperatures, and different ERs, regardless of theoretical calculation or experimental data.
Improving the ability to overcome back pressure is conducive to reducing the area demand, in other words, there is no contradiction between improving the ability to overcome the back pressure and reducing the area demand.
Footnotes
Appendix A
Handling Editor: Chenhui Liang
Declaration of conflicting interests
The author(s) declared no potential conflicts of interest with respect to the research, authorship, and/or publication of this article.
Funding
The author(s) disclosed receipt of the following financial support for the research, authorship, and/or publication of this article: This work was supported by National Natural Science Foundation of China (No.51679107); Natural Science Foundation of Fujian Province, China (No.2017J01705); and Marine Economic Development Subsidy Fund Project of Fujian Province, China (No. FJHJF-L-2020-5).