
Abstract
This paper designs an experimental scheme to monitor the tool wear state by extracting the vibration signal of tool wear. The data acquisition and signal processing hardware includes a T-type cutting tool, a vibration sensor, an amplifier, a data acquisition card, and a computer. In the time domain, the vibration signal is analyzed by statistical analysis method, and it is concluded that the variance of vibration signal of X-axis wear is positively correlated with the degree of tool wear. Moreover, the vibration signal is converted from time domain to frequency domain by Fourier transform, and the characteristic frequency bands of vibration signal are 2–4 kHz and 7–9 kHz in frequency domain. In addition, in time-frequency domain, the vibration signal is decomposed by wavelet packet decomposition technology, and the energy statistics of the decomposed frequency band is carried out. It is further judged that the energy percentage of 2.5–3.75 kHz and 7.5–8.25 kHz is closely related to tool wear, so the energy percentage of the two characteristic frequency bands is selected as the characteristic value of tool wear monitoring.
Introduction
The tool milling signal collected by the sensor is the raw signal, which contains a lot of information. Although this information can be used to some extent to determine the tool wear, it cannot be used as a characteristic value for tool wear prediction and will be mixed with a large amount of noise and interference information. Therefore, it is necessary to use different signal processing technologies to deeply study and explore the original signal, which in this way ensure the accuracy of tool wear monitoring. Chen et al. 1 studied the correlation between the change of chip surface chromaticity and tool wear, and proposed a system of monitoring tool wear by relying on the colors of chips generated in cutting. The experiment results show that the state of tool wear can be monitored only by inputting the cutting time and the pictures of the cutting tool. For severely worn tools, the monitoring value and actual value are inconsistent by relying on the colors of chips generated in cutting. Peng et al. 2 proposed a new method for real-time prediction of tool wear state based on machine vision technology. This method uses charge coupled device (CCD) to obtain tool wear image, and extracts tool wear value through image processing method. This method has the advantages of high precision and fast response, but the disadvantage is that it must be stopped first and then sampled, and the tool wear state cannot be monitored in real time. Hesser et al. 3 used the acceleration data collected by the acceleration sensor to analyze the tool state, and finally successfully classified different tools, but it takes a long time to extract the acceleration. Li et al. 4 used wavelet packet analysis technology to extract the features of tool milling force signals, and made energy statistics on the decomposed and reconstructed signals. The statistical results show that the energy value of wavelet packet decomposed subband signals has a good correlation with tool wear, but the cutting force detection method is harsh for the installation environment, and different machine tool installation requires different methods, Generally, the machine tool needs to be modified, which will increase the cost of production and processing, and it is not universal. It is only suitable for precision machining with special needs.
Motivated by the above, this paper considers vibration sensors to build an online data acquisition system for tool wear. The system includes an amplifier, a data acquisition card, an industrial microscope, and a computer. The system overcomes the above shortcomings and can monitor the whole process of tool wear. The vibration sensor collects vibration signals in the process of tool wear without stopping the machine first and then sampling, which can be monitored in real time and does not need longer time for signal extraction. The vibration signal during tool milling is collected by the system, the vibration signal is analyzed by time-domain statistical analysis method, and the variance of vibration signal is selected as the characteristic value of tool wear. The wavelet packet decomposition technology is used to decompose the vibration signal, count the energy of the decomposed subband, and select the energy percentage of the vibration signal (2.5–3.75 kHz) frequency band and (7.5–8.25 kHz) frequency band as the tool wear characteristic value, which can be used to accurately monitor the tool wear state.
Experimental principle and device structure
Experimental structure
Tool condition monitoring refers to the predictive identification of the real-time condition of a tool to prevent its continued use after failure. To make better predictions, the extraction of relevant signal eigenvalues during wear is the key to be able to make accurate state predictions. The object of this paper is a T-type end mill, and the wear value VB of the flank is selected as the tool wear criterion, the vibration sensor signal is selected as the monitoring signal, and the CNC machine tool is used as the experimental machining platform. The hardware to be used in this experiment includes a vibration sensor, an amplifier, a data acquisition card, an industrial microscope, a computer, and a T-type cutting tool. Around them, there was a need to build a monitoring system whose purpose was to capture and save to a computer in real-time the vibration signals from the cutting process of a CNC machine.
After all hardware is selected, some of them needs to be installed. Considering the cost, installation, reliability, and other issues, the frequency range of the vibration sensor used in this experiment is 2–10 kHz and the sensitivity is 100 mv/g. The sampling frequency of the vibration signal is four times of the highest frequency of the sensor, which is the 40 kHz sampling frequency of the vibration signal. Through the data acquisition (DAQ) card, the vibration signal of milling can be collected in real time. In terms of sensor installation, the vibration sensor is firmly installed in the machine tool through the supporting magnetic base, which is suitable for most NC machine tools. It can obtain the vibration signal of the tool in the cutting process. The vibration sensor is based on the principle of being closer to the milling tool. In this experiment, three preferred positions were selected and the root means square (RMS) values of the vibration signals at the three different positions were calculated. Since the RMS value of the vibration signal at the lower left position is the largest, the lower-left position is chosen as the best position. It can obtain the vibration signal of the tool in the cutting process. The milling tool wear state monitoring system is shown in Figure 1.

Milling tool wear state monitoring system.
Experimental protocol
The test was conducted on a vertical CNC machine MLV600, which has a mechatronic structure and a simple machine layout and easy operation. In the test of milling, many factors influence the test results, such as tool wear, workpiece structure, machine vibration, the three cutting elements (spindle speed, feed rate, back engagement), 5 and the presence or absence of coolant. After preliminary tests, it was determined that can affect signal changes in cutting are tool wear and the three cutting elements. Considering that the object of this paper is the tool, the spindle speed, the feed rate, and the back engagement are fixed for each experiment. The test tool material is carbide, and to better fit, the actual machining process of production, three new T-alloy end mills of 20 mm diameter from the same batch of the same manufacturer were selected, and the workpiece was 45-gauge steel. Where the size of the milling object is: 6 × 100 × 40 mm, milling 100 × 40 mm end face. The tool milling length is 100 mm. The cutting tool in this paper is the T-type cutting tool of 6-tooth alloy with a diameter of 20 mm.The PCB vibration sensor used in this paper has a width of 2–10 kHz and a sensitivity of 100 mv/g. It can be firmly installed in the machine tool through the supporting magnetic base without affecting the cutting processing of the machine tool, which is suitable for most CNC machine tools. It can obtain the vibration signal of the tool in the cutting process. And the high-definition industrial electron microscope is used in this experiment. It has 200 W pixels, 1920 × 1080 resolution, 45 fps frame rate, and 280 times maximum magnification. To make the milling tool wear faster, no cutting fluid is used. Dry cutting of the machined workpiece, the machining method is finishing. To exclude the interference of other factors to the signal and to obtain better data, as shown in Table 1, a total of three machining conditions were used to acquire the signal during tool milling. The signals of a new tool were collected in each test condition when the tool was machined for milling in different wear states from new to dull.
The test of cutting and machining parameters.

Time domain analysis of vibration signals and selection of eigenvalues
Since the milling tool only moves in the X and Y axes during machining, there is no change in the Z-axis, so only the X and Y-axis vibration signals need to be analyzed. Vibration signals were collected in the background of machining conditions without cutting fluid for selected test 2. The cutting parameters are fixed and the variables are the amount of tool wear. Four vibration signals with different tool wear amounts of 0, 0.1, 0.3, and 0.5 mm were randomly selected and filtered for the above machining conditions. To facilitate the calculation, the wave forms corresponding to the signal 1s are intercepted separately. There is a correlation between the amplitude of the vibration signal and the degree of tool wear, so four sets of vibration signals of tools with different degrees of wear are arbitrarily taken to analyze them in the time domain. By analyzing the calculated results of four sets of data, the variance of the X-axis vibration signal and tool wear was finally filtered to have the highest correlation. The histogram of the relationship between the two is shown in Figure 2, from which it can be observed that they are also positively correlated.

Histogram of X-axis vibration signal variance versus tool wear.
Frequency domain analysis of vibration signals and selection of eigenvalues
Since the time domain analysis method has very poor resistance to external disturbances, considering the complexity of machine tool milling processing, it is more necessary to analyze the signal by frequency domain analysis. Conversion of X-axis vibration signals from the time domain to the frequency domain is done using Matlab software. We observe and look for eigenvalues in the frequency domain that are closely related to tool wear. According to relevant studies, 6 a vibration signal is a low-frequency signal and its characteristic frequency band is in the low-frequency band. The vibration signal is sampled and the cutting parameters are fixed. Four sets of X-axis vibration signals of tools with different degrees of wear were randomly selected from test 2, and after Fourier transforming them, the spectra of tools with different degrees of wear are shown in Figure 3.

Frequency spectrum of different degrees of wear: (a) Frequency spectrum of X-axis vibration signal of new tool, (b) frequency spectrum of X-axis vibration signal of slight wear tool, (c) frequency spectrum of X-axis vibration signal of moderate wear tool, and (d) frequency spectrum of X-axis vibration signal of severe wear tool.
Time and frequency domain analysis of vibration signals and selection of eigenvalues
As the most basic and effective classical tool, the Fourier transform has been used in the theoretical and applied technical research of signal analysis techniques. However, the Fourier transform converts the signal from the time domain to the frequency domain for analysis, and the time-frequency characteristics of the signal cannot be considered. Moreover, in the tool wear monitoring system, the non-smooth random signal is usually the tool milling processing signal collected by the sensor, and the Fourier transform cannot analyze and study the non-smooth random signal for a specific period. Therefore, the frequency domain analysis method is not a good method for tool wear characterization. 7 As a result, researchers began to shift their attention from the frequency domain to the time-frequency domain by studying the signal more deeply in the time-frequency domain, the most typical of which is the wavelet transform.
Continuous wavelet transform and Fourier transform
The function space

Another signal processing technique during the transition between the Fourier transform and the wavelet transform is the window Fourier transform. The variant form of its definition is defined as (2).

The formula
Discrete wavelet transform
If the continuous wavelet function satisfies the reliability condition
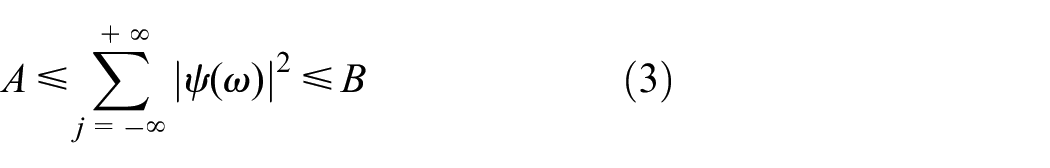
then this is called a binary wavelet. After taking the binary discrete value

Then the function

If the family of functions
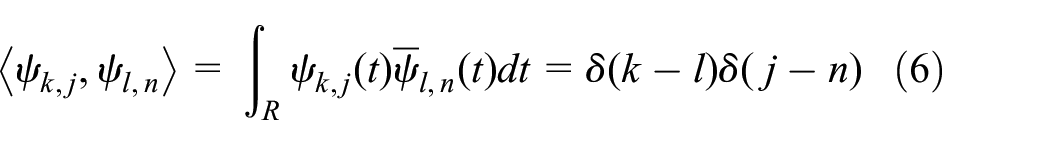
where

The coefficient

Multi-resolution analysis
The construction of wavelet orthogonal bases can be achieved by multi-resolution analysis due to the excellence of orthogonal wavelets that allow all functions to have their corresponding wavelet level expansions.
8
It is defined as an orthogonal multi-resolution analysis on a subspace and function
Then function

to hold. When
is an orthogonal wavelet.
Multi-resolution analysis refers to the decomposition of the signal space at multiple scales so that different signal spaces can be analyzed. The multi-resolution analysis is illustrated by a three-layer wavelet decomposition, as shown in Figure 4.

Three-layer multi-resolution wavelet decomposition.
Each time the signal is decomposed in figure 4, the frequency of the signal is divided into two. As can be seen in the figure, the multi-resolution decomposition does not process the high-frequency part of the signal.
Wavelet packet analysis
Sensor signals contain a large amount of information at both low and high frequencies. In order to analyze the sensor signal more comprehensively, the wavelet packet can be used to independently select the corresponding frequency band of the signal to be analyzed based on a certain understanding of the signal to be analyzed, so that the signal can be analyzed more quickly. Therefore, in practical applications, wavelet packet analysis is more popular among engineers and scientists.
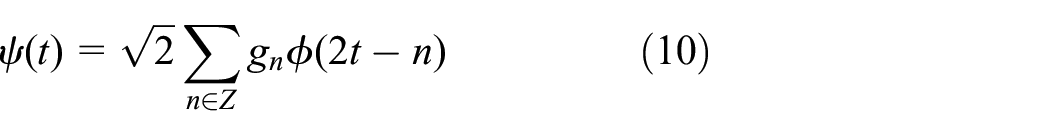
Before introducing the wavelet packet concept, the symbols,

and

in advance. The frequency domain forms of (11) and (12) can be expressed as

and

The
A wavelet packet is a column of functions. A two-layer wavelet packet decomposition diagram is used to briefly illustrate the process of wavelet packet decomposition of the signal, as shown in Figure 5.
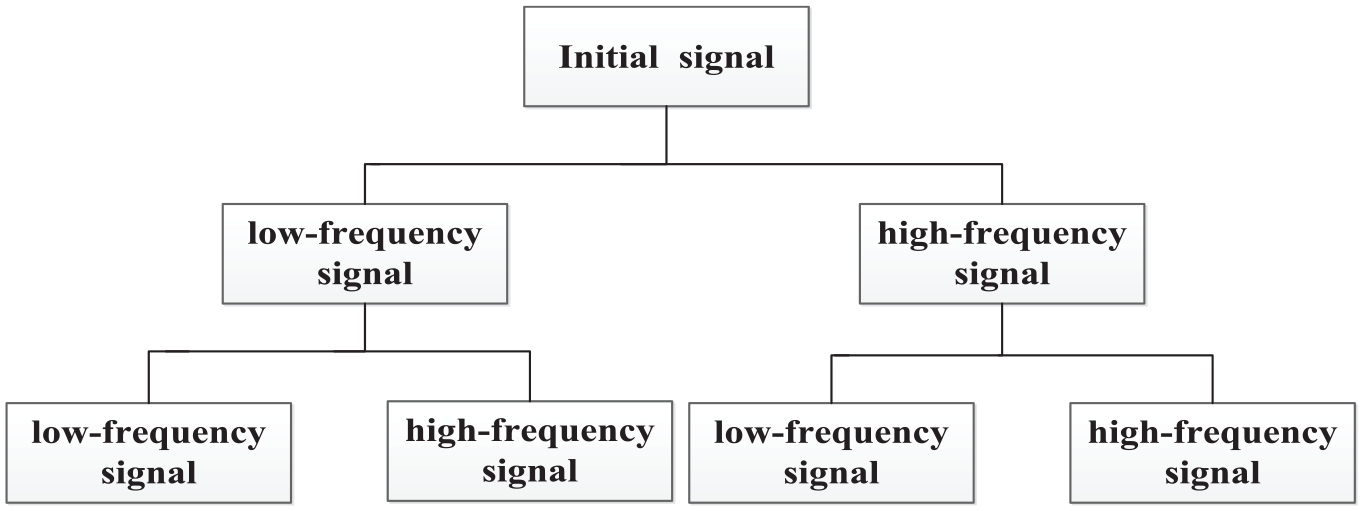
Two-layer wavelet packet decomposition diagram.
The advantage of wavelet packet transform is that the signal can be analyzed in any frequency band. As tool wear continues to increase, the corresponding sensor signals change in the frequency domain, and these changes need to be expressed quantitatively and thus as to feature vectors. Since the wavelet basis used has orthogonality, its wavelet coefficients can represent the energy of the signal in that frequency band. We can perform energy calculations for any frequency band after the signal decomposition and predict the tool wear state based on its energy value. In addition, considering that the inner product of the signal before and after the wavelet packet transformation is constant, that is, the energy is constant, then the tool wear state can be predicted by the energy proportional transformation in the corresponding frequency band. The total energy of the signal and the energy of the decomposed signal are calculated as

and

From these two equations, the energy ratio of the decomposed frequency band is
Wavelet packet decomposition and eigenvalue selection of vibration signal
With the continuous development of signal processing technology, the variety of wavelet packet bases is gradually enriched. A suitable wavelet packet base can make wavelet transform effectively avoid the band overlap phenomenon. The wavelet packet bases commonly used in engineering are Haar, Meyer, Daubechies, Symlets, and Coiflet. 9 In this paper, the DB4 wavelet of Daubechies series wavelets is used as the wavelet packet base, and the DB4 wavelet packet base has features such as smoothness as well as matching wavelet fast algorithms. 10
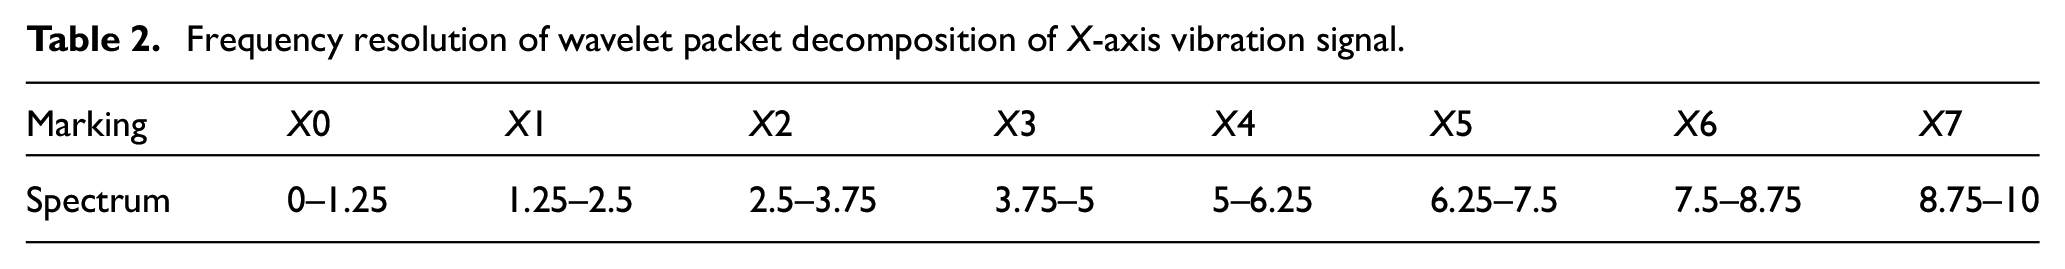
The acquisition frequency of the system vibration signal is 40 kHz, which is in accordance with Nyquist’s law, and the effective frequency band of the sensor is 0–10 kHz, so here the vibration signal is down sampled to 20 kHz, and the wavelet base is selected DB4, after three decompositions, the frequency band is divided into eight frequency bands, which are X0, X1, X2, X3, X4, X5, X6, X7, and the frequency of each band after decomposition. The resolution is 1.25 kHz, and the frequency domain rate after decomposition is shown in Table 2.
Frequency resolution of wavelet packet decomposition of X-axis vibration signal.
The vibration signal after 3-layer wavelet packet decomposition has eight time-series vibration signals, divided into X0–X7, as shown in Figure 6.

Wavelet packet decomposition of X-axis vibration signal: (a) wavelet packet decomposition of new tool, (b) wavelet packet decomposition of slight wear tool, (c) wavelet packet decomposition of moderate wear tool, and (d) wavelet packet decomposition of severe wear tool.
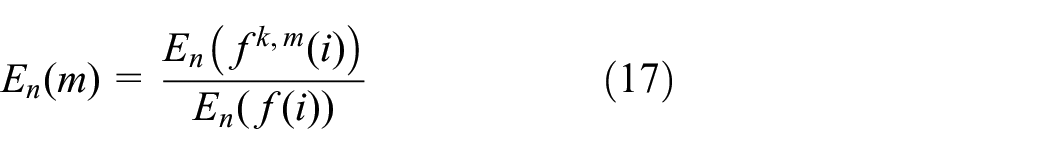
The energy percentages of each frequency band of the X-axis vibration signal, calculated according to equation (17) above, as shown in Table 3.
Energy percentage of X-axis vibration signal decomposition band of different tools.

The above table contains a large amount of information related to tool wear in each frequency band, but since its dimensionality is still large, it needs to be further analyzed, from which the most tool wear-related information is selected and barred, as shown in Figure 7.

Energy of the decomposed frequency band of different tool X-axis vibration signals Percentage distribution.
From Figure 7 it can be observed that the X-axis vibration of the X2 and X6 band energy percentage of the tool wear continues to become larger, the percentage also gradually increases. The reason is that the surface of the tool will be concave and convex, increasing the contact area between the tool and the work piece, resulting in the friction between the two also getting larger. Expressed in the signal is the energy which constantly becomes larger. The same wavelet packet analysis was done for the Y-axis vibration signal, but the energy distribution of the eight frequency bands did not correlate significantly with tool wear, so the energy percentages of the X2 and X6 frequency bands of the X-axis vibration signal could be selected as the characteristic values for tool wear prediction.
Conclusions
In this article, in order to monitor tool wear, a new monitoring method is proposed. Wavelet packet decomposition technology is used to extract the eigenvalues of vibration signals. In addition, the characteristics in time domain, frequency domain, and frequency domain are discussed. The conclusions can be summarized as following.
In the time domain, the statistical analysis method is used for time domain analysis. From Figure 2, it can be concluded that the variance of vibration signal has a positive correlation with tool wear.
In the frequency domain, the vibration signal is converted from time domain to frequency domain by Fourier transform. The conclusion that the characteristic frequency band is in (2–4 kHz) and (7–9 kHz) can be obtained from Figure 3.
In the time-frequency domain, the vibration signal is analyzed by wavelet packet decomposition. From the energy percentage distribution of vibration signal in Figure 7, it can be seen that there is a positive correlation between X2 (2.5–3.75 kHz) and X6 (7.5–8.25 kHz) frequency bands. Especially, it can be concluded that the energy percentage of X2 (2.5–3.75 kHz) and X6 (7.5–8.25 kHz) frequency bands is used as the eigenvalue of state of tool wear.
Footnotes
Handling Editor: Chenhui Liang
Declaration of conflicting interests
The author(s) declared no potential conflicts of interest with respect to the research, authorship, and/or publication of this article.
Funding
The author(s) received no financial support for the research, authorship, and/or publication of this article.