
Abstract
To study the vibration characteristics of the poppet valve induced by cavitation, the signal analysis method based on the ensemble empirical mode decomposition (EEMD) method was studied experimentally. The component induced by cavitation was separated from the vibration signals through the EEMD method. The results show that the IMF2 component has the largest amplitude and energy of all components. The root mean square (RMS) value, peak value of marginal spectrum, and center frequency of marginal spectrum of the IMF2 component were studied in detail. The RMS value and the peak value of the marginal spectrum decrease with a decrease of cavitation intensity. The center frequency of marginal spectrum is between 12 kHz and 20 kHz, and the center frequency first increases and then decreases with a decrease of cavitation intensity. The change rate of the center frequency also decreases with an increase of inlet pressure.
Introduction
A poppet valve is a hydraulic valve widely used in closed circuit systems that is characterized by its fast response, low cost and tolerance to contamination. Although the poppet valve structure is simple, the flow field inside a poppet valve is complex. In particular, when the hydraulic oil passes through the orifice, it will produce local low pressure, which will induce cavitation near the orifice. The cavitation often brings harmful effects to hydraulic valves, such as cavitation erosion, pressure pulsation, vibration, and noise. 1 Therefore, the monitoring of the cavitation status of the poppet valve is of great practical significance.
In recent years, many works were focused on cavitation monitoring with different research methods such as acoustic emission,2,3 ultrasonic,4,5 and sound pressure.6,7 Vibration analysis also has been widely used in studies on cavitation of hydraulic machinery, employing a variety of signal processing techniques. Based on the principal component analysis and other methods, McKee 8 proposed a vibration cavitation detection method. And this method is verified by vibration signals measured from various pumps. In Ramadevi’s work, 9 the cavitation signal generated by a centrifugal pump cavitation test rig, is studied by discrete wavelet transform and the relationship between the average value of coefficient and cavitation state is obtained. In the diagnosis of centrifugal pump health status based on partial linearized neural network (PNN), wavelet transform can well separate the cavitation feature from the vibration signal of centrifugal pump. 10 In addition, the envelope analysis has been widely used in fault diagnosis, too. Such as this methods is used to detect cavitation. 11 And the statistical time-domain features and a decision tree are also used to detect the cavitation in Sakthivel et al.’s 12 work. In Azizi’s 13 work, the empirical mode decomposition (EMD) is used to decompose the vibration signal, which can better separate the cavitation characteristic signal.
In the other hand, the EEMD does not have the disadvantage of mode mixing of EMD and the EEMD method has been successfully applied to rotors, ball bearings, and gearboxes diagnosis.14–17 Furthermore, in the available literature, the majority of research on cavitation of hydraulic equipment is on pumps, but the research on the influence of different cavitation degrees of hydraulic valves on vibration characteristic signals has not been sufficiently studied.
In this paper, a series of cavitation experiments were conducted for a poppet valve model. During the experiment, the vibration signals and cavitation images of the poppet valve in different cavitation states were collected synchronously. Based on EEMD method and cavitation images, the component caused by cavitation was separated from the vibration signals. Several cavitation characteristic parameters were extracted as the feature parameters of cavitation with waveform and Hilbert marginal spectrum analysis. The variation law of these parameters changing over cavitation state was analyzed and lays the foundation for real-time cavitation monitoring of poppet valves.
Experimental method
As shown in Figure 1, The experimental device used in this paper consists of hydraulic device, vibration signal acquisition device and shadow photography device.

Schematic diagram of the experimental system.
During the experiment, the hydraulic oil flows from the tail of the spool to the spool head in the experimental poppet valve. The pressure reducing valve is used to adjust the inlet pressure of the experimental valve, and the back pressure valve is used to adjust the outlet pressure of the experimental valve. And the corresponding two pressure values are measured by a pressure gauge 1 (Range: 0–16 MPa, Precision grade: 0.4) and pressure gauge 2 (Range: 0–4 MPa, Precision grade: 0.4), respectively. The flow through the experimental poppet valve is measured by a turbine flow meter (Model: YH-LWC10SLA, Accuracy: 1.0%). In this experiment, No. 46 anti-wear hydraulic oil is used, with a density of 889 kg/m3 and a kinematic viscosity of 4.5 × 10⁻⁵ m2/s. The valve body was processed with a transparent PMMA material to obtain the image of the cavitation flow inside the experiment poppet valve.
The vibration signal acquisition device includes an acceleration sensor, a data acquisition device, and a computer. The vibration signal of the experimental valve is converted into electrical signal by acceleration sensor (Model: 621B51, Company: PCB Piezotronics) and outputs the electrical signal to the data acquisition device (Model: LMS SCADAS Mobile 05, Company: Siemens). In order to obtain the cavitation vibration signal better, the acceleration sensor is installed on the upper surface of the experimental valve body and close to the valve core adjusting screw, as shown in Figure 1. The vibration signals were collected and recorded by the data acquisition device and the computer. In this paper, the sampling rate is set to 150 kHz and the number of sampling points is 2000.
The high-speed photography device consists of a high-speed camera (Model: Hispec3, Company: FASTEC), a light source, and a frosted glass. The camera and light source were arranged on either side of the experimental poppet valve. In this experiment, the frosted glass was used to produce uniform lighting and the high-speed camera was set to a frame rate of 1000 fps and a resolution of 1280 × 1024 pixels. The shadow photographs of the cavitation flow and the vibration signals of the experimental valves were collected and recorded through this experimental system.
Signal processing methods
The method of EEMD
The typical marginal spectrum of the vibration signal corresponding images of cavitation flow are shown in Figure 2. Figure 2(b) is an image without cavitation and Figure 2(c) is an image with cavitation. The cavitation occurs in the fluid area between the spool head and the valve seat. Figure 2(a) is the marginal spectrum of the vibration signal corresponding to these two images. The data indicates that when cavitation occurs, there are several signal peaks in the high frequency region of the marginal spectrum of the vibration signal. In other words, the cavitation vibration mainly causes an increase in the energy level of the high-frequency band, particularly in the energy level between 10 kHz and 20 kHz.

Contrast of the marginal spectrum and image contrast in the state of cavitation and no cavitation: (a) the marginal spectrum in the state of cavitation and no cavitation, (b) the image of no cavitation, and (c) the image of cavitation.
In order to obtain the characteristics of cavitation vibration signal, the EEMD method was used to study the different frequency components of original signals. The EEMD method can decompose the original time-domain signal into a finite number of oscillation modes.18,19 In this method, a uniform reference background is established by adding white noise into the time-frequency space, and the signals of different scales are automatically projected onto the corresponding reference scales. Therefore, A group of the signals mixed with white noise

Here,
Then, using the EMD method to decompose the signals

Then each IMF is transformed into signal amplitudes and instantaneous frequencies as functions of time by using the Hilbert transform method. Therefore, the original signal

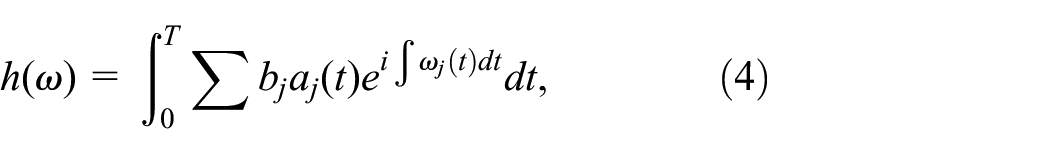
Here,
In this paper, the cavitation vibration signal is decomposed into several IMF components by EEMD method, and the Hilbert marginal spectrum of each IMF component is calculated, as shown in Figure 3. In Figure 3, column a and column b are time-domain signals and marginal spectrums of the IMF components, respectively. The data indicated that each IMF component contained different frequency components from the high frequency to the low frequency of the original signal. As shown in Figures 2 and 3, the center frequencies of IMF1, IMF2, IMF3, and IMF4 components are about 38 kHz, 16 kHz, 10 kHz, and 5 kHz respectively. And the marginal spectrum of the IMF2 and IMF1 component having significant transitions before and after the occurrence of cavitation. However, the resonant frequency of the acceleration sensor used in the experiment is about 35 kHz, and the center frequency of the IMF1 component of the cavitation vibration signal obtained in this paper is near the resonant frequency of the sensor. Therefore, the marginal spectrum of IMF1 component cannot be used to analyze the characteristics of cavitation vibration signal. The center frequency of the IMF2 component is much lower than the resonance frequency of the sensor, and the IMF2 component had the greatest amplitude of the marginal spectrum among the IMF components. So, the IMF2 component was used to analyze the characteristics of cavitation-induced vibration in this paper.
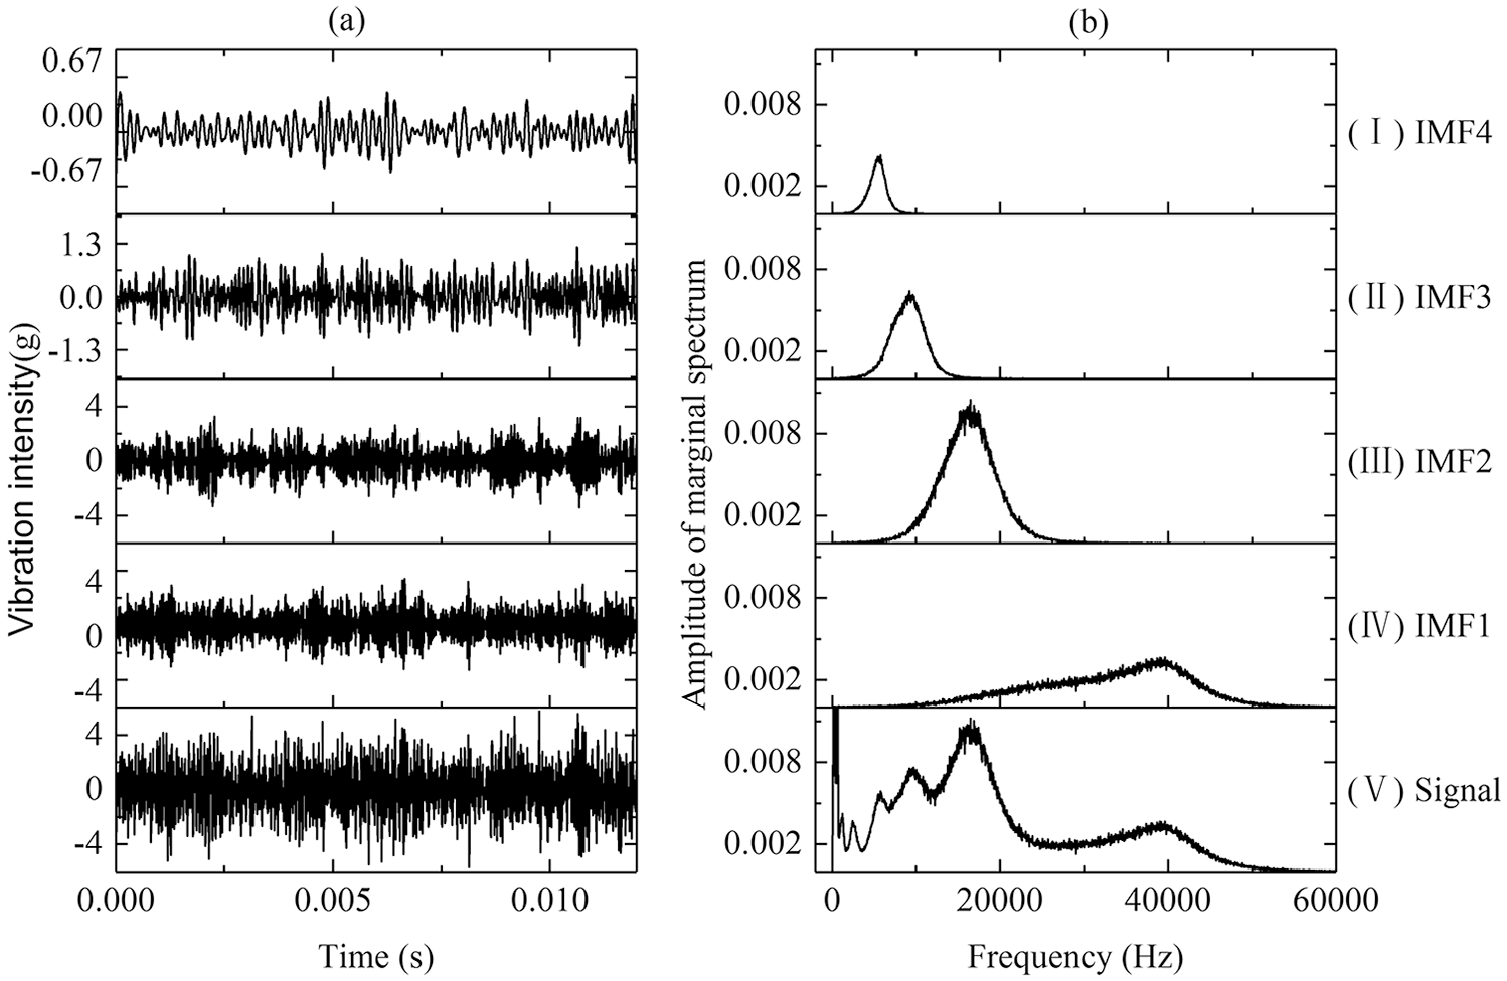
Time-domain signals and marginal spectrum of IMF components: (a) the time-domain signals, (b) the marginal spectrums.
The image processing method of cavitation cloud
In order to obtain the corresponding relationship between cavitation characteristic parameters and IMF2 component clearly, the image processing method is used to extract the cavitation area of experimental valve, as shown in Figure 4. Firstly, the image of cavitation region (Figure 4(c)) is obtained by subtracting the cavitation image (Figure 4(a)) and the no cavitation image (Figure 4(b)). Then, the image of cavitation area is binarized to make the cavitation area in the image easy to measure, as shown in Figure 4(d). Finally, the cavitation area can be calculated by counting the number of pixels in the cavitation area and combining with the pixel area calibration. In addition, the cavitation cloud in the poppet valve will collapse, fall off and re-form with the flow of hydraulic oil. Therefore, the location and area of cavitation cloud in the poppet valve are constantly changing. In order to reduce the measurement error of cavitation cloud area, 30 images of cavitation cloud are collected continuously under the same conditions. The cavitation cloud area in each image is obtained by image processing method, and the final cavitation cloud area is obtained by averaging these values.
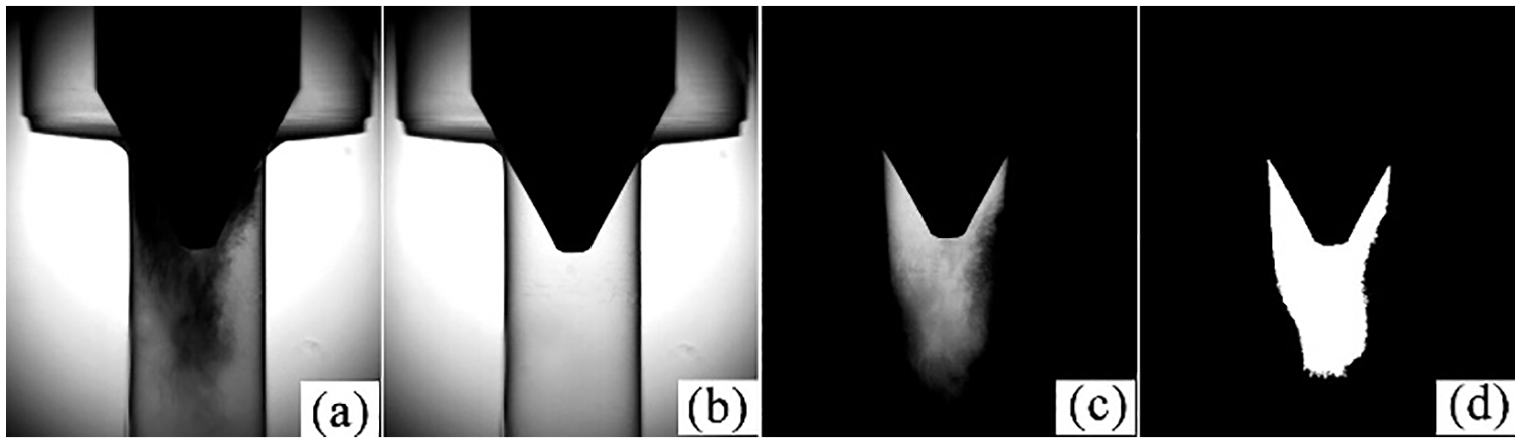
The image processing method of cavitation cloud: (a) the image of cavitation, (b) the image of no cavitation, (c) the image of cavitation region, and (d) Image of the binarization of the cavitation region.
Results analysis
The IMF2 marginal spectrum
In this paper, photographs of cavitation flow and vibration signals of the poppet valves under different working conditions were obtained. The inlet pressure ranges from 4.0 MPa to 6.0 MPa and the outlet pressure ranges from 0.6 MPa to 1.6 MPa, respectively. The marginal spectrum of signal IMF2 and the corresponding cavitation flow photographs under different cavitation intensity are shown in Figure 5. The inlet pressure is 4.5 MPa, the opening is 0.09 mm. The images showed that the pressure difference and cavitation intensity decrease with the increase of outlet pressure. In the other words, the cavitation area decreases with the increase of outlet pressure, and the cavitation cloud mainly appeared on the surface of the valve cone angle and gradually shrinks toward the valve seat corner. For example, the cavitation cloud occupied almost half of the downstream channel when the outlet pressure was 0.6 MPa, as shown in Figure 5(b) I. However, the area of cavitation cloud was very small, and only a few cavitation bubbles appeared at the throttle orifice when the outlet pressure was 1.6 MPa, as shown in Figure 5(b) VI. In addition, the marginal spectrum peak of IMF2 decreased with an increase of the outlet pressure. The corresponding center frequency first increased and then decreased with an increase of the outlet pressure.
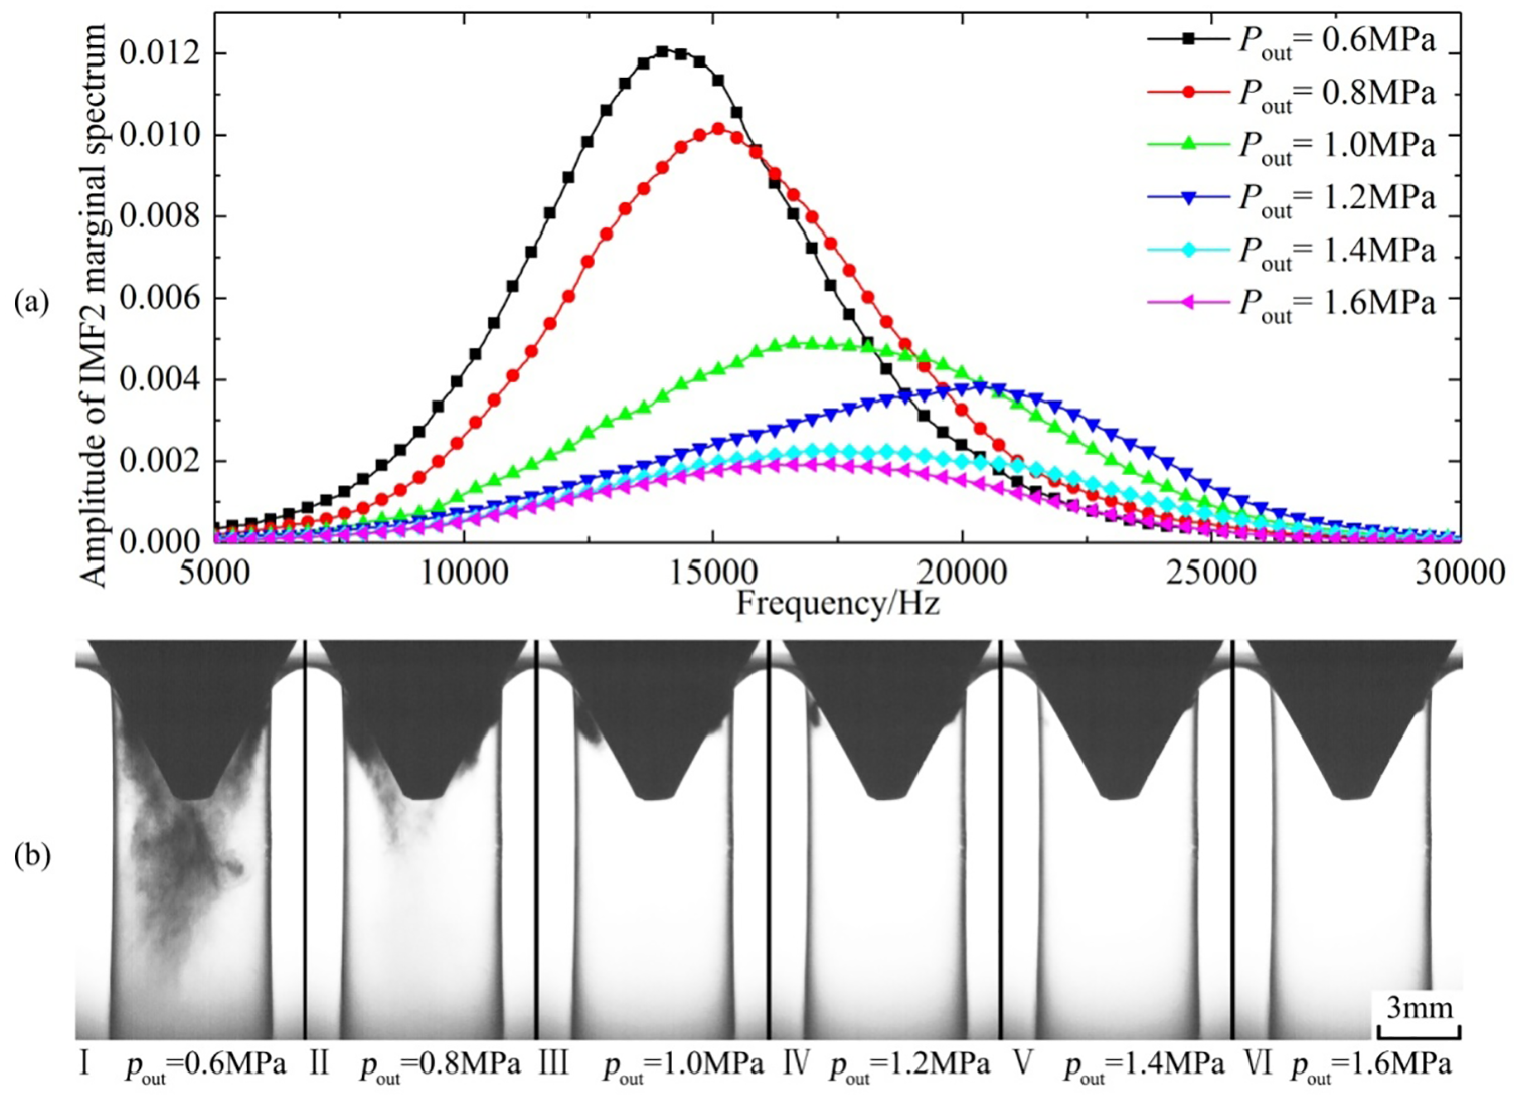
Contrast of IMF2 marginal spectrum and cavitation image at different outlet pressure: (a) the IMF2 marginal spectrum and (b) the image of the cavitation under different outlet pressures.
Characteristics of the vibration signal’s IMF2 component
The intensity of vibration signal’s IMF2 component
To study the characteristics of the vibration signal’s IMF2 component under different cavitation conditions, the root mean square value and the peak value of the marginal spectrum are used to analyze the intensity of the IMF2 component. And they can be calculated by equations (5) and (6) respectively.


where E is the root mean square value of the IMF2 component,
Based on equations (5) and (6), the root mean square value and marginal spectrum peak value of IMF2 components of different cavitation vibration signals were calculated, as shown in Figure 6. Furthermore, the opening of the experimental poppet valve was 0.09 mm. The results showed that the root mean square value and the marginal spectrum peak value of IMF2 components decreased with an increase of outlet pressure. Therefore, the intensity of the cavitation vibration signal decreased with an increase of outlet pressure. The decrease of cavitation was a result of a decrease in the pressure difference between the inlet and outlet with an increasing outlet pressure.
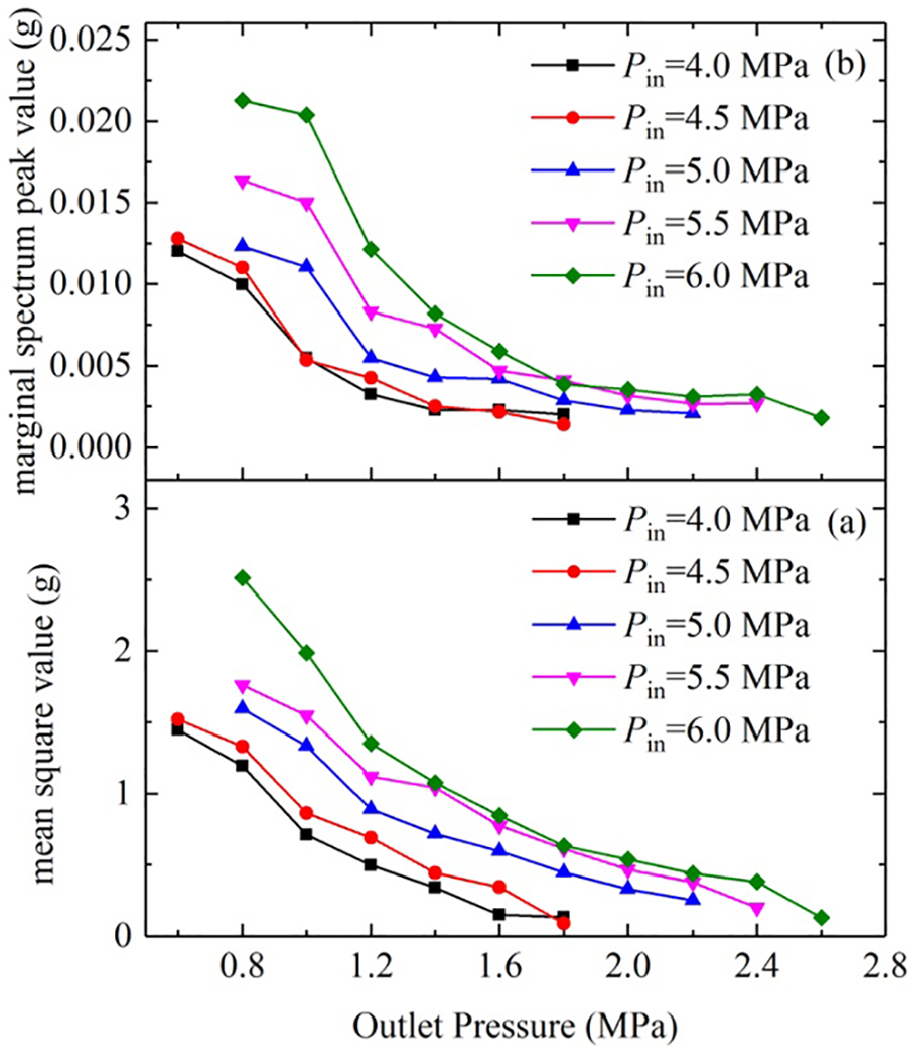
The curves of IMF2 root mean square value and marginal spectrum peak value over outlet pressure: (a) root mean square value and (b) marginal spectrum peak value.
To support this conclusion, the cavitation cloud area under different outlet pressures with inlet pressure of 6.0 MPa and opening of 0.09 mm was obtained by image processing, as shown in Figure 7. The data showed that the area of cavitation cloud decreased nonlinearly with the increase of outlet pressure. Furthermore, the effect of outlet pressure on cavitation area was similar to the influence of outlet pressure on the root mean square value and the marginal spectral peak value. Therefore, outlet pressure changed the intensity of cavitation vibration by changing the cavitation intensity.

Cavitation cloud area under different outlet pressures.
The frequency distribution of vibration signal’s IMF2 component
As we all know, the cavitation bubble often oscillated several times with the shock wave emission until it completely collapsed. 20 The poppet valve will vibrate under the action of shock wave. Therefore, the oscillation of vibration induced by cavitation in the poppet valve was equal to the oscillation period of cavitation. The oscillation could be calculated by the collapse time of the cavitation bubbles. Furthermore, the cavitation bubble within the poppet valve is oscillating in a finite-area liquid and the collapse stage of cavitation bubbles is affected by the inner wall boundary of the valve. The collapse time TC of the cavitation bubble in valve can be calculated the equation (7),21,22

where, γ=l/Rmax is the bubble’s dimensionless distance, and l is the distance between the bubble center and the boundary, Rmax is the maximum radius of the cavitation bubble, ρ is the density of the hydraulic oil, and p0 is the pressure of the surrounding liquid in this paper.
According to the research of Lauterborn, 23 the oscillation period of the bubble is two times of the collapse time. Therefore, the vibration frequency f of the hydraulic valve induced by cavitation can be expressed as

This equation shows that the vibration frequency is inversely proportional to the maximum radius and that the vibration frequency increases with an increase of dimensionless bubble-wall distance.
The maximum bubble radius of cavitation bubbles within the cavitation cloud is not the same. As a result, the vibration with different frequencies in hydraulic valves will be induced by the cavitation bubbles of varying maximum bubble radii. The amplitude of spectrum of IMF2 component first increases and then decreases with an increase of frequency, as shown in the Figure 5(a). The central frequency depends on the average maximum bubble radius of the cavitation bubbles within the cavitation cloud. Therefore, to study the frequency distribution of the vibration signal, the central frequency is also used to analyze the spectral distribution characteristics of IMF2 component. The marginal spectrum center frequency of the IMF2 component fmid is expressed as

Here, fn is the instantaneous frequency of the first n sampling point in the IMF2 component.
In order to get the relationship between the center frequency and the outlet pressure, the curve of the relationship between the center frequency and the outlet pressure is obtained by fitting the experimental data with a quadratic polynomial. The expression of quadratic polynomial is equation (10).

Here,
As shown in Figure 8, the experimental data is represented by symbols and the fitting data is represented by curves, and the opening of the experimental poppet valve is 0.09 mm. the R-square of each fitting curve corresponding to the inlet pressure of 4.0 MPa, 4.5 MPa, 5.0 MPa, 5.5 MPa, and 6.0 MPa are 0.89, 0.88, 0.89, 0.85, and 0.91. The results indicated that the center frequency is greater than 12 kHz and less than 20 kHz, and it first increased and then decreased with an increase of outlet pressure. We think that the pressure difference was large enough and the outlet pressure was small enough, the cavitation in hydraulic valves was mainly traveling bubble cavitation (as shown in Figure 5(b) I). For traveling bubble cavitation, the cavitation bubble is a great distance away from the inner wall and it has a large dimensionless radius. Therefore, the influence of the inner wall of the hydraulic valve on the collapse time of the cavitation bubble can be neglected. The collapse time of the traveling cavitation bubbles was mainly determined by the maximum cavitation bubble radius Rmax. In other words, the frequency of vibration signal induced by cavitation is mainly determined by the maximum cavitation bubble radius. In accordance with equation (9), we concluded that with an increase of outlet pressure, the average maximum cavitation bubble radius decreases and the center frequency increases. When the pressure difference between the inlet pressure and the outlet pressure is small enough and the outlet pressure is large enough, cavitation in hydraulic valves is mainly attached cavitation (as shown in Figure 5(b) V). For attached cavitation, the distance between the cavitation bubble and the inner wall of the hydraulic valve is small enough that the influence of the dimensionless bubble-wall distance on the collapse time of the cavitation bubble cannot be ignored. The area of cavitation decreases with an increase of outlet pressure. The maximum bubble radius of the cavitation bubble decreases slightly, but the distance from the bubble to the inner wall of the hydraulic valve decreases more and the dimensionless bubble-wall distance increases. Therefore, the main influence factor of the frequency of vibration induced by cavitation becomes the dimensionless bubble-wall distance. In accordance with equation (9), we concluded that the center frequency decreases with an increase of outlet pressure when the outlet pressure is large. The data in Figure 8 also indicates that the maximum value of center frequency decreases with an increase of inlet pressure. In addition, the outlet pressure corresponding to the maximum center frequency increases with an increase of inlet pressure. The quadratic coefficients of quadratic polynomials are obtained by the fitted line per Figure 8. The quadratic coefficients decrease with an increase of inlet pressure, as shown in Figure 9. According to the characteristics of a quadratic polynomial, the change rate of center frequency with outlet pressure decreases with an increase of inlet pressure.

The center frequency of the marginal spectrum of the IMF2 component under different inlet and outlet pressure.

The relationship between the inlet pressure and the absolute value of quadratic coefficient.
Conclusions
The poppet valve structure is widely used in hydraulic systems because of its advantages of fast response, low cost, and tolerance to contamination. However, the cavitation within the poppet valve can easily cause the control performance of the hydraulic poppet valve to decrease or to become completely ineffective. In addition, cavitation will cause vibration on the valves and the characteristics of the vibration are related to the strength of cavitation. In this study, the signal analysis method of the vibration signal under different cavitation conditions was studied experimentally. The relationship between the cavitation induced vibration signal and the inlet pressure or outlet pressure of the poppet valve is also studied. In this experiment, the vibration signal of the hydraulic poppet valve was measured by an acceleration sensor and the shadows photograph of the cavitation flow field with different intensities in the cone valve were obtained by a high-speed camera. To study the characteristics of vibration signals, the signal analysis method based on EEMD was proposed to decompose the vibration signals into different components. The Hilbert marginal spectrum of the corresponding components were also calculated. The results show that the marginal spectrum of the vibration signal induced by cavitation has several peaks between 10 kHz and 50 kHz compared to the vibration signal induced by no cavitation. The IMF2 component had the highest amplitude and energy among all the IMF components decomposed by EEMD. Therefore, the IMF2 component was used as the characteristic parameter of the vibration signal induced by cavitation. The data indicated that the root mean square value, the marginal spectrum peak value, and the marginal spectrum center frequency of IMF2 component changed with the degree of cavitation. The data indicated that the root mean square value, the peak value, and center frequency of the marginal spectrum of IMF2 component changed with the change of cavitation state. The area of cavitation cloud decreased nonlinearly with the increase of outlet pressure. The root mean square value and the peak value of the marginal spectrum of the corresponding IMF2 component also decreased nonlinearly. In other words, they decreased with a decrease of cavitation intensity. Furthermore, the marginal spectrum of the IMF2 component showed that the center frequency was between 12 kHz and 20 kHz and the center frequency first increased and then decreased with the increase of outlet pressure due to the inner wall of the spool. In addition, the change rate of center frequency decreased with an increase of inlet pressure. In conclusion, the characteristic parameters of IMF2 component obtained by EEMD method could adequately analyze the strength of cavitation flow in poppet valves. This analysis method also provides theoretical basis for on-line monitoring of cavitation flow in cone valves.
Footnotes
Handling Editor: James Baldwin
Declaration of conflicting interests
The author(s) declared no potential conflicts of interest with respect to the research, authorship, and/or publication of this article.
Funding
The author(s) disclosed receipt of the following financial support for the research, authorship, and/or publication of this article: This research was funded by the National Natural Science Foundation of China (Grant No. 51875559), the Fundamental Research Funds for the Central Universities (Grant No. 2015XKMS024), and the Priority Academic Program Development of Jiangsu Higher Education Institutions (PAPD).