
Abstract
A formula is proposed based on Archard’s wear model to calculate wedge wear depth in a positive continuous engagement (PCE)-type sprag clutch with double-disc inner cam wedge in the overrun state. Methods to solve for the equation parameters are proposed. Using a sprag clutch with an M50 steel wedge as an example, wedge wear depth variation over time under high temperatures was analyzed. An easy-to-clamp wedge was designed and a high-temperature abrasion testing machine was used to test the wedge. The worn surface profile was observed using a three-dimensional profiler and the wedge wear depth was obtained. The effects of lubrication, temperature and speed on wear were analyzed using mixed-level orthogonal experimental design. Results show that the theoretical values are consistent with test values. Therefore, the model can be used to calculate wear accurately for the overrunning sprag clutch. Lubrication affects wear depth significantly, whereas temperature has a smaller effect and speed has very little influence. Within the experimental scope, when the temperature increased by 1°C, the wear depth increased by approximately 0.0145 μm and when the speed increased by approximately 1 time/minute, the wear depth increased by 0.00854 μm. These results provide theoretical support for optimal sprag clutch design.
Introduction
The positive continuous engagement (PCE)-type sprag clutch is a core component in aviation transmission systems. However, wedge wear in the overrun state is one of the main causes of system failure and can seriously limit use of the sprag clutch.
In recent years, many researchers have investigated the wear characteristics of various mechanical parts. Yu et al. 1 determined the allowable wear range for a deep-groove ball bearing according to the Archard model and observed that the wear life of the bearing decreased in tandem with increasing axial load and decreasing inner ring speed. Zhang et al. 2 designed a wet-type friction and wear test to determine the wear characteristics of a wet friction clutch and analyzed the wear of the friction pair using an oil analysis spectrometer. The amount of wear was found to increase with increasing sliding speed and increasing contact pressure. Pang et al. 3 derived an equation to describe the relationship between wear depth and the amount of wear; they then simulated the wear of a steel nonrolling wheel using ANSYS software and predicted the wheel’s wear life. Gromyka et al. 4 proposed a method to evaluate wear of mining tools and another method to determine the remaining lifetimes of mining equipment and loader tools in a high temperature working environment. Zheng et al. 5 studied the sliding wear characteristics of the surfaces of quadrilateral pits formed by ball milling. In addition, the relationship between the sizes of these quadrilateral pits and the wear resistance was derived and the gray correlation between the relative surface wear rate and the surface roughness was also obtained. Goel et al. 6 studied the wear performances of zinc- and chromium-coated piston rings, along with the performances of other coatings. A linear reciprocating tribometer was used to evaluate the wear and friction performances of the coatings without lubrication and the coatings were found to improve the wear performance significantly. Antoni et al. 7 proposed a novel theoretical wear-fatigue model based on the continuous damage method in a low-thickness intermediate complete plastic body. By considering complete plasticity and friction, laws governing the evolution and fretting fatigue of the sliding wear rate were obtained under low cycle fatigue conditions. Cai et al. 8 performed both experimental and numerical analyses of polygonal wear in high-speed trains and found that the magnitude of the wear depth and the phase difference between the change in wear depth and the original polygon both play important roles in enlarging the polygon. Pang et al. 9 analyzed the wear profile and the wear mechanism of a nonrolling wheel on a driving surface and then simulated the wear caused by a nonrolling wheel on a smooth surface and the microstructure of the nonrolling wheel surface using ANSYS software. The relationship between wear depth and the number of wear times was obtained and their model was validated using real-world examples. Zhuang et al. 10 studied rotating joints under various lubrication conditions and proposed a hybrid model to predict the wear life accurately.
Several researchers have also investigated wear experimentally. Kumar et al. 11 developed a dual-wear type abrasion testing machine that was able to rotate two discs, which were oriented perpendicular to each other, in the same direction at different speeds to achieve symmetrical interactions between specific points. Medium-carbon high-silicon alloy steel was used as the representative material and different treatments were performed on the steel. Rolling wear and sliding wear tests were also performed on different metals. Using American Iron and Steel Institute (AISI) D2 steel samples that were subjected several times to different low temperature treatments, Das et al. 12 analyzed the wear rates of the samples under different loads and sliding speeds experimentally and confirmed that there is a critical time to perform the low temperature treatments to achieve the best possible wear resistance. Sedlaček et al. 13 used 100Cr6 steel discs and Al2O3 balls to perform a pin-on-disc test to study the correlation between the surface roughness parameters and friction and wear. Their results showed that the surface roughness parameters had a specific influence on the coefficient of friction. Hassan et al. 14 studied the friction and wear behavior of Al-Mg-Cu alloys and SiC particle reinforced Al-Mg-Cu matrix composites at room temperature under pressure of 3.18 MPa and at a sliding speed of 0.393 m/s on a pin-disc wear testing machine. Atabaki et al. 15 performed pin-disc wear testing by applying different forces to the pin and then compared the wear performances of two types of cement industry raw material grinder. Suh et al. 16 used three ceramic ball structures, comprising ZrO2, Al2O3, and SiC balls, to perform ball-to-disc wear tests on sliding ZrO2 discs. Their results showed that the ZrO2 balls had the highest specific wear rate and the SiC balls had the lowest specific wear rate. Sreeraj et al. 17 proposed an improved dynamic load pin-disc friction and wear meter design and used the real-time hydrogenation lubrication method to simulate formation of a white corrosion zone (white etching area or WEA) on the bearing steel surface. Straffelini et al. 18 studied the tribological behavior of both a low-metal friction material and pearlitic cast iron during dry sliding and analyzed the changes in the pin-disc temperature.
Although numerous studies of wear characteristics have been performed, few of these studies have considered the influence of temperature on wear. In this study, a model of the wear depth of a PCE sprag clutch wedge in the overrun state under high temperature conditions is deduced based on Archard’s wear theory and methods to calculate the model parameters are examined. Wear depths are predicted under specified working conditions and the theoretical results are validated using experimental data to verify the feasibility of the proposed model. Furthermore, the effects of lubrication, temperature, and speed differences on wear are analyzed using mixed-level orthogonal design experiments. Finally, a fitted model of the wear depth is established based on the experimental results.
Working principle of sprag clutch
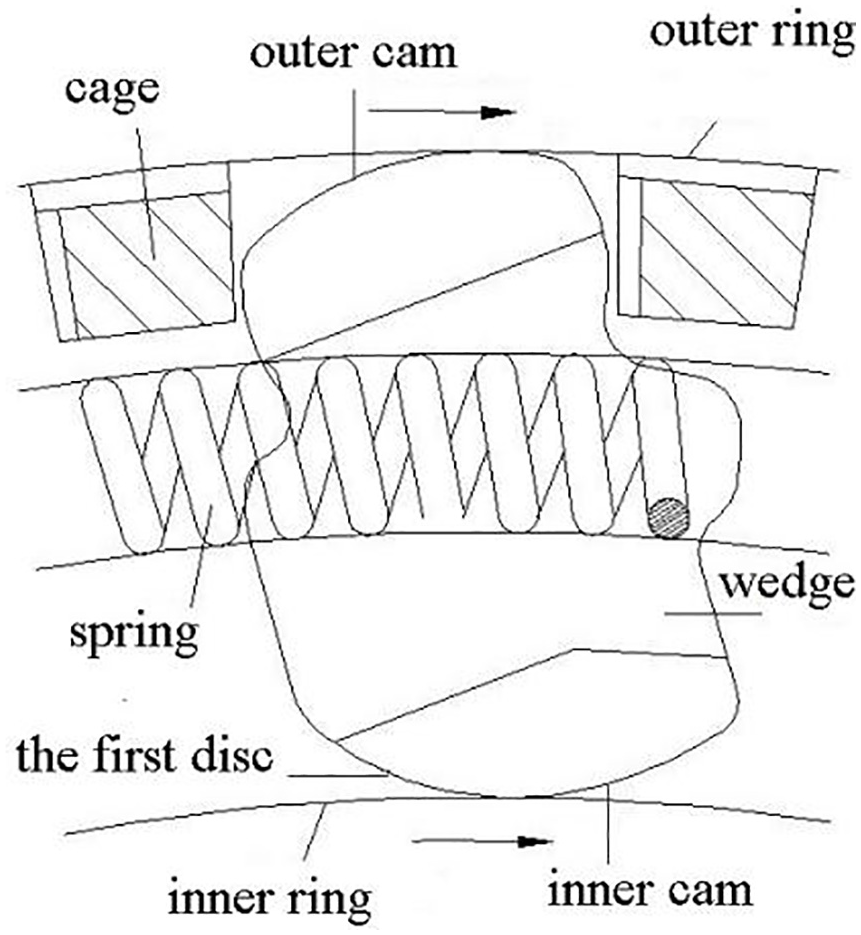
As shown in Figure 1, the PCE-type sprag clutch comprises an inner ring, an outer ring, a wedge, a spring, a cage, and several other parts. 19 As a result of the difference in rotational speed between the inner ring and the outer ring, the wedge, which is wedged between these two rings, will rotate clockwise when the clutch is in the transmission state. If the wedge rotates counterclockwise and disengages the rings, the clutch will then enter the overrun state.
Schematic diagram of sprag clutch.
Calculation of sprag clutch wear under thermal deformation
When the working temperature increases, various components of the sprag clutch then deform, leading to wear. A flowchart of the process used to calculate this wear is presented in Figure 2.
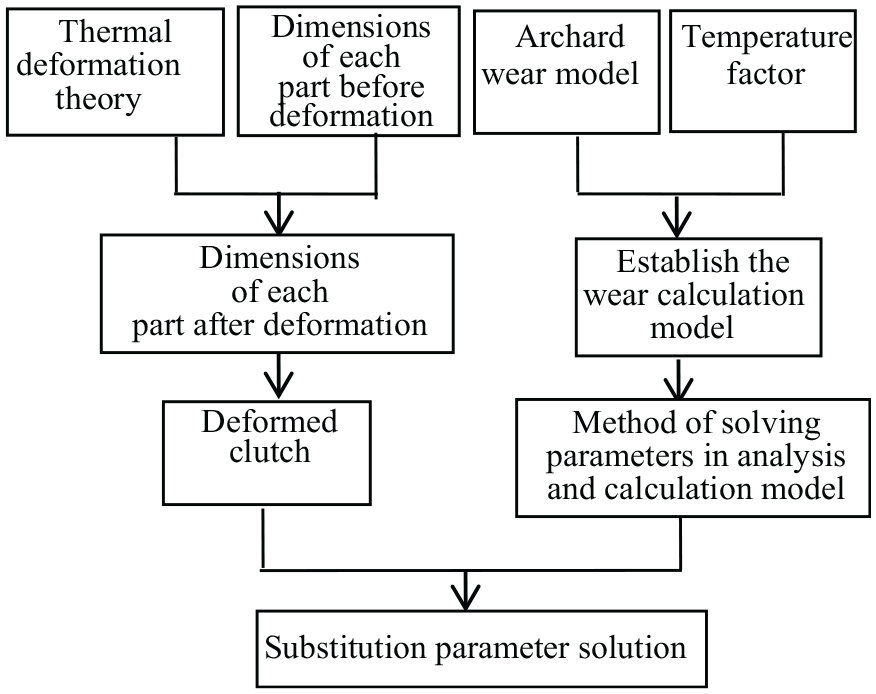
Flowchart of the wear calculation process.
Calculation of wear depth based on Archard model
In the Archard wear model, 20 the wear volume is proportional to the load acting on the contact surface and the relative slip distance between the surfaces and is inversely proportional to the hardness of the material, and can be expressed as

where V is the amount of wear, k is the wear coefficient at 20°C, N is the normal load, H is the material hardness and x is the sliding distance.
From the wear coefficient table, k is in the 10−3 to 10−4 range for a dry metal surface and in the 10−5 to 10−6 range for a well-lubricated metal surface.
In practical applications, the wear depth of the surface of a material is commonly used to reflect the overall wear. 21 At high temperatures, the depth of wear per unit time can be written as

where dh is the depth of wear per unit time and n is the coefficient of the influence of temperature on the wear rate of the material, which corresponds to the ratio of the wear depth per unit time at different temperatures to the wear depth per unit time at room temperature; k is the coefficient of normal temperature wear, N is the normal load, v is the relative sliding speed of the two contact surfaces, dt is the unit time, H is the material hardness and Sa is the contact area between the two surfaces.
By integrating both sides of equation (2), we obtain

where h is the depth of wear in a specified period of time, t0 is the wear start time and t1 is the wear end time. The meanings of the other parameters in equation (3) are consistent with the corresponding parameters used in equation (2).
Parameter-based numerical solution method for wear model formula
To obtain the wear depth, the relevant parameters must be obtained, including k, which is determined by the specific lubrication conditions and the measured hardness H of the material. 22 In addition, n can be obtained by comparing the results from wear tests performed at different temperatures. For M50 steel, the wear rate at 300°C is approximately eight times that at 20°C, i.e., n = 8. 23
In the overrun state, the wedge is pressed against the outer ring because of the spring force and the centrifugal force; therefore, the wedge and the inner ring both slide on the contact surface and the wear then mainly occurs on the inner cam of the wedge. The relative speed v of the wedge and the inner ring can be determined using a sensor to measure the relative speeds of the outer ring and the inner ring.
Next, a method to obtain Sa and N must be determined.
(1) Solution for contact area Sa
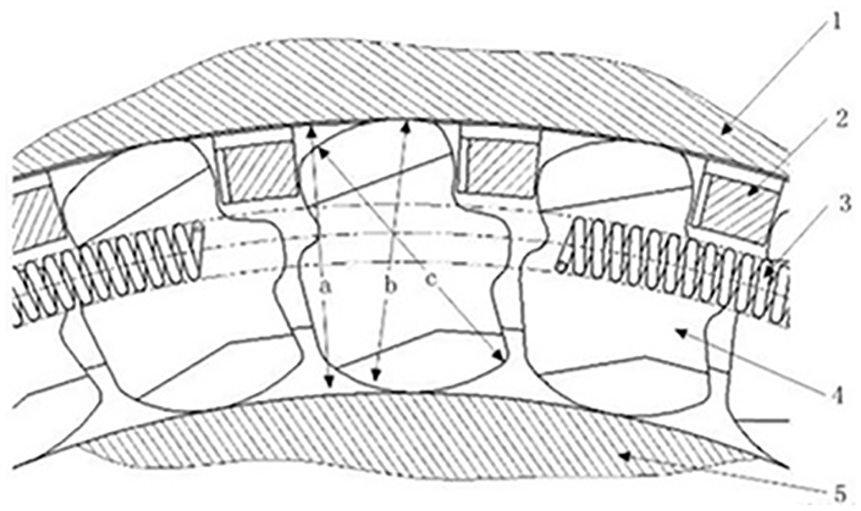
The wedge’s inner cam appears to wear from the first disc. A schematic diagram illustrating the overrun state is shown in Figure 3.
Schematic of the overrun state of the sprag clutch.
When a specified wear depth hs of the wedge is reached, the contact surface between the inner cam of the wedge and the inner ring can then be regarded as a rectangular contact surface. The contact area is therefore calculated as

where l is the axial length of the wedge, r is the first disc radius of the cam in the wedge after thermal deformation and hs is the wear depth of the inner cam in the wedge.
By substituting equation (4) into equation (2), we obtain
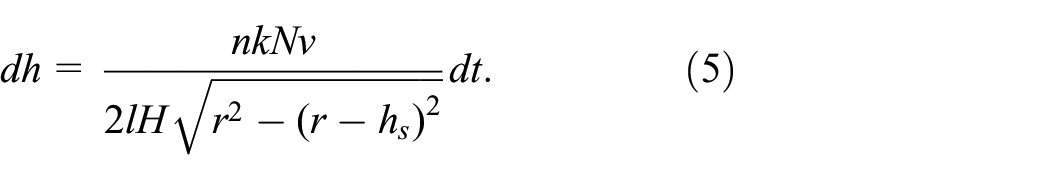
By integrating both sides of equation (5), we then obtain:
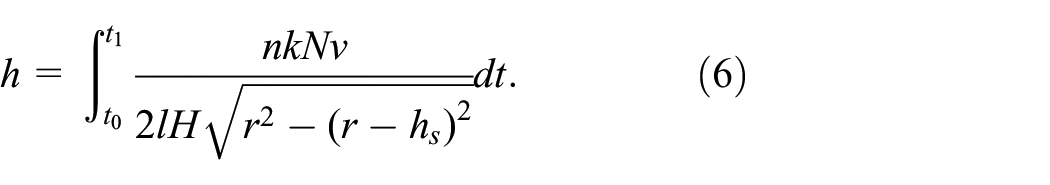
The meanings of the parameters used in equation (6) are consistent with those of the corresponding parameters used in equations (3)–(5).
From an analysis of equation (4), the following conclusions can be drawn:
① When the temperature increases, the values of r and n will increase. Because the value of r is small, the changes in n will play a more dominant role. Theoretically, an increase in temperature will lead to an increase in the wear per unit time.
② Increases in the lubrication coefficient, the normal force, and the relative speed lead to increased wear and a reduction in the hardness also leads to increased wear. Increasing the length of the wedge, however, reduces the wear.
(2) Solution for normal load N
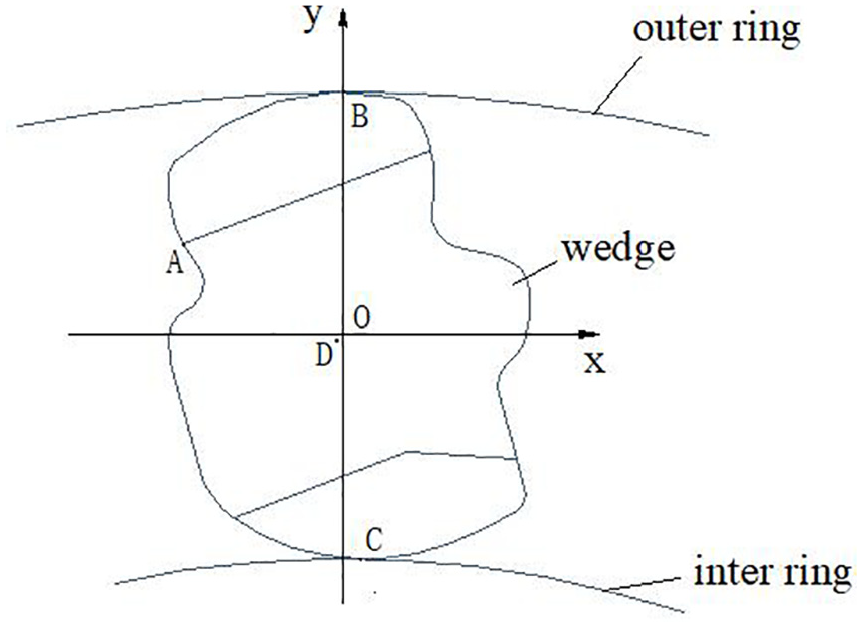
Assuming that the wedge is subjected to a uniform load, the force will follow Coulomb’s law and the clutch will be in the overrun state. The forces that act on the wedge are illustrated in Figure 4. In the figure, A is the contact point between the spring and the wedge, B is the contact point between the wedge’s outer disc and the outer ring, C is the contact point between the first disc of the inner wedge and the inner ring, and D is the wedge centroid.

Forces acting on the sprag clutch in the overrun state.
By balancing the forces acting on the sprag clutch, we obtain the following equations:


From Coulomb’s friction law, the following equations can then be obtained:


The equation used to calculate the centrifugal force is:

From the moment balance, we obtain


where Fnx and Fny are the components of the inner ring force that act on the wedge in the x and y directions, respectively; Fwx and Fwy are the outer ring forces that act on the wedge in the x and y directions, respectively; Ftx and Fty are the forces of the spring acting on the wedge in the x and y directions, respectively; FL is the centrifugal force;
For equations (7)–(15), fixed MATLAB programs can be compiled and the relevant parameters and working conditions of the wedge can then be substituted into the program to obtain the normal force Fny acting between the inner ring and the wedge; i.e., the value of N in equation (6) can be obtained.
Case analysis and verification
Example analysis
The eccentric double disc-type sprag clutch can operate at 300°C for long periods. The lubrication condition of the clutch is excellent and its key structural parameters are listed in Table 1.
Key structural parameters of the sprag clutch.

The main dimensional parameters of the clutch are shown in Figure 5.

Main dimensional parameters of the clutch.
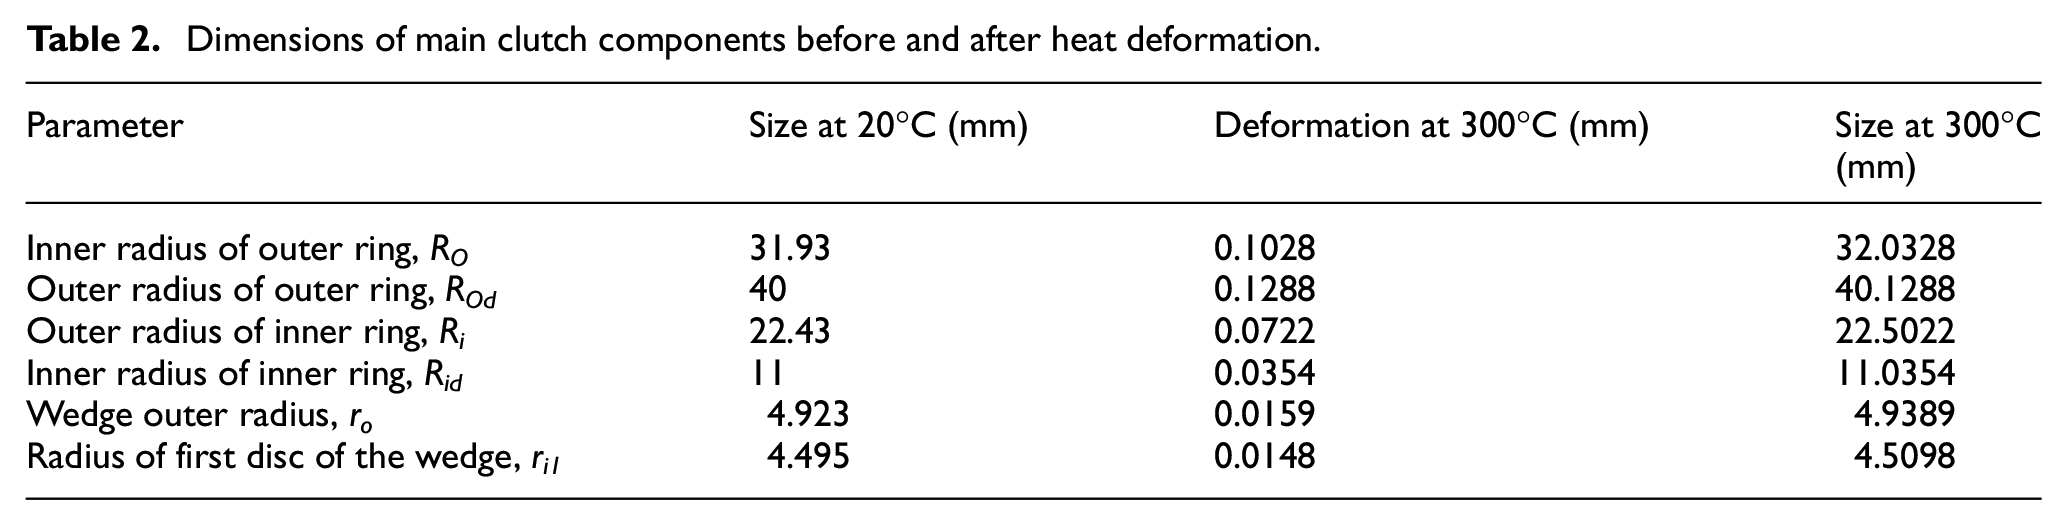
According to the theory of thermal deformation, 24 the dimensions of the main components of the clutch before and after heat deformation are listed in Table 2.
Dimensions of main clutch components before and after heat deformation.
By taking the center of the outer disc of the wedge to be the origin, the horizontal axis to be the x-axis, and the vertical direction to be the y-axis, the coordinate system was established as shown in Figure 6. The coordinate values of contact point A between the spring and the wedge, contact point B between the wedge’s outer disc and the outer ring, contact point C between the second disc of the inner wedge and the inner ring, and the centroid of the wedge D are presented in Table 3.
Schematic illustration of the coordinate system construction.
Coordinates of the main points of the clutch.

The parameters in Equations (7)–(15) can be either calculated or obtained directly for known conditions. By solving the system of equations, the normal load between the inner ring and the wedge Fny is approximately 1 N. Furthermore, the linear speed difference between the inner ring and the wedge was measured using the sensors to be 416.7 mm/s and 666.7 mm/s under the two operating conditions.
The values of the first disc radius of the cam in the wedge r, the axial length of the wedge l, the Rockwell hardness of the wedge, the wear coefficient k (k=10−5) under excellent lubrication conditions and the temperature coefficient of the M50 bearing steel wear rate n (n = 8) were then obtained and substituted into Equation (6). Furthermore, based on the speed difference above, the relationship between the wear depth and the wear time at 300°C can be defined in MATLAB (v2016) using Equation (6), as shown in Figure 7.

Relationship between wear depth and wear time.
Figure 7 demonstrates that at 300°C, when the wear time is 30 minutes, at the relative speed of 416.7 mm/s, the wear depth is 0.00238 mm; however, under the same conditions at the relative speed of 666.7 mm/s, the wear depth is 0.00321 mm. In all cases where the other conditions remain the same, an increase in the speed difference will cause an increase in the wear depth.
Experimental validation
Experimental equipment and materials
The abrasion test was carried out using the CFT-I multifunctional material surface comprehensive performance tester produced by the Lanzhou Institute of Chemical Physics, Chinese Academy of Sciences; the tester is shown in Figure 8.

CFT-I multi-functional material surface. comprehensive performance tester
Specifically, to analyze the effects of temperature on wear, a heating furnace was added to the original equipment for heating.
A three-dimensional (3D) model of the actual wedge is shown in Figure 9(a). In the overrun state, the wear mainly occurs on the first disc of the wedge inner cam. To simulate the wear of the wedge inner cam and the wear of the inner ring, a wedge with a contact disc surface that was consistent with the first disc of the wedge inner cam was manufactured for the friction tests, as illustrated in Figure 9(b).

3D illustration of test wedge and friction disc.
The actual wedge size is very small and the wedge structure is not easy to clamp; therefore, some areas on the test wedge were processed to ensure a smooth surface and thus enable smooth clamping of the wedge.
The test wedge was composed of M50 bearing steel and was heat-treated using a standard heat treatment method at the electrical alloy factory in Central South University. The surface hardness of the wedge was HRC 62 to 65, the surface roughness Ra was 0.6 and the radius of the disc of the wedge was 4.495 mm. The friction disc was made from M50 steel and was heat-treated as follows: oil quenching at 1150°C plus tempering at 565°C for 2 hours, twice. The surface hardness was also HRC 62 to 65 and the surface roughness Ra was 0.6. Additionally, the friction disc was also manufactured. A 3D illustration of the modified wedge and friction disc is presented in Figure 9(c).
Experimental parameters
If the relative speed is too high, the wear conditions are then difficult to simulate using the wear equipment. To analyze the wear depth accurately, the relative speed between the modified wedge and the friction disc was reduced by a factor of 10:1 and the normal contact force was increased by a factor of 10:1. The following conditions were used in the experiments:
① The friction type was set as reciprocating friction with a reciprocating length of 5 mm, a friction time of 30 minutes and a normal contact force of 10 N.
② The heating furnace was heated using a temperature controller box such that the experimental temperature reached 300°C, with reciprocating speeds of either 500 times/minute or 800 times/minute on the test machine. The round-trip length was 5 mm; therefore, these speeds were equivalent to the relative speeds between the wedge and the inner ring of 41.67 mm/s and 66.67 mm/s, respectively. The wear depth was analyzed under immersion lubrication conditions.
③ Based on the status of the equipment, a larger wear coefficient value of 10−5 was selected for excellent lubrication conditions.
Experimental procedure
The experiments were carried out according to the following steps:
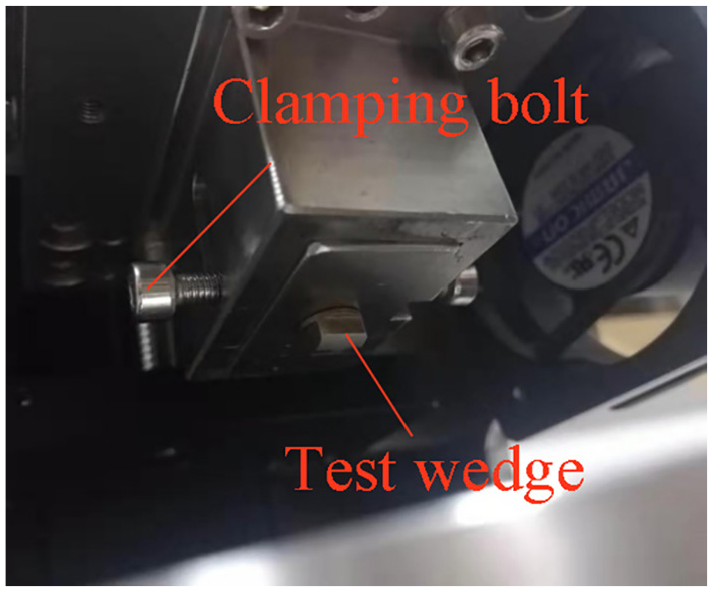
① The friction disc was placed in the heating furnace and the larger circular clamp with threaded holes was placed on the friction disc. The circular clamp was then fixed using the fixing screws; the friction disc could then be rubbed. In addition, the test wedge was inserted into the fixture on the heating furnace and the clamping bolt was screwed in from the side of the fixture to fix the test wedge in place. The instrument was turned on and allowed to preheat for 15 minutes. The friction disc and the friction test wedge were clamped as shown in Figure 10.

Clamping of the friction disc.
As observed from the bottom toward the top, the clamping effect of the test wedge is illustrated in Figure 11.
② The experimental parameters were set and a 1-mm-thick coating of aviation lubricant (Shanghai Institute of Organic Chemistry, Chinese Academy of Sciences) was added to the friction disc, as shown in Figure 12. The friction test was then started using the previous experimental parameter settings.
③ After 30 minutes, the test was stopped and the friction test wedge was removed from the test platform. The next friction test wedge was then clamped in the same way and the experimental parameters were varied. The subsequent test was performed on an unworn area of the friction disc.
④ The mass of the modified wedge was less than 0.00231 kg and the amount of wear caused was too small to measure; therefore, when the weighing method was used, measurement of the amount of wear did not show a significant difference. The test wedges were therefore placed in the 3D profiler for analysis and the wear was then observed.
⑤ Finally, the experimental results were analyzed.
Clamping of the wedge disc.

Friction disc with lubricating oil.
Experimental results and analysis
The appearances of the samples after the wear tests were performed at reciprocating speeds of 500 times/minute and 800 times/minute are shown in Figure 13(a) and (b), respectively .

Images of samples after friction tests at reciprocating speeds of (a) 500 times/minute and (b) 800 times/minute.
Figure 13 shows that the wedge had obvious wear. To determine the wear depth, the samples were placed in a 3D profiler and the surface morphologies of the wedges were then observed. The wear morphologies of the samples in Figure 13(a) and (b) are shown in Figure 14(a) and (b), respectively.

Wear morphologies of wedges following friction tests at reciprocating speeds of (a) 500 times/minute and (b) 800 times/minut.e
The contours of a specific part of the wear test wedge presented in Figure 14(a) and (b) are shown in Figure 15(a) and (b), respectively.
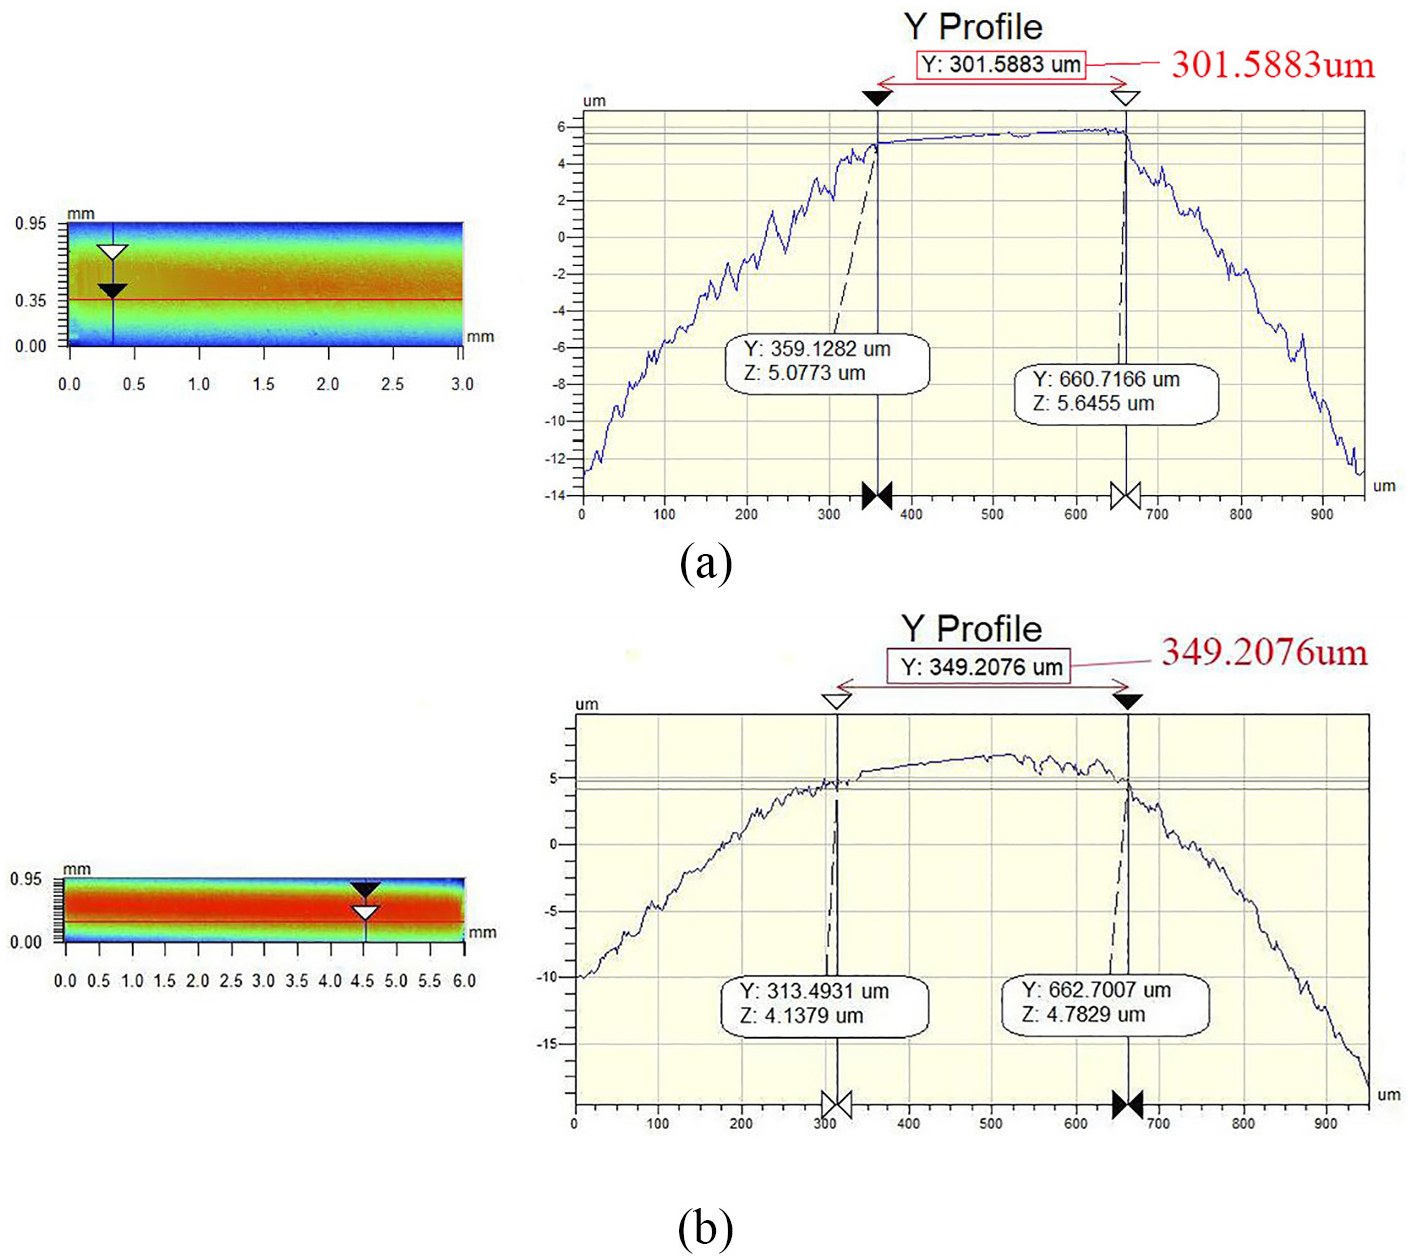
Analysis of wear width results.
Figure 15 shows that the roughness differs at the different positions. The dark red area can be considered to be the wear area and the wedge was worn in both the length and width directions. Observation of the surface morphology after wear indicates that the wear widths under the two conditions were approximately 301.5883 µm and 349.2076 µm, respectively. The wear conditions are listed in Table 4.
Wear widths and wear lengths of test wedges.

In the case of uniform test wedge wear, the actual wear depth can be calculated as:

where h is the actual wear depth; r is the original radius of the first disc of the wedge; and d is the width of the worn specimen. In our experiment, r was set at 4.495 mm and d was obtained through experimental observations, and these values were used to calculate h.
Theoretically, for reciprocating friction, the reciprocating length is 5 mm, the friction time at 300°C is 30 minutes, the normal contact force is 10 N and the theoretical wear depth can then be calculated using Equation (6). A comparison of the actual and theoretical wear values is presented in Table 5.
Comparison of actual and theoretical wear values.

Generally speaking, the allowable error range for the wear depth calculations is 20%, which means that the theoretical calculation errors in this study are acceptable, and there is a certain error margin. Therefore, Equation (6) can be used to calculate the wear depth of the sprag clutch in the overrun state under the two conditions mentioned above.
Additional MATLAB and experimental results
MATLAB analysis
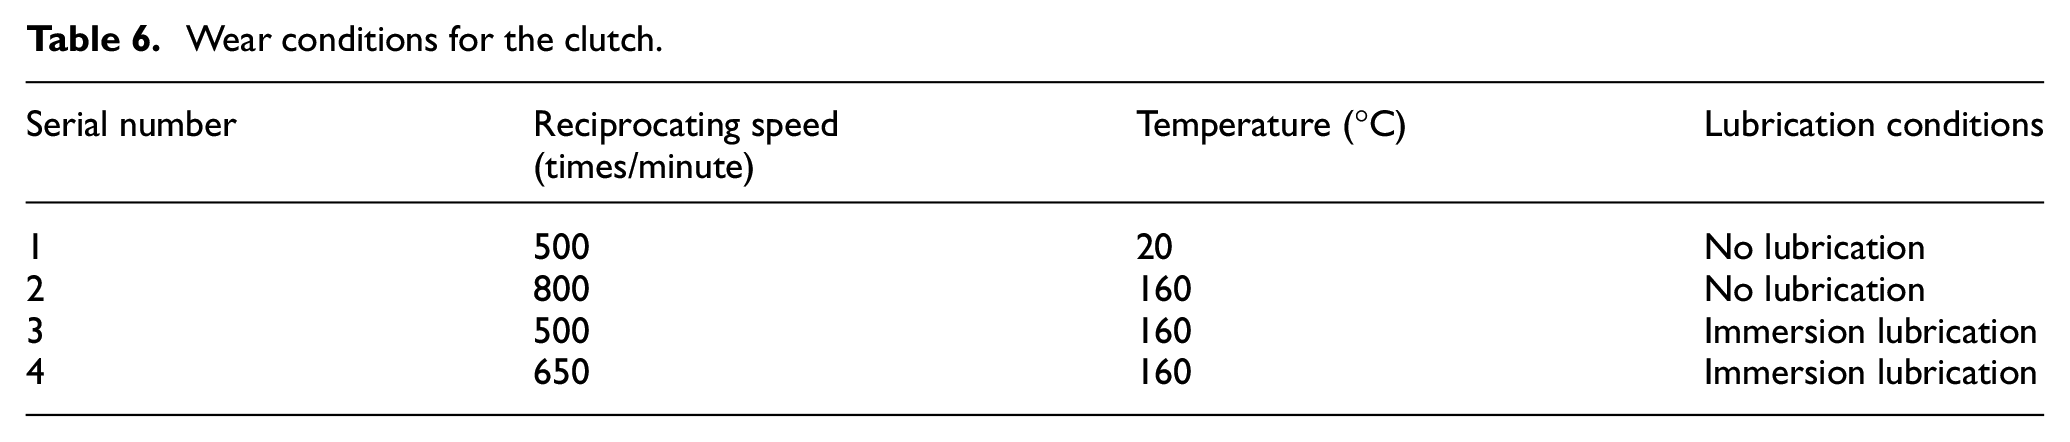
Furthermore, Table 6 presents four sets of wear conditions for the clutch, for which the key parameters are given in Table 1.
Wear conditions for the clutch.
The relationships between the wear depth and wear time under the four sets of wear conditions given in Table 6 were simulated in MATLAB (v2016) using Equation (6), with results as shown in Figure 16.

Relationship between wear depth and wear time.
When the wear time is 30 minutes, it can be seen that the wear depths are 0.00181, 0.00867, 0.00394 and 0.000654 mm under the four sets of wear conditions, respectively. This phenomenon is caused by the differences in the temperature, speed and lubrication conditions
Experimental results
For the first and second wear condition sets given in Table 6, the samples were placed in a 3D profiler and the surface morphologies of the wedges were then observed. The wear morphologies are shown in Figure 17(a) and (b), respectively.
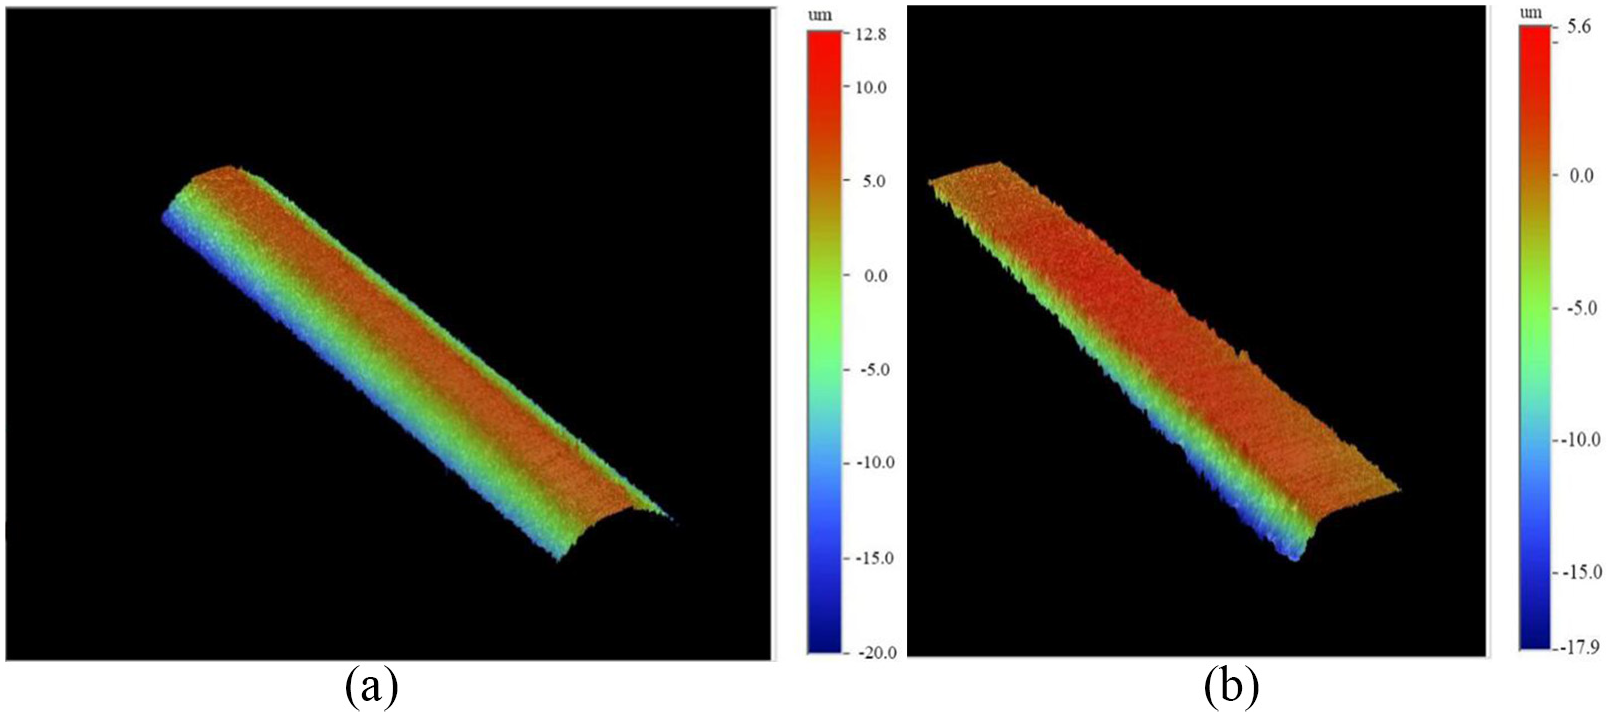
Wear morphologies of the wedges following the friction tests under the (a) first and (b) second wear condition sets.
The contours of the specific parts of the wear test wedge shown in Figure 17(a) and (b) are shown in Figure 18(a) and (b), respectively.

Analysis of the wear width.
From the results shown in Figure 18, it is found that the wear widths on the samples are approximately 253.9691 µm and 563.4940 µm, respectively.
The samples that were tested under the third and fourth wear condition sets in Table 6 were then placed in a 3D profiler and the surface morphologies of the wedges were observed. The corresponding wear morphologies are shown in Figure 19(a) and (b), respectively.

Wear morphologies of wedges following friction tests under the (a) third and (b) fourth wear condition sets.
The contours of specific parts of the wear test wedges presented in Figure 19(a) and (b) are shown in Figure 20(a) and (b), respectively.

Analysis of the wear width.
From Figure 20, it is determined that the corresponding wear widths were approximately 121.0322 µm and 132.9370 µm, respectively.
In this way, the wear widths of the wedges under the four sets of conditions can be obtained. Using the same method that was used earlier, we can then calculate the actual wear and the theoretical wear using Equation (6); the results are presented in Table 7.
Comparison of actual and theoretical wear results.

The errors are within the allowable range in each case; these results therefore further illustrate that Equation (6) can be used to calculate the wear depth. At the same time, the wear depth is shown to increase with an increase in the relative speed in each case.
Influence of various factors on wear
To determine the rules that govern changes in the wear depth under the different working conditions, an experimental scheme was designed based on the orthogonal test method. For a wedge made from M50, the friction type was set as reciprocating friction, with a reciprocating length of 5 mm, a friction time of 30 minutes and a normal contact force of 10 N. The effects of the relative speed, temperature and lubrication conditions were studied. The experimental ranges for these parameters were set at 500 to 800 times/minute, 20 to 300°C and no lubrication or immersion lubrication, respectively, based on prior experience. To simplify the experiments, three levels of relative speed and temperature were selected along with two lubrication conditions. The quasi-level method was used for the analysis, i.e., factors with fewer levels were classified into high-level factors for processing. The specific parameter values used in the experiments are listed in Table 8.
Parameter values used in the orthogonal wear tests.

Images of the above samples after wear testing in the CFT-I multifunctional material surface comprehensive performance tester under the different working conditions are shown in Figure 21.

Samples from wear tests performed under the different working conditions in the CFT-I multifunctional material surface comprehensive performance tester.
Using the same method that was adopted for the previous analysis, the average wear depths of the different samples were obtained and a mixed-level orthogonal analysis was performed, with results as shown in Table 9.
Results of orthogonal analysis of wedge wear

The results indicate that the wear depth values obtained for specimens 6 and 8 are larger.
Using the parameters presented in Table 9, the average yield at a range of different levels can be obtained, and the corresponding results are summarized in Table 10.
Average yields and ranges of the different levels.

Among the ranges of the various factors, the order is R(lubrication) > R(temperature) > R(speed). The factors that influence the wear depth most strongly are lubrication conditions, temperature, and speed, in descending order.
In addition, an analysis of variance was performed for the wear depth values and the results are presented in Table 11.
Analysis of variance table.

Because the F-value of the lubrication is greater than that of F0.05(1,3), the lubrication has a significant influence on the wear depth within the given range. At the same time, the F-value of the temperature is greater than F0.1 (2, 3) and thus the temperature will also have a certain influence. However, the speed has only a small effect.
To provide a further analysis of the effects of the temperature, speed, and lubrication conditions on wear, a regression analysis was performed and the results are listed in Table 12.
Factor level coding table.

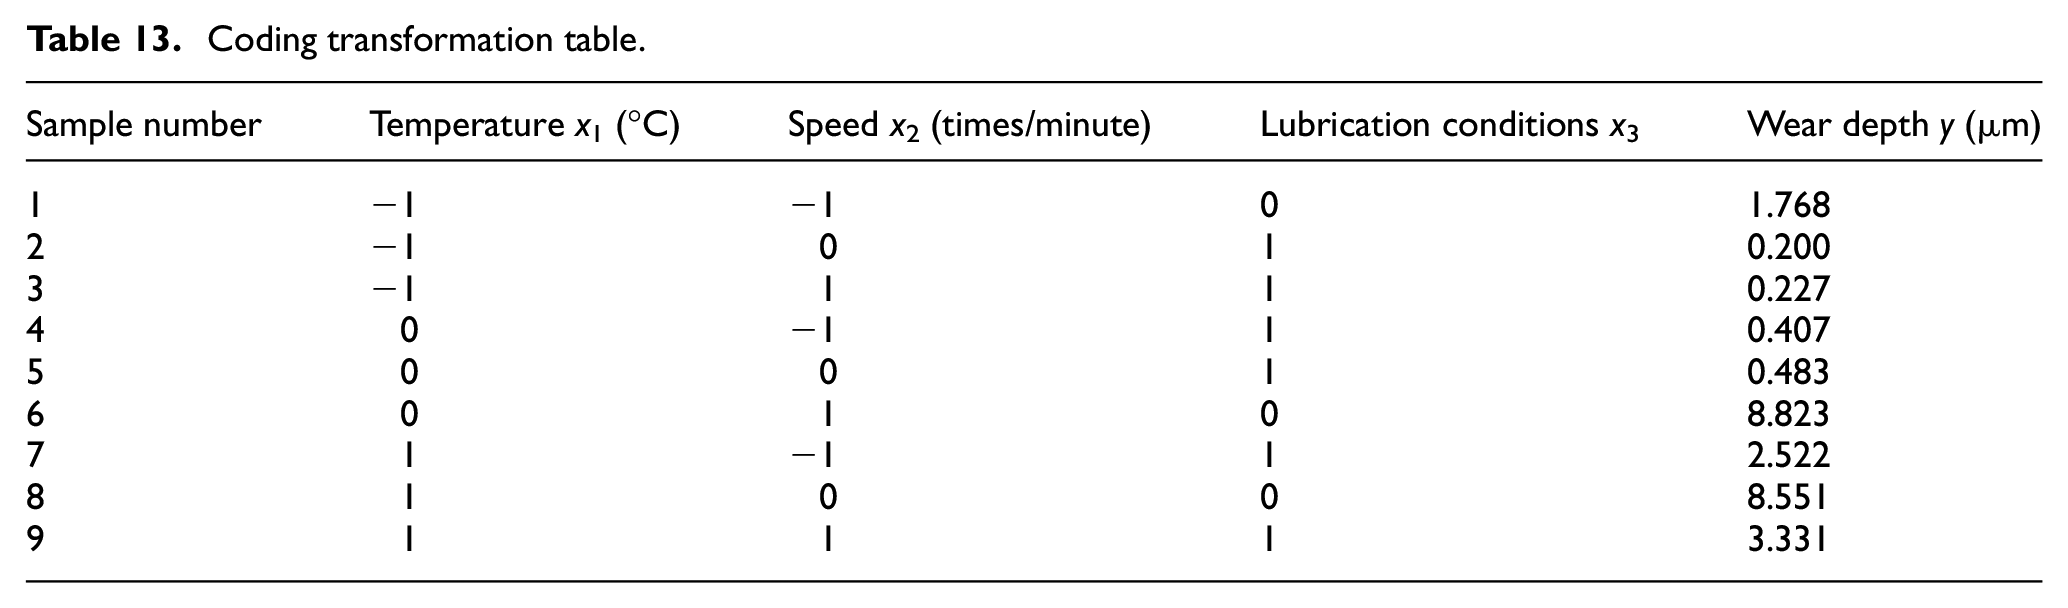
Based on the results from Tables 8, 9 and 12, the results of the coding transformation are presented in Table 13.
Coding transformation table.
Then, the following regression equation was obtained:

By substituting the coding formula for each factor in Table 9 into the regression formula, the following formula was obtained:

where x3 is 0 or 1, depending on the specified lubrication condition.
The regression equation shows that if the lubrication conditions remain unchanged, a temperature increase of 1°C will cause the wear depth to increase by approximately 0.0145 μm within the experimental range. For an increase in speed of approximately 1 time/minute, the wear depth will increase by 0.00854 μm. Under immersion lubrication conditions, the wear depth that is calculated using the regression formula may have a negative value, but this value is within the allowable error range.
Conclusions
Based on the Archard model, a formula to calculate the wear depth of a wedge in a PCE-type sprag clutch with a double-disc inner cam operating in the overrun state under high temperature conditions was proposed. Solution methods for each model parameter were also introduced.
The wedge was designed for easy clamping within the test device and a wear experiment with appropriate clutch working conditions was designed. Wear depths were obtained using a 3D profiler under specified working conditions and the results were compared with the theoretical values to verify the proposed theoretical formula.
Using a mixed-level orthogonal experimental design, we showed that the lubrication conditions have a significant influence on wear depth, while temperature has a smaller influence and the effect of the speed difference is minimal. Based on the results obtained, a fitted wear depth model was established. Within the experimental range, a temperature increase of 1°C was shown to increase the wear depth by 0.0145 μm and an increase in speed of 1 time/minute increases the wear depth by 0.00854 μm.
To improve the wear performance of the wedge of the sprag clutch when operating in the overrun state, the first disc radius of the inner cam in the wedge should be increased as far as possible and a lubricating oil that can maintain its performance at high temperatures should also be used.
Supplemental Material
sj-docx-1-ade-10.1177_1687814021996513 – Supplemental material for Wear of sprag clutch wedge in overrun state under high temperature condition
Supplemental material, sj-docx-1-ade-10.1177_1687814021996513 for Wear of sprag clutch wedge in overrun state under high temperature condition by Jia Li, Hongzhi Yan, Minghao Lin, Mengkai Cai and Xuan Hu in Advances in Mechanical Engineering
Footnotes
Handling editor: James Baldwin
Declaration of conflicting interests
The author(s) declared no potential conflicts of interest with respect to the research, authorship, and/or publication of this article.
Funding
The author(s) disclosed receipt of the following financial support for the research, authorship, and/or publication of this article: Project no. 52075552, supported by the National Science Foundation of China; Project no. 2019JJ70081, supported by the Natural Science Foundation of Hunan Province, China.
Supplemental material
Supplemental material for this article is available online.
References
Supplementary Material
Please find the following supplemental material available below.
For Open Access articles published under a Creative Commons License, all supplemental material carries the same license as the article it is associated with.
For non-Open Access articles published, all supplemental material carries a non-exclusive license, and permission requests for re-use of supplemental material or any part of supplemental material shall be sent directly to the copyright owner as specified in the copyright notice associated with the article.