
Abstract
This work presents the use as a filler of carbonized breadfruit seed coat and recycled low density polyethylene as the binder in ceiling board manufacturing. The depulped bread fruit seed was carbonized for 2 h at a temperature of 500°C. The experimental design was set up using the Design Expert software. A total of 30 experimental tests were developed for four parameters and three responses. The parameters are carbonized bread fruit seed coat/recycled Low Density Polyethylene mass ratio (filler-binder mass ratio), compaction time, compaction temperature and compaction pressure while the responses are thermal conductivity, thickness swell and water absorption. The models developed have been validated using the Study of Variance (ANOVA). Using the 3D surface map, the influence of the parameters on the responses was studied. The optimization method of the Design Expert program was used to evaluate the optimal level of the parameters that will produce the best possible result from their combination. The result gave optimal values of 16.206% filler/rLDPE, 9.406minutes compaction time, 200°C compaction temperature and 11 MPa compaction pressure, which gave 0.246% Water Absorption, 1.998% Thickness Swell and 2.898 W/M.K Thermal Conductivity.
Introduction
Nigeria has a lot of agricultural produce, producing more than ten million tons of agricultural waste annually. These waste items include: seed coat of breadfruit, rice husk, straw, bagasse, coconut fiber, maize husk, etc. Most of these wastes are often poorly discarded, causing pollution through two main ways, namely indiscriminate dumping (land, water and air pollution) and burning (greenhouse effect). However, most of these agro-waste products can be recycled into new, more environmentally sustainable products that can add value to Nigeria’s economic growth in the same way.
Filler materials reinforce the matrix by enhancing the elastic modulus and the strength of the resulting composite. Its incompatibility is the main drawback of integrating agricultural fillers into a synthetic polymer. Natural fibers are naturally hydrophilic, whereas synthetic polymers are hydrophobic. The hydrophilic properties of natural fibers lead to a high absorption of moisture, causing the fiber to change its dimensions, resulting in the swelling of the composite created and eventually rotting through fungal attack. The key causes of this biodegradation are the presence of hemicelluloses in natural fibers, while lignin is thermally stable but vulnerable to ultraviolet degradation. The goal of carbonization is to curb the shortcomings of natural fibers for use in rubber vulcanization.
Low density polyethylene is a durable and versatile polymer marked by long branches that do not pack well into crystallites. The molecules are able to pack more tightly as the chains become more linear, such as high density polyethylene. 1
In order to add unique properties to the finished product, natural cellulose fibers have also been used as the reinforcement component in polymers. A variety of polymer composite materials based on cellulose fibers have been produced using different synthetic techniques. 2 These include rice husk-saw dust,3–5 jatropha curcas seedcake, 6 water melon peels, 7 bamboo, 8 bread fruit seed coat,9,10 palm kernel fibre,11–13 cork-based composite,14,15 cane wood,15,16,17 etc. Aguele and Madufor, 13 studied the effect of carbonized coir on the physical properties of natural rubber composite. Compared with carbon black reinforced composite, the result obtained was favorable. With increasing filler loadings, they sustained a growing pattern. This work is therefore aimed at studying the effect of the carbonized breadfruit seed coat on the ceiling board’s physical properties.
Materials and method
Recycled low-density polyethylene (rLDPE) and Breadfruit seed coat (carbonized) are the materials used, while the machinery is; carbonization furnace, hot pressing unit, weighing balance, double grinding mill Asiko II, screw gauge micrometer, sieve, mold.
Preparation of materials
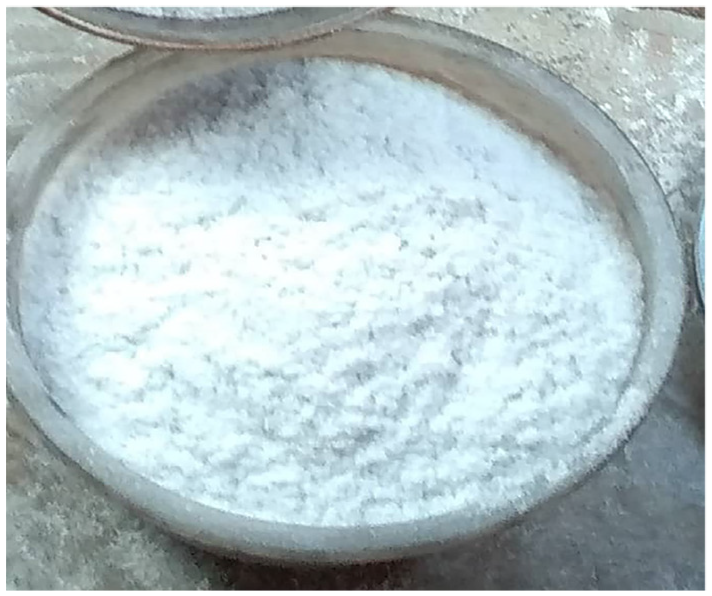
Upon processing, the breadfruit coat was dried and carbonized at the Scientific Equipment Development Institute (SEDI) in Enugu State, Nigeria, at a temperature of 500°C for 3 h using a carbonization furnace. The carbonized coats were ground and sieved to a particle size of 150 μm, adopted from the Ezenwa et al. 9 report. See Figure 1 for Breadfruit Seed coat

Breadfruit seed coat: (a) uncarbonized, and (b) carbonized.
Development of Samples
Using the experiment developed by the design software expert, thirty test samples were made. The production of the sample involved mixing the filler and rLDPE according to the ratio stipulated by the experimental design for each of the samples. Based on the compaction time, compaction temperature and compaction pressure for each sample, the mixture was then hot-pressed into a rectangular mold using a hot pressing system, see Figure 2 for recycled Low Density Polyethylene.
Recycled low density polyethylene.
Experimental Design
Using the Design Expert 10 program, the Response Surface Methodology (RSM) under the Central Composite Design was used for the experimental design. Four parameters of carbonized breadfruit seed coat/recycled low density polyethylene mass ratio (filler-binder mass ratio), compaction temperature, compaction time and compaction pressure were considered against three responses: thermal conductivity, water absorption and thickness swell. A total of 30 experimental runs consisting of 14 core points, 10 star points and 6 center points have been produced. For each factor in the design, the star points reflect new extreme values (low and high). The center points allow curvature to be calculated, while the key experimental points are the core points. The Study of Variance (ANOVA) was used for the validation of the developed model equation.
Determination of the Responses
The answers for the analysis are swelling thickness, absorption of water and thermal conductivity. After partially submerging the sample in water for 24 h, the thickness swell is expressed as the ratio of the increase in thickness to the initial thickness, while the water absorption rate is the ratio of the weight increase to the initial weight. The thickness swell and water absorption are computed using equations 1 and 2 respectively with the initial thickness To, initial weight Wo, final thickness T1 and final weight W1. Thermal conductivity is a function of the heat source’s temperature, thickness and thermal flux. Using the thermal conductivity tester, the thermal conductivity of the samples was calculated by putting the samples between the tester’s cold and hot surfaces, T1 and To, respectively. The thermal conductivity “K” is evaluated using equation (3) with “ρ” heater thermal flux, “t” sample thickness, and “A” sample surface area. From the research of Ezenwa et al., 9 the method of evaluating these responses was adopted.


Optimization of the Production Parameters
The Design Expert software optimization tool was used to optimize the output parameters. All the parameters were set to a minimum in the optimization setup in order to achieve the desired result, which is to minimize the absorption of water, thermal conductivity and thickness swelling. The optimization produced the combination of production parameters that would give the best result to be obtained.
Results and Discussion
Results
For the experimental design, the response surface technique was used, the Analysis of Variance (ANOVA) was used to validate the developed model, while the optimization tool was used to optimize output parameters.
Experimental parameters and responses
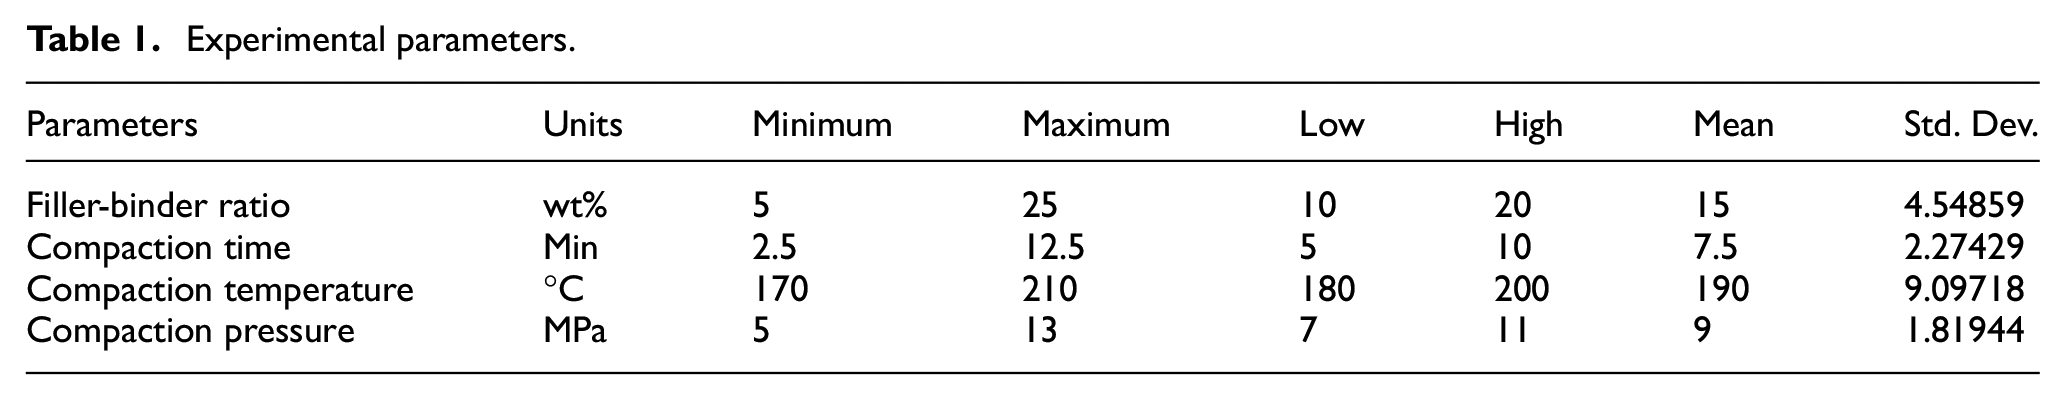
As shown in Table 1, four experimental parameters were studied (filler-binder ratio, compaction time, compaction temperature and compaction pressure). In accordance with the research conducted by Ezenwa et al., 9 the maximum and minimum values of the parameters as shown in Table 1 were set specifically to determine the yield effect of carbonizing the breadfruit seed coat and to draw a contrast between the results obtained by the use of the uncarbonized breadfruit seed coat.
Experimental parameters.
The design expert software as shown in Table 2 produced thirty experimental runs. It consists of 14 core points, 10 points of the star and 6 points of the center. The parameters under analysis (filler-binder ratio, compaction time, compaction temperature and compaction pressure) and the corresponding responses (thermal conductivity, swelling of thickness and absorption of water) for each test run are also shown in Table 2.
Experimental parameters and responses.

Experimental parameters and thermal conductivity
ANOVA and Lack of Fit Test for thermal conductivity
The ANOVA for thermal conductivity shown in Table 3, gave a Model F-value of 17.34 implying that the model is significant and has a 0.01% chance to occur due to noise. Significant model terms are identified with “Prob > F” values less than 0.0500, thus from the table it can be seen that C, D, AB, AC, AD, BD, CD, A2, B2, C2 are significant model terms, hence the final equation is reduced to;

Analysis of variance for quadratic model of thermal conductivity.

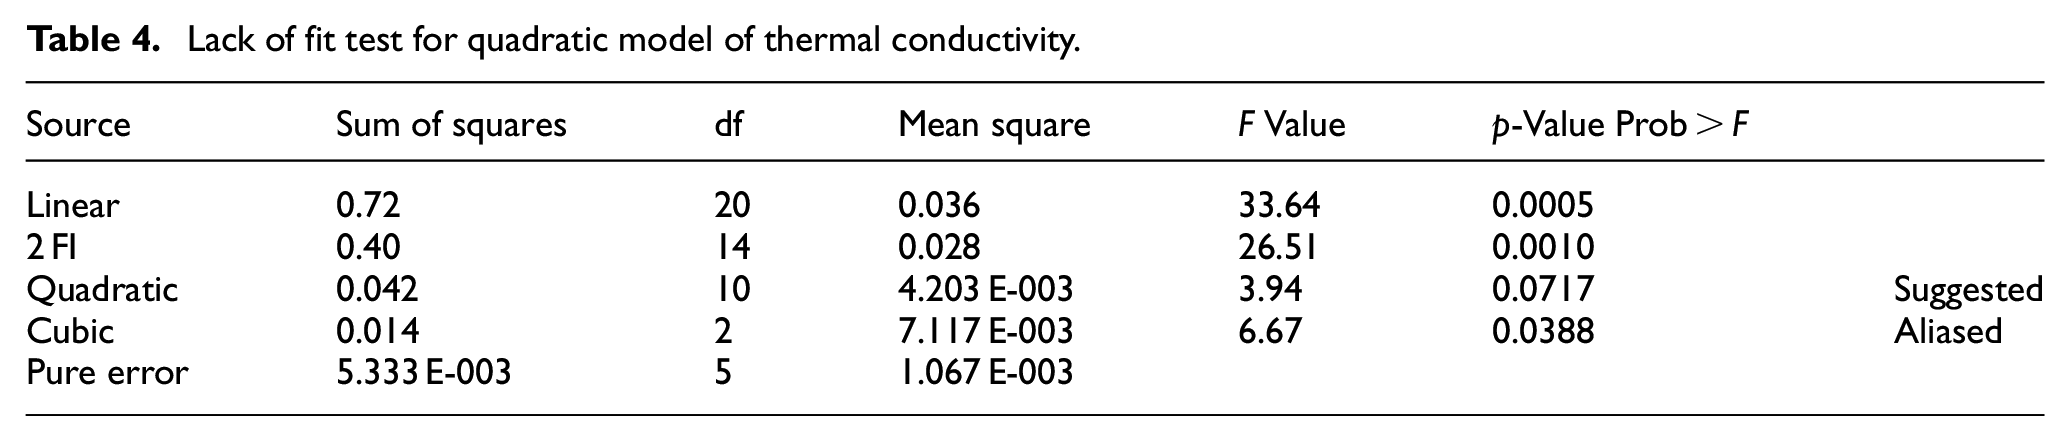
The lack of fit test for thermal conductivity is shown in Table 4, with a “Lack of Fit F-value” of 3.94 implying that it has a 7.17% chance to occur due to noise, thus the model developed is good.
Lack of fit test for quadratic model of thermal conductivity.
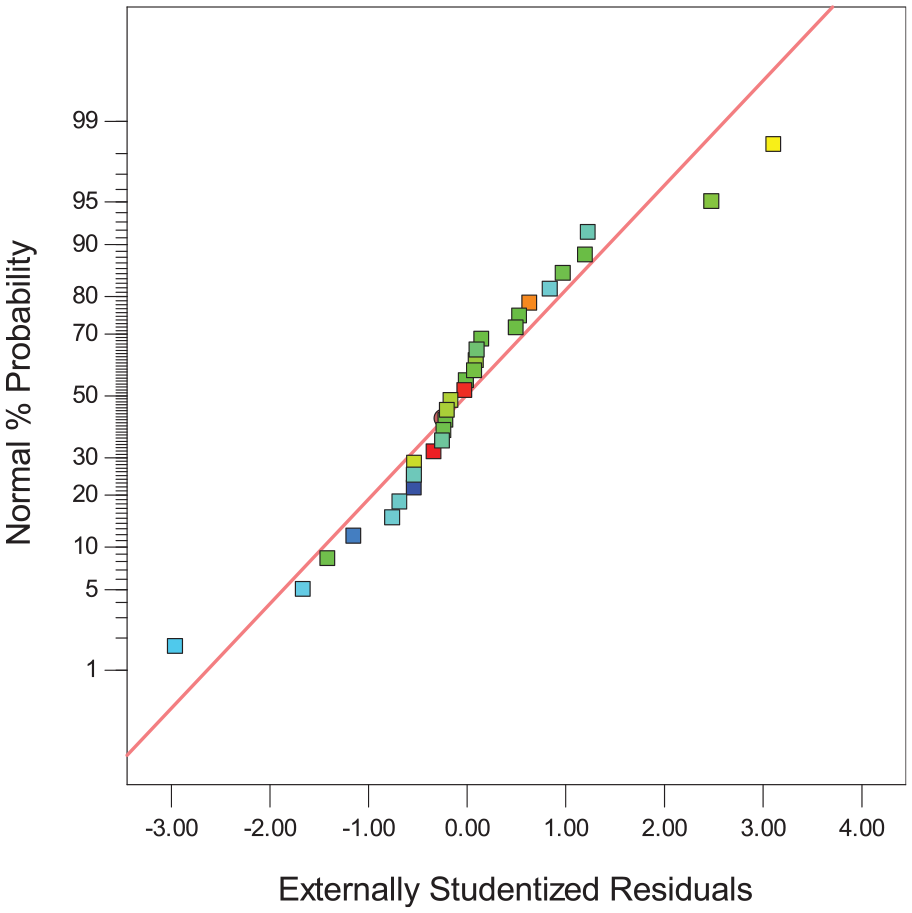
Normal probability plot for thermal conductivity
The normal plot of residuals for thermal conductivity shown in Figure 3 gave a closely packed points around the diagonal indicating that the chosen model is adequate to predict the response variable.

Normal probability plot for thermal conductivity.
Combined effect of parameters on thermal conductivity
The 3D surface plots for thermal conductivity are shown in Figure 4(a) to (f). From Figure 4(a) it can be seen that increasing the filler-binder ratio increases the thermal conductivity while that of compaction time gives a negative trend. Figure 4(b) and (c) also show a similar trend for filler-binder ratio while increasing compaction temperature and compaction pressure gave a decrease in thermal conductivity as seen in Figure 4(f). From Figure 4(d) and (e) the reverse effects of compaction time, compaction pressure and compaction temperature are seen to repeat.
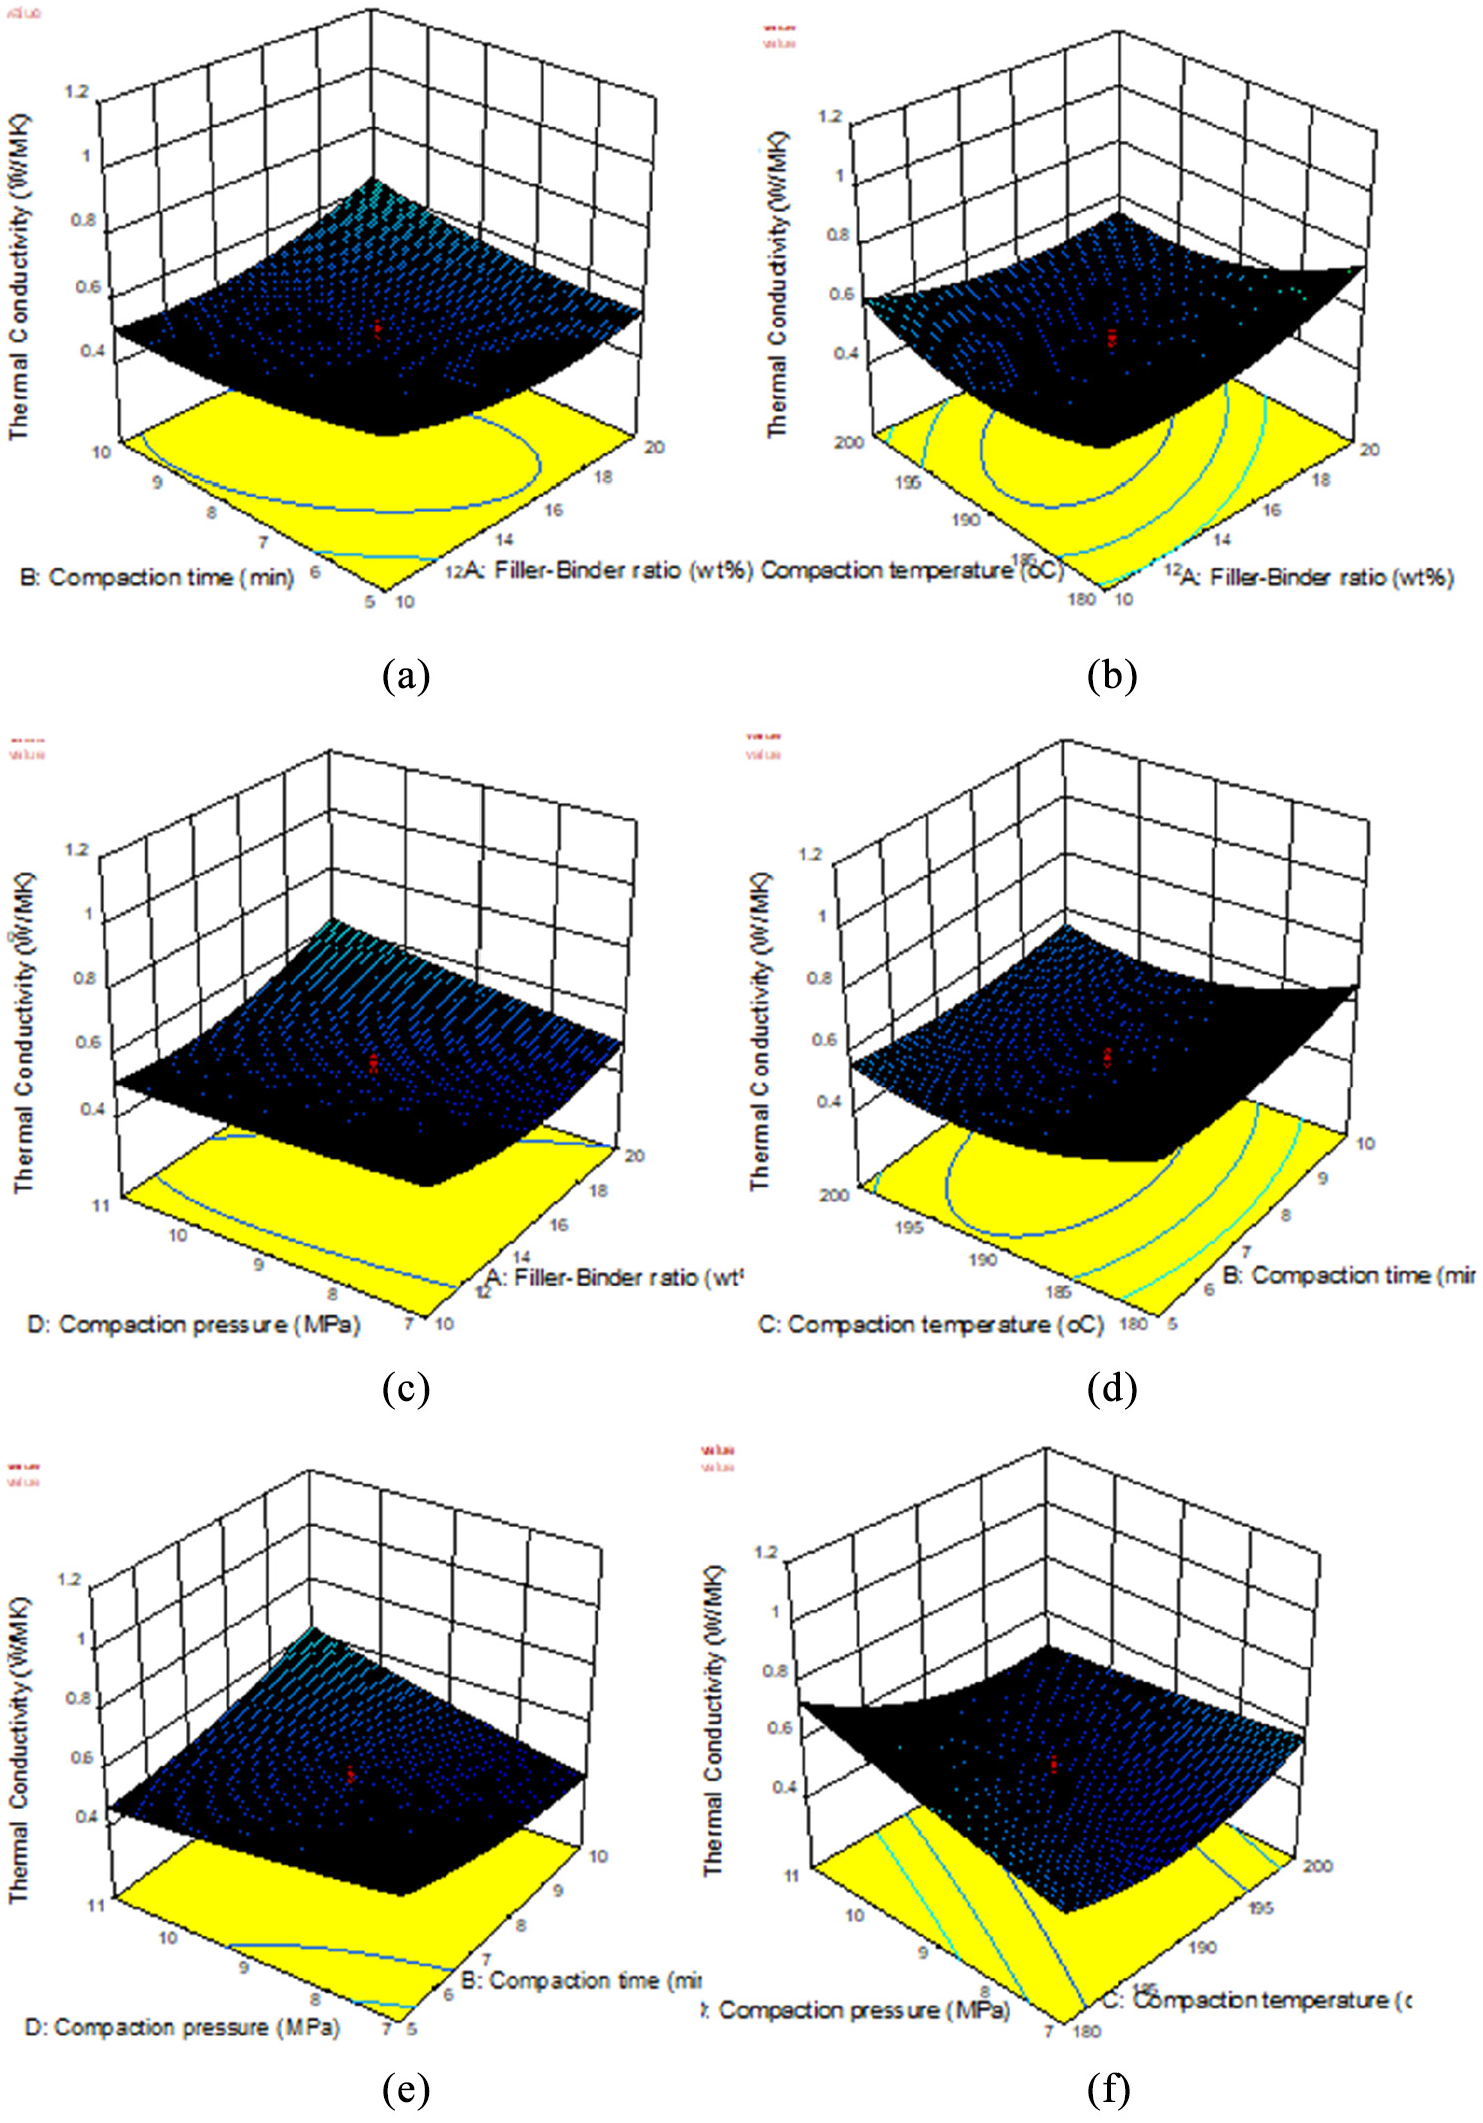
3D surface plots of the effect of parameters on thermal conductivity: (a) Compaction time versus filler-binder ratio, (b) compaction temperature versus filler-binder ratio, (c) compaction pressure versus filler-binder ratio, (d) compaction temperature versus compaction time, (e) compaction pressure versus compaction time, and (f) compaction pressure versus compaction temperature.
Experimental parameters and thickness swell
ANOVA and lack fit test for thickness swell
The ANOVA for thickness swell shown in Table 5, gave a Model F-value of 6.35 implying that the model is significant and has a 0.05% chance to occur due to noise. Significant model terms are identified with “Prob > F” values less than 0.0500, thus from the table it can be seen that D, AD, BC, BD, A2, B2, are significant model terms, hence the final equation is reduced to;

ANOVA for response surface quadratic model.

The lack of fit test for thickness swell is shown in Table 6, with a “Lack of Fit F-value” of 1.00 implying that it has a 53.66% chance to occur due to noise, thus the model developed is good.
Lack of fit tests for thickness swell.

Normal Probability plot for thickness swell
The normal plot of residuals for thickness swell shown in Figure 5 gave a closely packed points around the diagonal indicating that the chosen model is adequate to predict the percentage thickness swell.
Normal probability plot for thickness swell.
Combined effect of parameters on thickness swell
The 3D surface plots for thickness swell is shown in Figure 6. The combined effect of filler-binder ratio ratio and compaction time on thickness swell in Figure 6(a), shows that increasing filler-binder ratio ratio increased thickness swell while increasing compaction time decreased thickness swell. The effects of filler-binder ratio ratio on thickness swell were seen to repeat in Figure 6(b) and (c), while that of compaction time is also seen in Figure 6(d) and (e). From Figure 6(f) it can be seen that increasing both the compaction temperature and compaction pressure decreases the thickness swell.

3D Surface of the effect of the parameters on thickness swell: (a) Compaction time versus filler-binder ratio, (b) compaction temperature versus filler-binder ratio, (c) compaction pressure versus filler-binder ratio, (d) compaction temperature versus compaction time, (e) compaction pressure versus compaction time, and (f) compaction pressure versus compaction temperature.
Experimental parameters and water absorption
Anova and lack of fits test for water absorption
The ANOVA for water absorption shown in Table 7, gave a Model F-value of 34.29 implying that the model is significant and has a 0.01% chance to occur due to noise. Significant model terms are identified with “Prob > F” values greater than 0.01, thus from the table it can be seen that A, C, D, AB, AC, AD, BD, CD, A2, B2, D2 are significant model terms, hence the final equation is reduced to;

ANOVA for response surface quadratic model.

The lack of fit test for water absorption is shown in Table 8, with a “Lack of Fit F-value” of 0.72 implying that it has a 68.99% chance to occur due to noise, thus the model developed is good.
Lack of fit test for water absorption.

Normal probability plot for water absorption
The normal plot of residuals for water absorption shown in Figure 9 gave a closely packed points around the diagonal indicating that the chosen model is adequate to predict the percentage water absorption, see Figure 7 for Normal Probability plot for water absorption

Normal probability plot for water absorption.
Combined effect of parameters on water absorption
Figure 8 shows the 3D surface plots for water absorption which gives the combined effect of two parameters at each instance. The combined effect of compaction time and filler-binder ratio in Figure 8(a) shows that water absorption increases with increasing filler-binder ratio while the increase in compaction time decreases water absorption. Similar effect of filler-binder ratio content on water absorption is seen in Figure 8(b) and (c) while the reverse effect of compaction time on water absorption is repeated in Figure 8(d) and (e). The effects of compaction temperature and compaction pressure is seen in Figure 8(f), as increase in both parameters decreases water absorption.

3D surface plot of the effect of the parameters on water absorption: (a) Compaction time versus filler-binder ratio, (b) compaction temperature versus filler-binder ratio, (c) compaction pressure versus filler-binder ratio, (d) compaction temperature versus compaction time, (e) compaction pressure versus compaction time, and (f) compaction pressure versus compaction temperature.
Optimization of the central composite design
Table 9 shows the various solutions obtained from the optimization process. The selected solution shows parameter levels of 16.205% filler-binder ratio, 9.569 min compaction time 200°C compaction temperature and 10.956 MPa compaction pressure. These optimized parameter levels will yield a response of 0.584 W/MK thermal conductivity, 0.772% thickness swell and 0.26% water absorption.
Optimization solutions for the composite design.

Validation of result
Figure 9 shows the contrast between the optimization result obtained and that of the ceiling board based on the uncarbonized breadfruit seed coat. It demonstrates that the carbonization of the breadfruit seed coat increases the ceiling board’s thermal conductivity while reducing the rate of absorption of water and thickness swell.

Comparison with the result of uncarbonized breadfruit seed coat based ceiling board.
Discussion of Result
From the optimization result the combination of the production parameters; 16.205% filler-binder ratio, 9.569 min compaction time 200°C compaction temperature and 10.956 MPa compaction pressure, will yield a ceiling board of 0.584 W/MK thermal conductivity, 0.772% thickness swell and 0.26% water absorption. 0.584 W/MK thermal conductivity which is quite close to that of the uncarbonized breadfruit seed coat based of 0.367 W/mK reported by Ezenwa et al. 9 and better than that of 0.07 kW/MK and 0.082 kW/MK for waste paper and rice husk based. 18 The water absorption of 0.26% obtained is better than 12.3–23.35% water absorption for saw dust based 19 and that of 7.5–14.5% for waste paper and rice husk based. 20 The thickness swell of 0.772% obtained from is much better than that of 9.83% for jatropha curcas seedcake by Olorunmaiye and Ohijeagbon. 6 Thus carbonising the breadfruit fruit seed coat has shown good physical properties for ceiling board production.
Conclusion
The study investigated the effect of carbonized breadfruit seed coat as a ceiling board production filler material. Four parameters that cut through the composition of material (filler-binder ratio) and production parameters (compaction time, compaction temperature and compaction pressure), were considered. Three responses (thermal conductivity, water absorption and thickness swell), which are the physical properties of the formed ceiling board, have been studied against these parameters. For optimization of these parameters, the central composite design of the Design Expert program was used. To view the effects of these parameters on the responses, 3D surface plots were also produced. The result obtained gave parameter levels of 16.205% filler-binder ratio, 200°C compaction temperature of 9.569 min compaction time and 10.956 MPa compaction pressure to generate a response of 0.584 W/MK thermal conductivity, 0.772% thickness swell and 0.26% water absorption. Compared to current designs, these findings indicate that the carbonized breadfruit seed coat is a good filler material for the development of ceiling boards.
Footnotes
Handling Editor: James Baldwin
Declaration of conflicting interests
The author(s) declared no potential conflicts of interest with respect to the research, authorship, and/or publication of this article.
Funding
The author(s) received no financial support for the research, authorship, and/or publication of this article.