
Abstract
A distortion generator equipped with a motor-activated movable flat baffle was installed just upstream of a rectangular plenum entrance to investigate the effects of inlet total pressure distortion on the stability and performance of an auxiliary power unit (APU). Experiments and numerical simulations on a direct connect scale inlet model of the APU were carried out to obtain a quantitative relationship between the insertion depth of the flat baffle in the flow stream and the total pressure distortion intensity and region. In the experiments, the blocking coefficient and total pressure distortion coefficient were controlled by adjusting the insertion depth of the flat baffle and the mass flow. In the simulations, detailed flow field was analyzed based on the detached-eddy simulation (DES) method. The results show that the pressure distribution of the distorted flow on the aerodynamic interface plane (AIP) can be divided into a high-pressure region, a transition region, and a low-pressure region. The area affected by the distorted flow was larger than the inserting area of the flat baffle. That area was more related to the relative blocking coefficient, and less affected by the mass flow. The total pressure distortion coefficient had a linear relationship with the mass flow rate and is positively correlated with the relative blocking coefficient. As the relative blocking coefficient increased to a certain value, an exponential growth in the total pressure distortion coefficient occurred, and consequently, the flow field distortion was intensified. In the flow field, a pair of corner vortices were formed at the corner between the flat baffle and the bottom wall of the inlet pipe, and a large separation zone was formed behind the flat baffle and exhibits certain unsteady characteristics.
Introduction
Performance tests, operability tests, and durability tests are three sets of primary and necessary ground tests for gas turbine engine research and development. Inlet total pressure distortion, which is applied in operability tests as a key engine stability degrading factor, has also become a critical issue in durability tests and even performance tests. 1 The SAE S-16 committee has proposed a complete test and evaluation methodology for gas turbine engine stability and performance assessments. 2 Although auxiliary power units (APU) are small gas turbine engines, the baseline configuration of an APU with an inlet plenum contains a rectangular opening that makes the intake a square cross-sectional duct; thus, the transverse of the inlet/APU aerodynamic interface plane (AIP) differs from that of a turbojet or turbofan. As a result of this transverse disparity, the distortion descriptor elements stem largely from the AIP in a circular or annular duct according to ARP1420 guidelines; thus, AIR1419 considerations become inapplicable. 3
The stability and performance assessment of APU, however, is necessary for the development of turbojet and turbofan engines. Among all primary stability degrading factors, inlet total pressure distortion is the most essential and critical one. In order to investigate its effect on the compressor stability, the direct-connect test method is often used to investigate undesired nonuniform or distorted flows originating from complex aerodynamic interactions among the airframe, the inlet aperture, and the inlet plenum.4–8 For a ground test rig, a total pressure distortion generator should be placed in front of the engine to simulate the total pressure distortion encountered by the engine during flight. Three common types of total pressure distortion generators are available: screen, air jet, and flat baffle. 9
A distortion screen generates steady-state total pressure patterns through flow blockage, which is a function of the screen porosity and the flow approach velocity. The screen consists of laminated wire meshes with their respective shapes and porosities tailored according to the particular pattern of interest. When the screen is mounted in front of a compressor or engine, and is normal to the flow, it subjects the machine to distortion similar to that produced by an inlet. Davis produced a 180° circumferential distortion pattern per revolution. As each screen produces a single distortion pattern, a particular test program requires a family of screen assemblies to meet the stability evaluation requirements. 10
An air jet distortion generator reduces the cost and cycle time required to fabricate and install separate screens for each distortion pattern. 11 It utilizes viscous mixing to reduce the momentum of regions in an approaching flow. A forward-facing air jet exchanges its momentum with the approaching flow to affect the pressure loss. An array of such jets, mounted on struts upstream of the test device, provides a means of spatially varying the pressure drop. The main difficulty of using this device lies in knowing how to provide continuous and controllable pressure gas and precise spray according to the required total pressure distortion map.
As easy-to-operate total pressure distortion generators, flat baffles are commonly used to investigate the effects of pressure distortion on the aerodynamic stability of aircraft engines and compressors. For example, when the total pressure distortion coefficient produced by a flat baffle is equal to 9%, if the engine can still work steadily, then it’s likely that the engine can resist all possible total pressure distortions in the entire flight envelope. A flat baffle can simulate both steady and dynamic characteristics of inlet flow distortion. The flat baffle distortion generator was first used in Russia. However, there is very little public literature investigating the distortion characteristics of the flat baffle distortion generator, nor the instability and performance of the engine with a flat baffle distortion generator. In China, there have been some studies on flat baffle distortion generators, including experiments with them on engines. NUAA (Nanjing University of Aeronautics and Astronautics) has carried out a lot of research on the flat baffle. In its previous works, four kinds of baffle structure forms, namely a single flat plate, two symmetrical flat plates, a fan plate, and two flat plates with a certain angle were tested on a two-stage, low-speed, axial-flow compressor test rig. It was found that the total pressure distortion descriptor of single flat plate baffle is the largest at the same blockage coefficient. 12 Xia investigated the effects of a controlled variable double-baffle distortion generator (CVDBDG) on the stability of an engine test rig. The CVDBDG is able to simulate steady-state and time-variant total-pressure distortions in real-time. Compared with a movable single-baffle distortion generator, both the capability and adjustable range of the CVDBDG were extended significantly. 13
In the present work, a distortion generator equipped with a motor-activated movable flat baffle was installed upstream of a rectangular plenum entrance, which is the AIP of the inlet/APU. The depth of the flat baffle entering the flow stream was remotely controlled to change the total pressure distortion pattern or intensity.
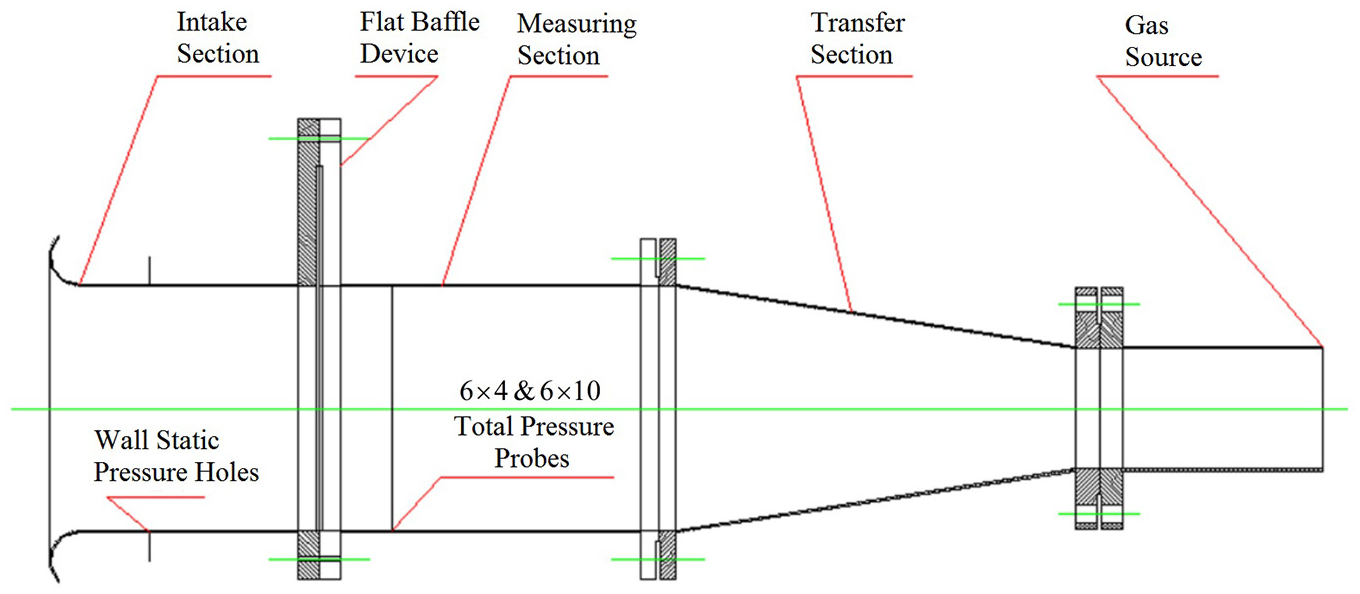
Figure 1 presents a sketch of the proposed altitude test facility used for the APU stability evaluation test. To obtain a quantitative relationship between the insertion depth of the flat baffle and the total pressure distortion intensity and region for the APU, a scaled version of the APU intake duct model with a movable flat baffle was employed.

Sketch of the proposed pressure distortion generator with a movable flat baffle.
The Reynolds-averaged Navier–Stokes (RANS) method is adopted in most simulations of the inlet/APU flow. 14 However, traditional turbulence models have some defects in predicting unsteady and vortical flows. 15 In contrast, the detached-eddy simulation (DES) method is a good choice for capturing separated or vortical flows with a bearable cost. 16 Many researchers have applied the DES method to gas turbine engine research and achieved satisfactory results.17–22
Experimental equipment
The experiments were performed on a scaled-down version of the APU intake channel model with a movable flat baffle. The relative blocking coefficient and total pressure distortion coefficient (TDC) was controlled by adjusting the insertion depth of the flat baffle and the mass flow.
The direct-connect half-scale test model of a real APU air supply duct is generally composed of an intake section, a variable inserting flat baffle, a measuring section, and a transfer section. According to the Chinese Military Standard “Guidelines for Design and Evaluation of Stability of Aviation Gas Turbine Engines,” an engine should be subjected to a pressure distortion test using a flat baffle to obtain a suitable total pressure distortion coefficient. The inflow parameter measurement section should be located at the position of two times the equivalent diameter upstream of the flat baffle, and the aerodynamic section (target section) used to obtain the total pressure distortion flow field should be located at three times the equivalent diameter downstream of the flat baffle.
The space limitation of our altitude test facility, however, makes these requirements inapplicable. To ensure consistency with actual experiments, the AIP of the subscale test model for total pressure measurement 70 mm downstream of the flat baffle was defined.
The experiment was done in a wind tunnel with a diameter of 120 mm. A centrifugal compressor was used as the power section that drew ambient air into the inlet and flowed through the flat baffle, the AIP, and the conversion duct. The whole subscale test system is presented in Figures 2 and 3.
Schematic diagram of the scaled-down test device.
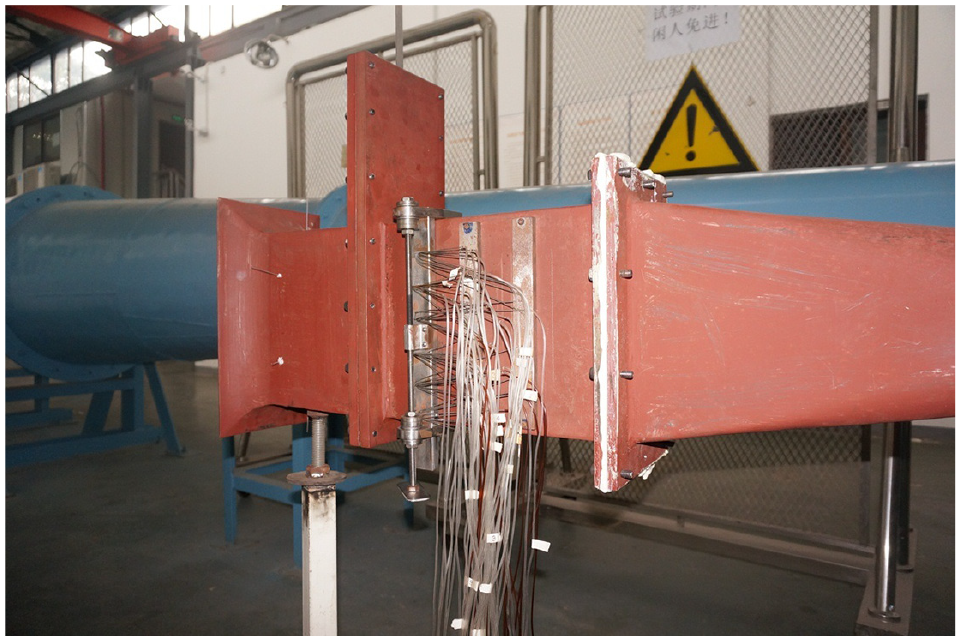
Photo of the experimental device.
Two types of total pressure probe arrays on the scaled-down test model were used: (i) six equally spaced rakes with four 0.8 mm diameter probes per rake at the centroids of equal areas (Figure 4) and (ii) six equally spaced rakes with ten 0.8 mm diameter probes per rake. Both probe arrays were installed on one strut and translated an equal spacing by a displacement mechanism. Pressures were obtained at 480 points from a 6 × 10 probe array by moving the probes.
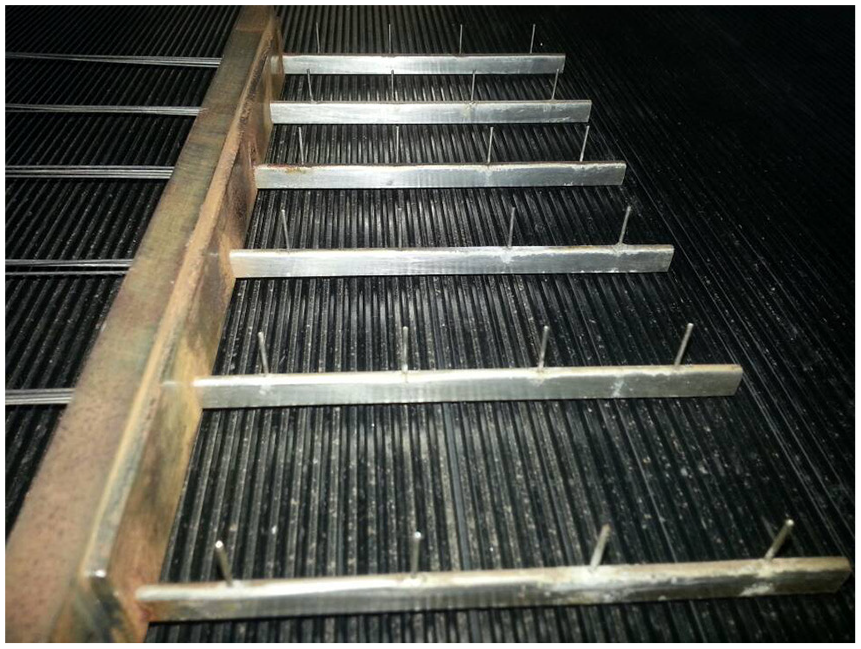
Comb-shaped total pressure probes.
A DTC Initium ESP pressure scanner (USA) was used for pressure data acquisition, and the measuring error was less than ±2%. During the test, the pressure drift was so small that the maximum difference between the beginning and end of the test was about 14 Pa, which met the requirements of a steady-state parameter test for flat-baffle total pressure distortion.
DES method
We adopted the DES97 model, first developed by Spalart, in the present study with a default DES coefficient (

where

where Δ is the local grid scale and
In general, the DES length scale (
Experimental results
The corrected mass flow is defined as follows.


where
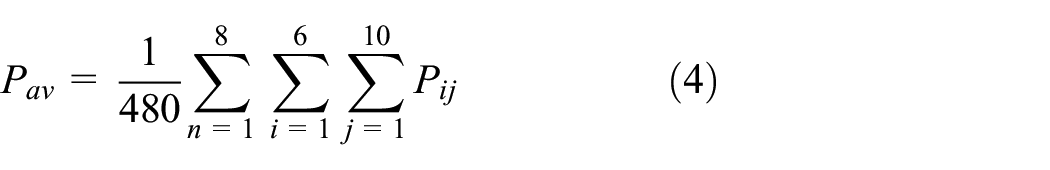
The total pressure distortion coefficient (TDC) can be defined as the ratio of the difference between the maximum and minimum total pressures and the average total pressure on the AIP.
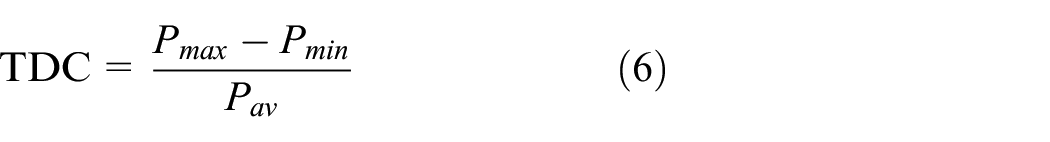


where
The subscale model experiments are performed using two types of total pressure probe arrays based on the same stepper mechanism controlling the relative depth of the flat baffle into the mainstream. The mass flow was controlled by a valve. Therefore, the relationships between TDC, the corrected mass flow, and the depth of the flat baffle entering the flow stream were obtained.
Figure 5 displays the total pressure distribution on the AIP measured by the 6 × 10 probe array. It is clear that the flow field has a high-pressure zone, a transition zone, and a low-pressure zone with varying properties and distinct boundaries between them.

Total pressure distributions: (a) S = 24.6%, (b) S = 41.0%, (c) S = 57.5%, and (d) S = 93.9%.
The relative blocking coefficient (S) in Figure 5 is defined as follows.

where
From Figure 5, it can be seen that at the same insertion depth, with an increasing mass flow rate, the average pressure at the low-pressure zone was dropped, and the area of the transition zone was increased; however, the area of the high-pressure zone remained nearly constant. At the same mass flow rate, with an increasing blocking area, the area of the transition zone increased and the minimum pressure in the low-pressure area decreased rapidly. The variation in the area of the transition zone can be explained as follows: when the flow passed the flat baffle, a local flow reflection occurred, resulting in a momentum loss. As the blockage coefficient increased, both the amount of blocked fluid and the loss were increased, leading to an increase in the transition zone area.
The total pressure distortion coefficient, the corrected mass flow, and the relative blocking coefficient are presented in each contour in Figure 5. At the same relative blocking coefficient (S), it can be calculated that the TDC has an almost linear relationship with mass flow, especially when the mass flow is low. The larger the mass flow, the greater the maximum and minimum pressure difference in the measurement section. The lower the average pressure, the higher the TDC. At the same mass flow, the TDC value was positively correlated with S and increased with the depth of the flat baffle.
Figure 6 presents the TDC versus mass flow curves with variable insertion depths of the flat baffle for two types of probe arrays. At the same mass flow rate, with an increasing relative blocking coefficient, the non-uniformity of the total pressure distribution on the AIP gradually increased, as shown by the increasing TDC. The trends of the TDC versus mass flow curves are in agreement with the analysis on Figure 5. The TDC values tested by the 6 × 10 probe array (2#) were higher than the result tested by the 6 × 4 probe array (1#), because 480 measure points provide finer results than 192 points. The 6 × 4 probe array is more likely to miss the minimum and maximum pressure values in the measured section. Therefore, it is highly probable that the difference between the minimum and maximum pressures measured by the 6 × 4 probe array is smaller than the actual.

Relationship between TDC and the corrected mass flow for two types of probe arrays.
Using data obtained from the 6 × 10 probe array, the relationship between TDC and S was obtained at the corrected mass flow rates of 0.75 kg/s, 1.00 kg/s, 1.10 kg/s, and 1.20 kg/s respectively by interpolation, and the result is shown in Figure 7. The TDC value increased with the relative blocking coefficient. When S was less than 40%, the TDC value increased linearly and slowly. When S was greater than 50%, the TDC value increased almost exponentially, and the flow field distortion was rapidly aggravated.
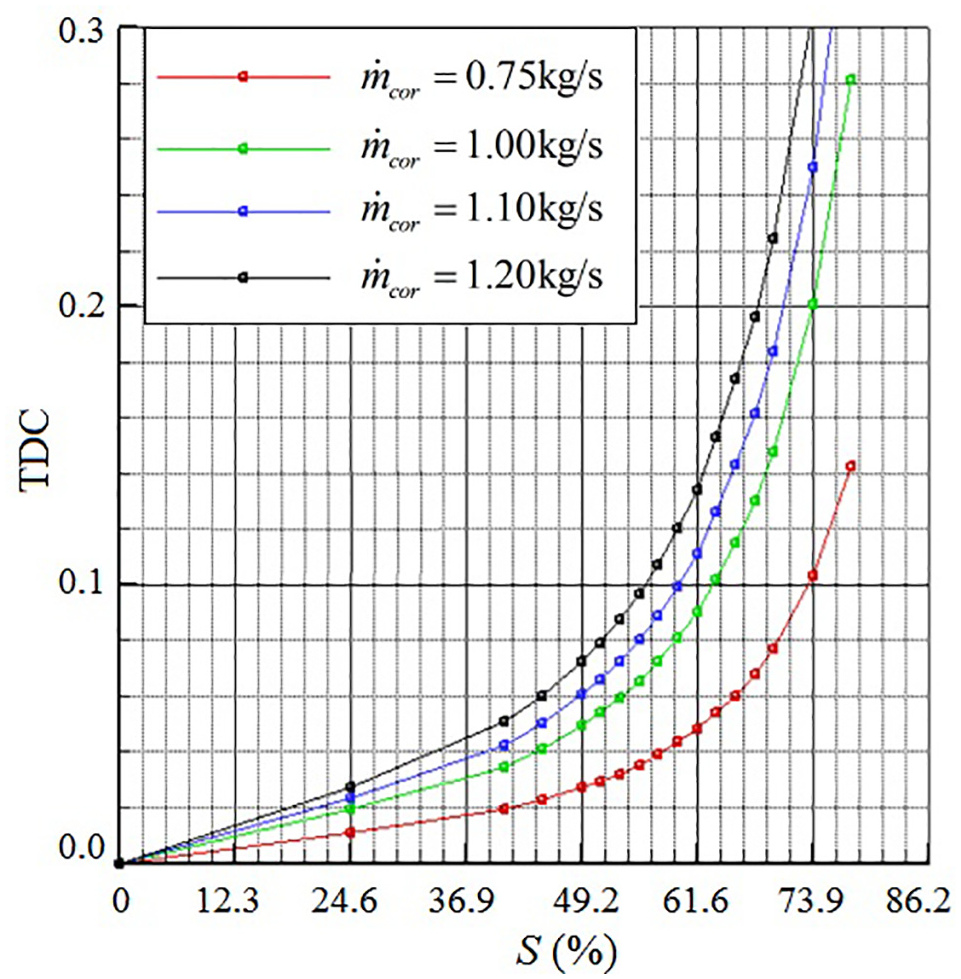
Relationship between TDC and S.
Numerical simulation results
To verify the obtained experimental results and analyze the flow field in detail, detached-eddy simulations were performed using the NUMECA software. The length of the intake pipe was doubled to increase the stability of the calculation.
The IGG model in NUMECA FINE/TURBO commercial software was employed for mesh generation. This paper utilized FINE/TURBO to compute the flow fields. Inlet absolute total pressure, inlet total temperature, inlet flow angle, and outlet static pressure was specified in boundary conditions. By adjusting the static pressure at the outlet, the mass flow was adjusted.
Grid independence study
We performed a grid independence study based on the RANS calculations with five sets of grids at the corrected mass flow of 0.9914 kg/s (Table 1). The No. 5 grid was adopted as the mesh for the DES, which was confirmed to be grid-independent, according to Figure 8. Ten nodes were set within boundary layers to ensure y+< 1.
Grids used for the grid independence study.


Result of the grid independence study.
The total pressure ratio in Figure 8 is the ratio of the total pressure on the AIP to the ambient pressure. The adopted mesh for the DES could provide a grid-independent result in the RANS region. The LES region, however, is naturally grid-dependent because the cutoff scale is related to the local grid scale.
DES results
Figure 9 presents the comparison of the total pressure contours between test and simulation results when the relative blocking coefficient is 41.0% and the corrected mass flow rates are 1.4574 kg/s and 0.9914 kg/s. The calculated flow fields are in agreement with the test results.

Comparison of experimental and simulated pressure contours.
Figure 10 presents simulated total pressure contours on different cross-sections along the airflow direction. Note that the flow field distortion area in the measurement section was larger than that in the inserting area of the flat baffle. For example, when the relative blocking coefficient was 41%, the low-pressure region occupied 55% of the flow passage and the pressure deficit area, including the transition region, reached 58.3%. The size of the flow field distortion region was directly proportional to S, and the mass flow rate affected the intensity of total pressure distortion.
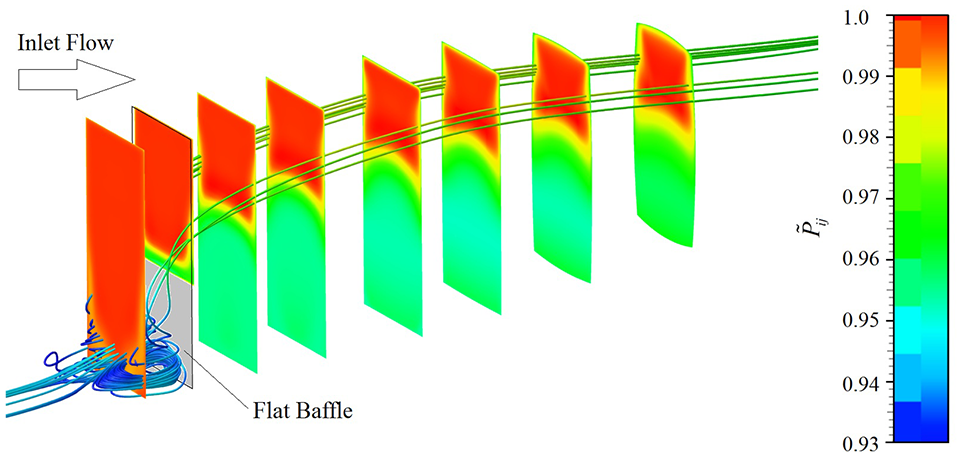
Streamlines and pressure diagrams for different sections (
From Figure 10, it can be seen that the pressure changes in the high-pressure and low-pressure zones were gentle, and that in the middle transition zone was intense. The area of the transition zone was larger near the sidewall because a pair of oppositely directed corner vortices developed toward the center as the mainstream moved downstream and widened the transition zone (Figure 11). The area of the low-pressure zone was reduced; however, the high-pressure zone was almost unaffected. Moreover, as the relative blocking coefficient increased, the vortex intensity increased, the area of the low-pressure region expanded, and the area occupying the central portion of the flow passage on the AIP became larger. Low-pressure distributions on both sides of the main area can be observed in the high-pressure zone as a result of the interaction with the nearby wall surface.

Corner vortex (
Figure 11 presents the corner vortex structure was formed by the flow bypassing the flat baffle, due to the viscous effect of the wall surface and the mixing of the mass flow and the momentum. The corner vortex started at the junction between the flat baffle and the intake pipe wall. By analyzing the flow path in front of the flat baffle, it is evident that the circumferential velocity of the airflow near the pipe wall in front of the flat baffle was larger than that near the center of the flow channel. The difference between these flow velocities led to the formation of a static pressure gradient in the corner region, exerting a driving force on the local airflow. As a result, the local small-scale circumferential flow interacted with the mainstream flow to form the corner vortex.
Figure 12 presents the streamline distribution on the flow direction section. An obvious flow separation behind the flat baffle was observed. There were two separation regions of different scales: one large and one small. The larger separation region was formed because the air could not flow directly to the back of the flat baffle as a result of streamline curvature and pressure gradient. Therefore, a low-energy, low-pressure area was formed behind the flat baffle, making the downstream fluid to flow back and form a large-scale separation region. The maximum height of larger separation region occupied 63% of the channel height, and the length of separation region was about 2.8 times the channel height. Due to the principle of vorticity conservation, a small separation zone was generated at the corner between the flat baffle and the bottom wall. The change of the mass flow rate had a little effect on both separation regions. These separation regions actually caused great difficulties in the measurement. To improve measurement accuracy, It had to adjust the probe angle to make it as consistent as possible with the airflow direction.

Streamline distribution in the flow direction section with S = 41%.
We obtained pressure contours at different times based on the unsteady DES results. In this simulation, dual time steps were used. The physical time step was 0.0005 s, and the virtual time was 100 steps in each physical time step. A total of 1000 physical time steps was calculated . The pressure contours are displayed in Figure 13. Note that the total pressure distribution on the AIP section changed with time, and the range and pressure of the low-pressure and high-pressure regions fluctuated. In addition, Figure 14 shows that the flow pattern of the large-scale separation behind the flat baffle changed with time because of the unsteady characteristics of the total pressure in the AIP section.
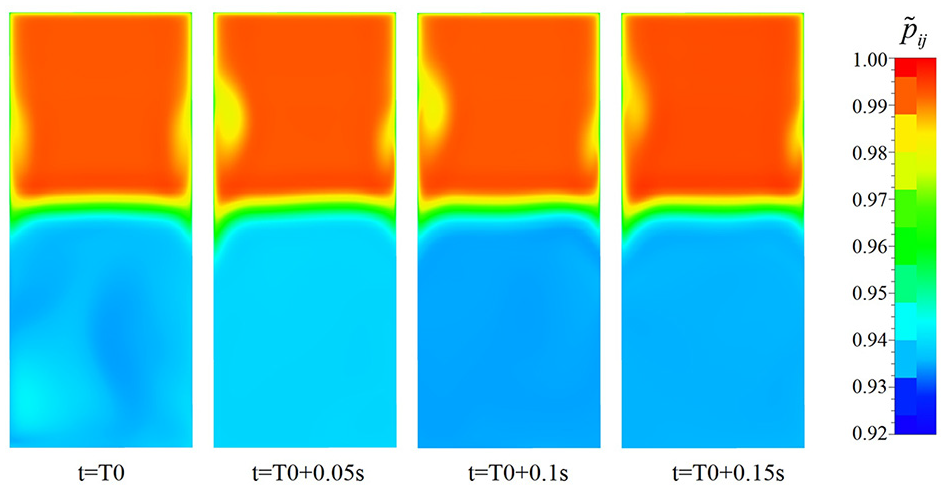
Pressure contours in AIP at different times (
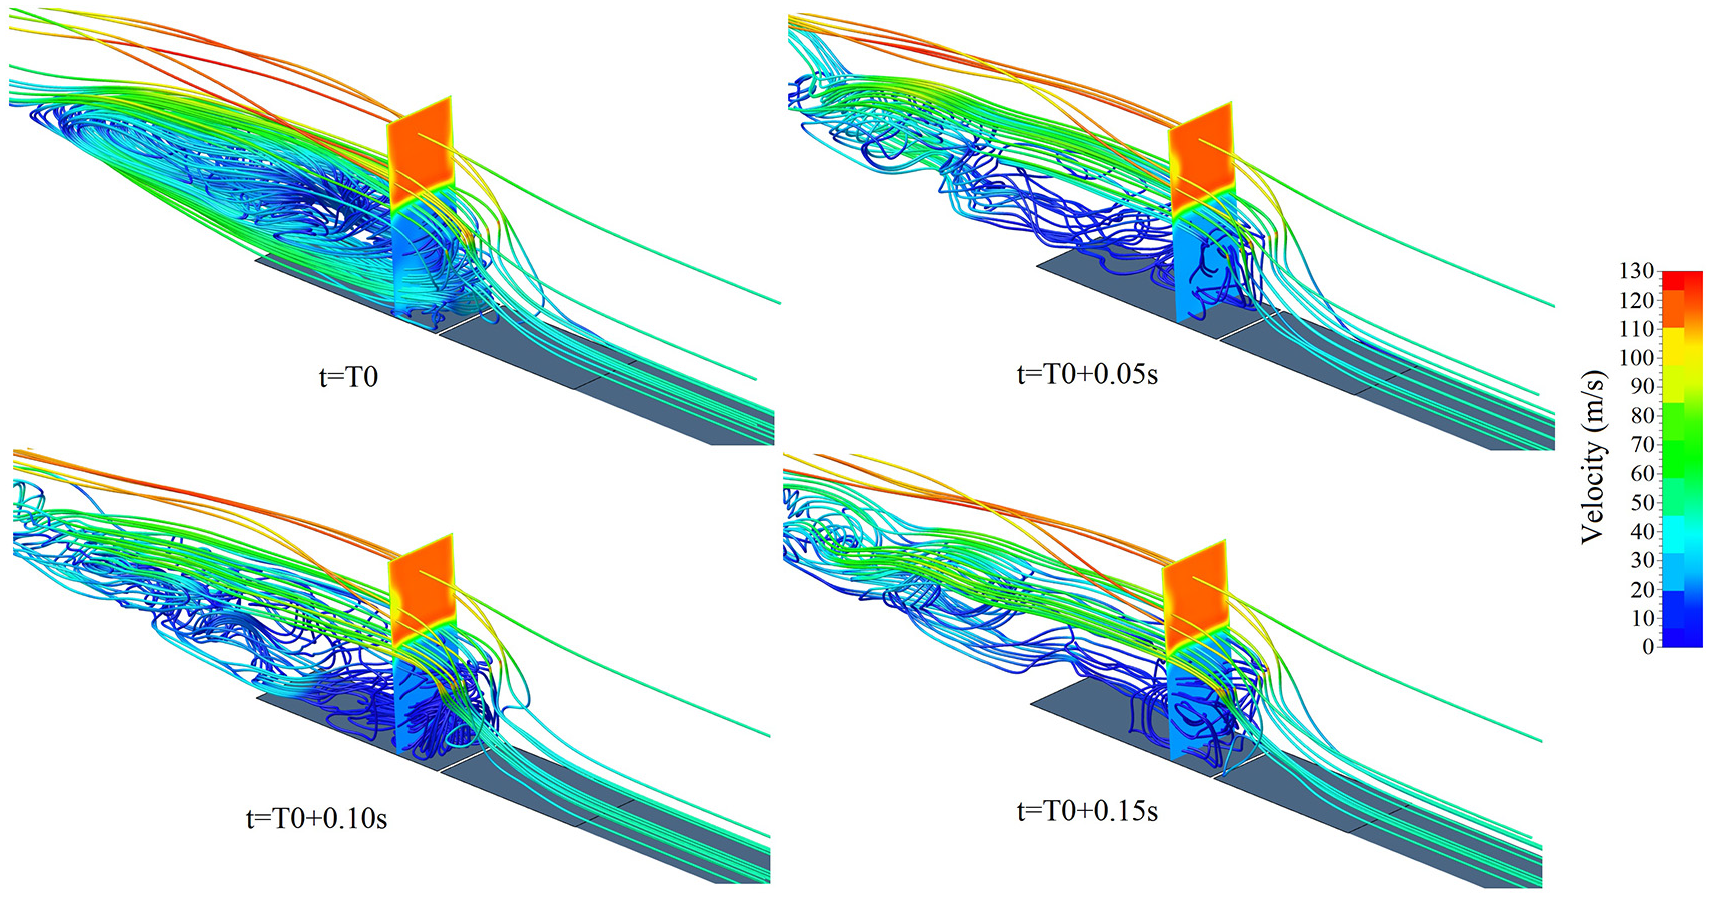
Separation flow at different times (
According to the results in Figures 13 and 14, the flow field behind the flat baffle is unsteady. The form and area of the separation flow generated changed with time. Therefore, steady-state measurement and data processing methods cannot accurately reflect the total pressure distortion caused by the flat baffle, and special experiments and numerical simulations will be carried out to explain the contribution of turbulence to the total pressure distortion.
Conclusions
In this paper, numerical simulations based on the DES method and wind tunnel experiments on a flat baffle was performed. The TDC value was changed as the insertion depth of the flat baffle and the corrected mass flow was varied. The TDC increased with an increasing relative blocking coefficient at the same corrected mass flow. When S was less than 40%, the TDC increased linearly and slowly. When S was greater than 50%, the TDC increased almost exponentially. At the same mass flow, the TDC was positively correlated with the relative blocking coefficient.
The total pressure distribution of the steady-state distorted flow on the AIP could be divided into a high-pressure zone, a transition zone, and a low-pressure zone with varied properties and distinct boundaries between them. The area affected by the distorted flow was larger than the area blocked by the flat baffle. That area was more related to the relative blocking coefficient, and less affected by the mass flow.
When the air flowed downstream through the flat baffle, a pair of symmetrical vortices (equal in size and opposite in direction) appeared in the corner area between the front of the flat baffle and the bottom wall of the intake pipe. The corner vortex was close to the wall on both sides and made the range of the transition area larger, and the boundary between the high-pressure and low-pressure regions gradually became blurred. Two separation vortices were also formed behind the flat baffle; however, their scales were quite different. One existed in the corner area between the rear side of the flat baffle and the bottom sidewall, and its size was very small, about one-third of the height of the flat baffle, and the other one was very large, with its diameter accounted for 63% of the channel height, and the length in the flow direction being 2.8 times the channel height.
Footnotes
Appendix
Handling Editor: James Baldwin
Author contributions
Conceptualization: C.L. and L.L.; methodology: C.L. and B.T.; formal analysis: B.X.; investigation: C.L., B.T., B.X., and X.Z.; writing – original draft preparation: B.T.; writing – review and editing, X.Z.; funding acquisition, C.L.; All authors have read and agreed to the published version of the manuscript.
Declaration of conflicting interests
The author(s) declared no potential conflicts of interest with respect to the research, authorship, and/or publication of this article.
Funding
The author(s) disclosed receipt of the following financial support for the research, authorship, and/or publication of this article: The research presented here was funded by the National Science and Technology Major Project of China (Grant number: 2017-II-0004-0017).