
Abstract
Based on the analysis of load spectrum data, the loading sequence and the interaction between loads are considered, a fatigue life prediction model based on load spectrum is proposed. The load spectrum is preprocessed and the probability density function of mean and amplitude are fitted. The running condition of the train is analyzed, the one-dimensional program load spectrum of wheel and axle load is constructed by extrapolating the load spectrum. According to the modified fatigue cumulative damage method, the fatigue life of the axle is predicted with the one-dimensional program load spectrum. The relevant factors that affect the strength of the part are fully considers in the model. It more accurately reflects the objective facts of the component fatigue process. The result has more engineering reference significance and it provides a theoretical basis for the design and manufacture of train axles and ensuring safe operation.
Introduction
Railway transportation is an indispensable part of the national economic construction. It is the artery of the national economy and plays an important supporting role in the national economic construction. Railway represents a large volume, fast and efficient mode of transportation. It plays a crucial role in the regional economic development, personnel exchanges as well as national defense building. 1 Construction of railway after a long time, started from the traditional train toward faster high-speed EMU. After more than 50 years of development, high-speed railway has grown from the introduction of technology to the independent design and production of EMU, and gradually became a high-speed railway power. 2 With the rapid popularization, operational safety has become the focus of increasing attention. As the high-speed train is in operation, the speed can reach hundreds of kilometers per hour. When the mass of a single carriage is tens of tons, the axle bears a huge load. These repetitive loading conditions will cause fatigue damage to the axle over an extended period. The damage accumulates to a certain extent, thus endangering the safety of train running. 3
Fatigue failure is one of the main causes of failure in engineering and mechanical systems. 4 Under cyclic loading, if the component reaches or exceeds the material fatigue limit this will results in fatigue failure. 5 The number of cycles of a material or part in the event of damage is the life of the material or part. 6 The German Wöhler 7 first studied the fatigue test. According to the test, the concept of curve is put forward, which lays a foundation for the theory of fatigue strength. The International Organization for Standardization defines fatigue life in “General principles of Metal fatigue Test”: the property change of metal material under the repeated action of stress or strain is fatigue. Scholars continued to improve the fatigue theory, and gradually formed a fatigue damage theory research system.8,9
Now, scholars are constantly replenishing and perfecting the theory of fatigue life research. 10 Composite materials and institutions under constant amplitude loading fatigue behavior are studied with S-N empirical formula, Sarfaraz et al. 11 proposed a fatigue model based on the common index and power. Rocha et al. 12 believe that the accumulation of fatigue damage and the failure of parts are random processes. The random process is affected by the sensitivity of short crack propagation for the microstructure characteristics. Norman et al. 13 studied the effect of high-cycle fatigue strain load on the mechanical fatigue test of layered and compacted ductile iron. Dehmani et al. 14 proposed a method to analyze high-cycle fatigue crack initiation. Ishii 15 studied the wheel sets of Japanese Shinkansen high-speed trains, improved the method of manufacturing wheel axles and the durability of the axle. Pokorny et al. 16 studied the influence of the discretization level of the continuous load spectrum, the enlargement or reduction of the load spectrum affects the calculated residual fatigue life of the railway axle. Based on the Goodman formula and the Miner damage rule, Tadeusz et al. 17 analyzed the influence of the load average value and proposed a two-dimensional fatigue life calculation method under random load. Zhao et al. 18 combined the inhomogeneous Poisson process theory with small loads and uncertainties, accompanying damage to calculate the amount of fatigue damage. Xu and Mi 19 based on the flexible wheel of the EMU axle fatigue life were studied. Cao et al. 20 considered the operational defects and discussed the effect of high-speed EMU high-frequency quenching on the fatigue performance of train axles. Yonezu et al. 21 proposed a fatigue crack propagation life model for damaged axles based on low-cycle fatigue characteristics of materials. It is proved a model to predict the remaining life of railway axles subjected under typical rotating bending loads. Based on the fatigue test methods of train axles in different countries, Jiao and Huang 22 proposed a fatigue test method for variable-gage axles.
In order to analyze the fatigue life of axles, it is necessary to study the prediction method of fatigue life. Many researchers only consider the effect of loading sequence on fatigue life. The effect of interaction between loads on fatigue life is not discussed. The interaction between loads is considered in the Cortrn-Dolan model, but the parameters in the model need to be obtained by a large number of experiments. In this paper, the fatigue cumulative damage method is modified based on Manson-Halford method and Cortrn-Dolan model. The influence of the interaction force between loads and the loading order are considered. Romanovschi outlier elimination, nonlinear wavelet denoizing and low amplitude load filtering are used to preprocess the load spectrum signal. The probability density function and distribution form of mean amplitude are fitted. The load spectrum data are reasonably extrapolated by mileage, quantile extrapolation and parameter extrapolation. According to the amplitude probability distribution function, a one-dimensional program load spectrum is constructed, and the prediction result based on the modified cumulative damage method is closer to the actual life. This model can be extended to the application of fatigue life prediction of other parts.
Statement of problems
High-speed rail has the important driving force of economic development, ensuring safety and reliability is necessary for national economic security. As an important load-bearing component, the reliability of the axle is directly related to the safety of train operation. Analyzing the fatigue life and reliability of train axles has become an important part of train design. Fatigue failure is the main form of axle failure, and axle fatigue strength is an important assessment index in the development of axles.
23
A large number of engineering practices have proven that the main failure form of mechanical parts under cyclic loading is fatigue damage.
24
In engineering, it is generally considered that structures with load cycles above
In the research on the prediction of the fatigue life of the axle, the fatigue reliability of the axle is generally analyzed by compiling the load spectrum. 27 Researchers at home and abroad are based on fatigue damage theory, various methods and models for fatigue life prediction are proposed. 28 Cumulative damage model based on fatigue test to research and analysis of fatigue failure process, revealing the law of cumulative damage. 29 There are many theories and methods to calculate the fatigue life of components under random loads, such as linear fatigue accumulation theory, bilinear fatigue accumulation theory and nonlinear fatigue accumulation theory. 30 The most commonly used is the linear cumulative damage criterion (Palmgren-Miner Rule, PMR) to calculate the degradation fatigue life of components.31,32 Palmegren-Miner linear damage accumulation law is presented as an ideal model, where the influence of factors such as interaction between loads and load sequence are not considered. 33 There is a big deviation between the calculated results of Miner law and the actual test results. 34
The effect of loading sequence on fatigue life is analyzed in the Manson-Halford model 35 but ignores the interaction between loads. Load interaction is discussed in the Corten and Dolan 36 model, but the parameters in the model need to be obtained through a lot of experiments. Analyzing both the loading sequence and interaction, become a problem needed to solve in fatigue cumulative damage. 37
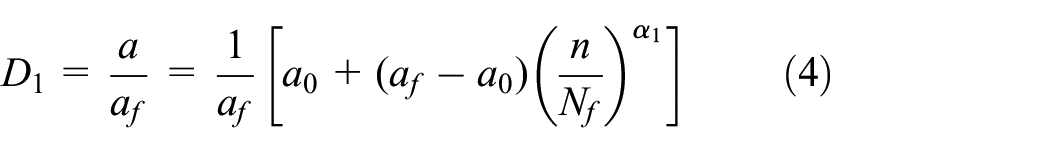
Manson-Halford model is modified based on Cortrn-Dolan model, and the fatigue life prediction formula based on loading sequence and interaction force between loads is derived. The load spectrum data collected on the actual road are preprocessed, and the mean amplitude histogram is drawn by the rain flow counting method. The load spectrum data are extrapolated by mileage or quantile extrapolation method and parameter extrapolation method. According to the characteristics of the load spectrum, the probability distribution function is analyzed and fitted, and the one-dimensional program load spectrum is constructed. The one-dimensional program load spectrum is used to predict the fatigue life of train wheels and axles based on the modified fatigue cumulative damage method.
Nonlinear damage correction model
According to the Manson-Halford method, 38 the expression of crack propagation is obtained, as shown in equation (1).
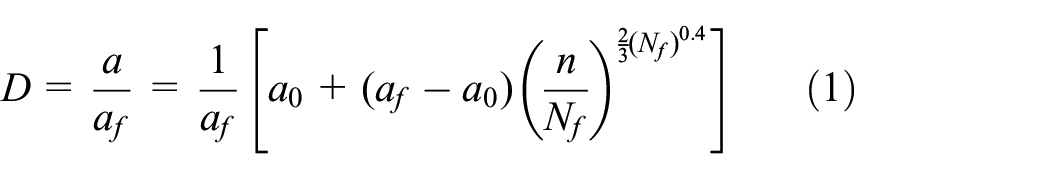
where

According to Walker 39 crack growth model, the crack growth rate is related to stress ratio, the transformation expression of stress ratio in Cortrn-Dolan model is shown in equation (3). 40
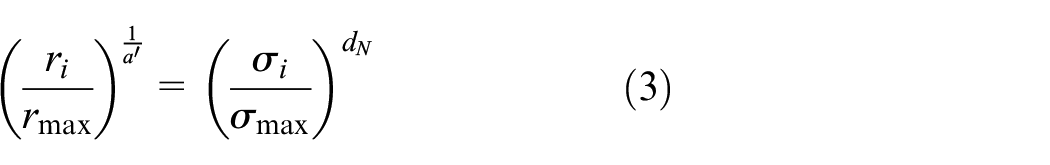
where
The ratio of damage coefficient and stress are related to the ratio of maximum stress. The interaction between loads is represented by the stress ratio.
According to equation (1), the damage at the level of first-order stress is expressed as follow:
Under the stress level of the first order load
where
Let


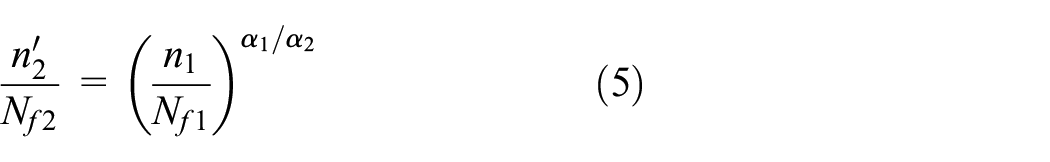
So the damage amount under the secondary load is

By analogy, the cumulative damage under multi-level loads is concluded as follow.
Load spectrum
Data processing
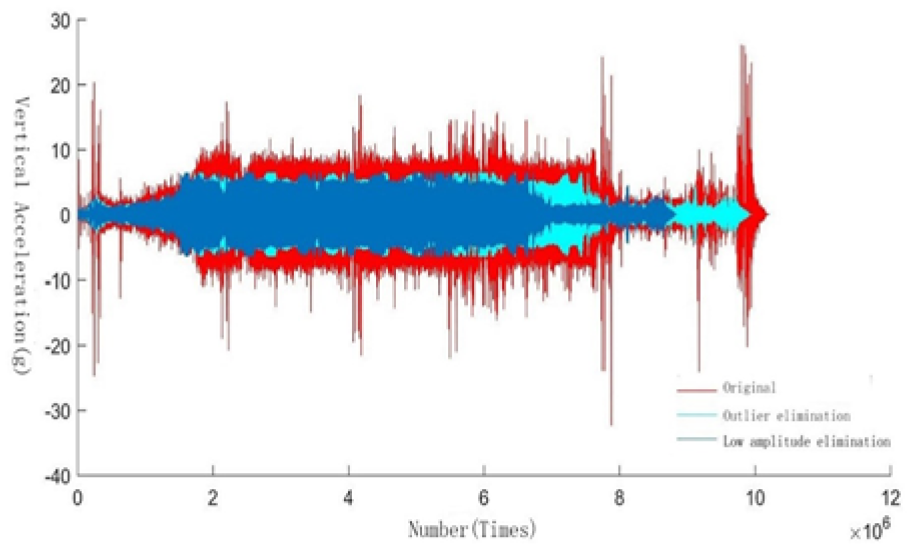
The load spectrum data is collected at the train journal position at the vertical position. According to the data, the vertical load is calculated. The collected signal spectrum is shown in Figure 1.

Vertical acceleration signal spectrum.
In the load spectrum signal collected on the actual road, due to the performance of the equipment and environmental influences, some impurity signals are mixed in the collected data signal and some abnormal signals are generated. The existence of these signals will affect the compilation of loads and the results. 39 In order to ensure the authenticity and reliability of the data, these abnormal signals need to be eliminated. 40 Romanovsky criterion (t-test), Dixon criterion, Grubbs criterion, Pauta criterion and Chauvenet criterion are used in handling abnormal signals include. 41
Some signals with small load cycles are collected, which will not affect the fatigue life of the axle, the value is far less than the elastic limit of the material. 42 When the train is running, because the track is relatively flat, the load value on the axle is not too large. In order to facilitate analysis, this load signal needs to be removed. 43
According to the actual collected train axle load combined with the actual load situation of the train. Selecting a higher threshold will eliminate the useful load, so choose a load range of 5% as the rejection threshold.44,45 After the above processing, the load spectrum is shown in Figure 2.
Data diagram after signal processing.
Characteristic analysis
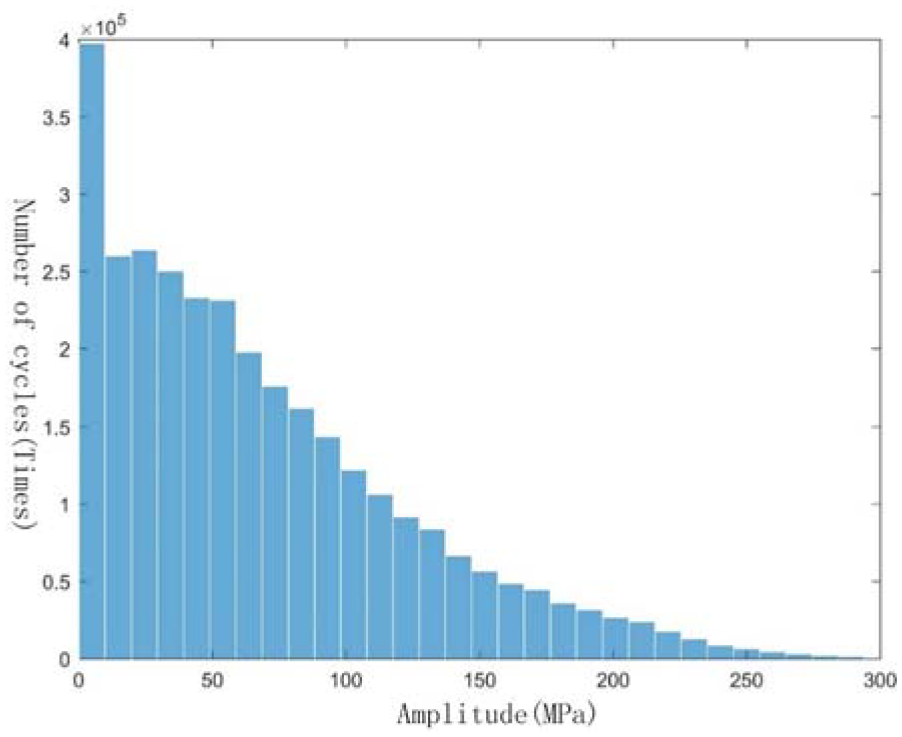
The preprocessed data are counted by the Rain-flow counting method in MATLAB software and the 3D histogram of the load average is drew, as shown in Figure 3.

Rain-flow count 3D histogram.
The load cycle is counted by rain flow counting method, and the amplitude and the mean statistical histogram are obtained.
As shown in Figure 4, the distribution characteristics of the amplitude present a unimodal distribution, and its distribution may conform to the Weibull distribution, lognormal distribution, and gamma distribution.
Amplitude histogram.
As shown in Figure 5, the mean distribution shows a unimodal symmetrical distribution. The mean distribution and amplitude distribution are fitted, the results are shown in Figures 6 and 7.

Mean histogram.
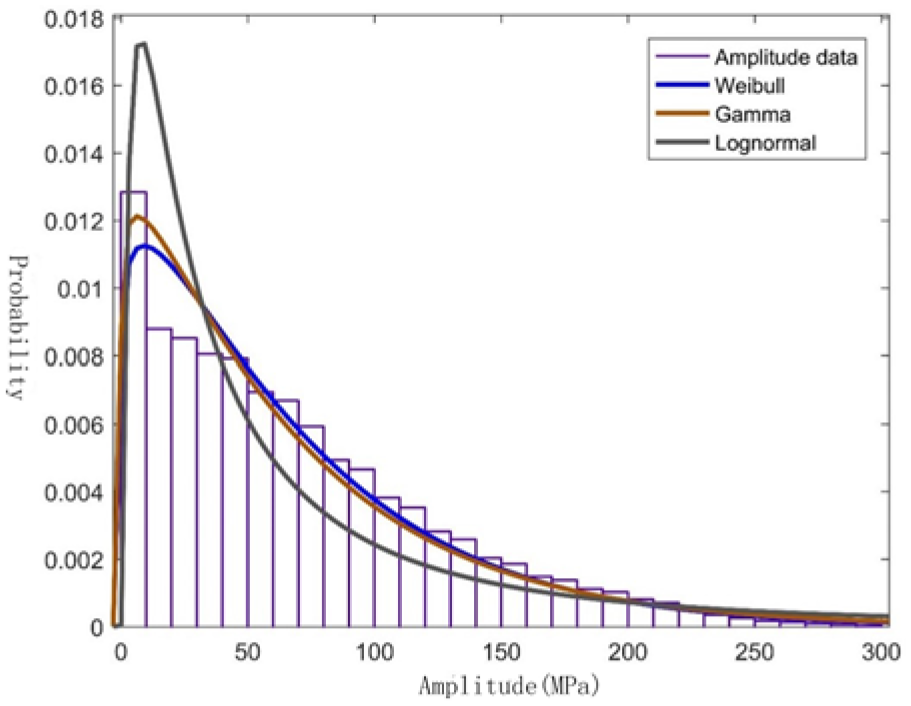
Amplitude fitting.

Mean fitting.
In order to determine the best fitting effect, the log-likelihood estimation method is used to test the fitting effect. 46 The log-likelihood estimates are shown in Table 1. In statistics, the larger the value of the log-likelihood estimate, the better the fitting effect, so the Wei-bull distribution fitting has the best effect. The Wei-bull distribution is used to fit the amplitude distribution, and the probability density function is shown in equation (11).

where
Amplitude log likelihood estimation test.

The fitted probability density function expression is obtained as shown in formula (12).

In order to determine the best fitting effect, the log-likelihood estimation method is used to test the fitting effect.47,48 Now suppose the real value of the model parameters are unknown, and want to estimate it by the data. The maximum likelihood estimation of parameters is defined as: the joint probability density of observations drawn at random in the sample, the set of parameter values whose likelihood function takes the maximum value. Therefore, without knowing which distribution the data conforms to, the log-likelihood estimation is used to test the goodness of fit of the distribution to obtain the fitting standard, which is simple, convenient, and accurate.
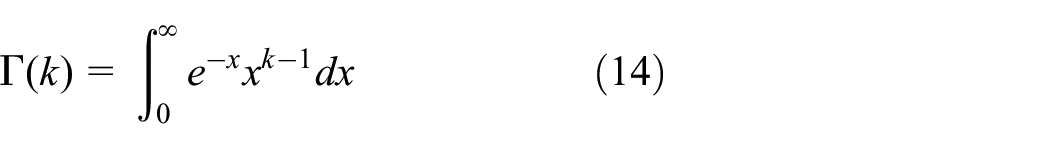
In Table 2, the logarithmic likelihood estimation of t Location-scale distribution is the largest. Therefore, the fitting effect of

where
Amplitude log likelihood estimation test.

According to the statistical data of Rain-flow counting method, the
Construction of program load spectrum
In practice, due to factors such as collection time, cost, and manpower. The measured load spectrum is that in the one-way train travel section, and the load situation of the entire service life is not obtained. 49 To predict the fatigue load spectrum of the whole life cycle, load expansion is generally carried out by extrapolation. 50
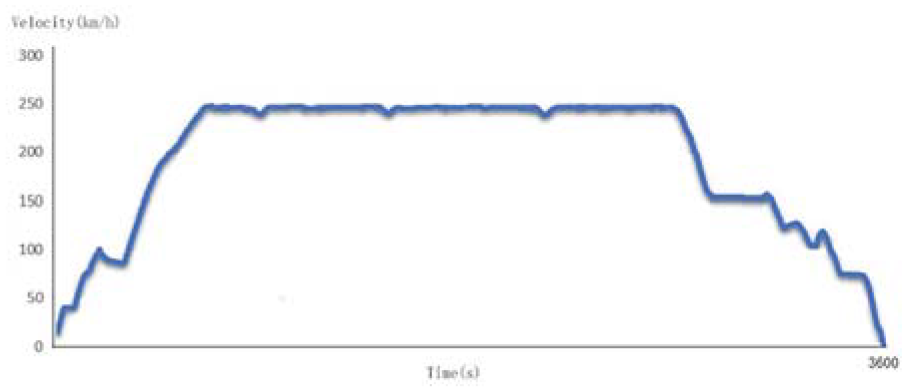
Compared with the load spectrum of the car, the train is adjusted in the whole driving process, and the load value fluctuates relatively smoothly and is shown in Figure 8. The load trend is not show a peak load during the entire travel interval, and change regularly in a periodic form. The combination of parameter extrapolation and mileage or quantiles extrapolation is used to extrapolate the load data. To obtain real train wheel and axle load spectrum data, the cumulative frequency of train load spectrum data statistics needs to be extended to

where
Train running speed.
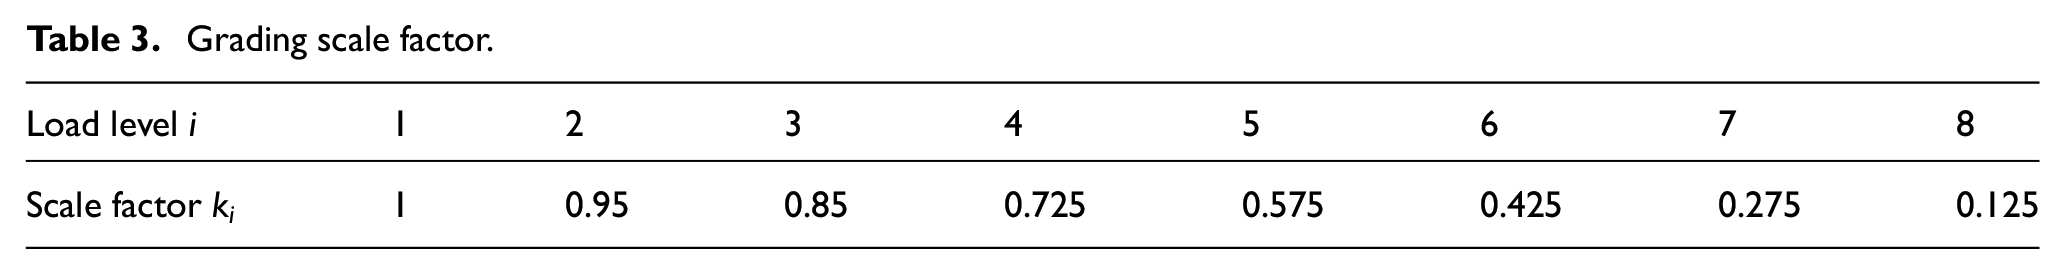
After extrapolating the load spectrum, the non-equal interval method is used to divide the stress amplitude of the dangerous section of the wheel axle. According to the amplitude proportional coefficient, the stress amplitudes are divided wiith the non-equal interval method. The divided interval coefficient (
Grading scale factor.
The one-dimensional load spectrum division method is shown in equation (17).

where
The frequency corresponding to the stress amplitude interval is calculated on the divided stress amplitude interval. The statistical method is shown in equation (18).

where
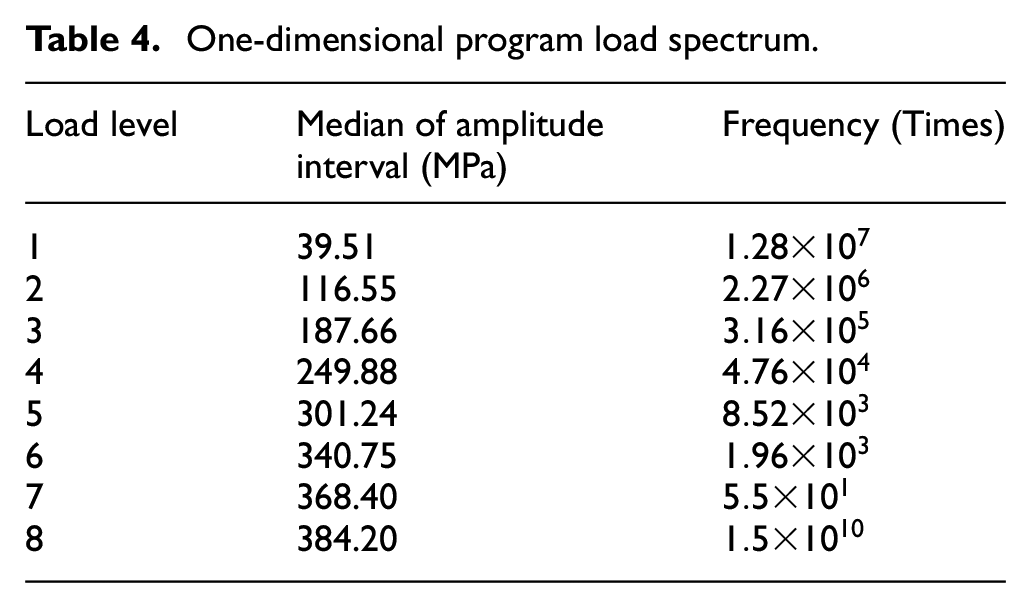
According to equations (17) and (18), the one-dimensional program load spectrum of the train wheel axle is shown in Table 4.
One-dimensional program load spectrum.
Fatigue life prediction of wheel axle
The fatigue properties of materials are generally expressed in the form of uniaxial stress-cycle times. Stress also varies regularly with time, such as sine wave, square wave, or pulse. It can be used to describe the acoustic fatigue properties of metal plates. The S-N method mainly requires parts to have infinite life or long life, so it is used in parts with very low stress amplitude or variation, and the fracture cycle of parts is extremely high, generally more than
In 1910, Basquin 51 proposed an empirical law to describe the metal S muri N curve and pointed out: The double logarithm graph of stress versus fatigue cycle number shows a linear relationship in a large stress range. For the problem of high cycle fatigue, in the performance analysis of structural fatigue characteristics 52 , The Basquin equation could accurately fit the data points in the medium life area and the relationship between loading load and cycle order is quantified. The equation is usually used to describe the relationship between constant amplitude cyclic stress and median fatigue life.
The Basquin equation is used to determine the material S-N curve.53,54

where
The axle material of this paper is 40CrNiMoA. Where
According to equation (19), the S-N curve of axle steel is shown in Figure 9.

S-N curve of material is shown in Figure 9, due to the fatigue strength of the material or fatigue limit is the theoretical threshold below which no fatigue damage is considered, when the load is 340 MPa, Number of cycles has been close to zero. 220 MPa would lead to an infinite life of the train axle. According to the one-dimensional program load spectrum of the train wheel axle, the cumulative fatigue damage amount of the train wheel axle is calculated by equation (7) as

It is assumed that the damage of the train in the service interval is equal each time. When the critical damage is reached, 823 cycles of the above program spectrum are required. Assuming that the train serves 300 days a year, it is calculated that the axles can operate safely for about 23.45 years, and the safe driving mileage is about 28.14 million km.
Conclusion
This paper is mainly based on the load spectrum data of the train wheel axle, and the modified fatigue cumulative damage method is used to predict the fatigue life of the train wheel axle. The research conclusions are as follows:
The model based on the Manson-Halford and the Corten-Dolan model takes full account of the various influencing factors in load loading, and does not need to fit parameters through experiments. The results are reasonable and easy to apply, and can provide support for the fatigue life estimation of parts under multi-level loads.
The load spectrum signal is processed by Romanovsky outlier elimination method and nonlinear wavelet de-noizing. 5% of the load variation range is used as the rejection criterion threshold to filter out the low-amplitude load that has little influence on the train axle. The pre-processed load spectrum can better reflect the actual load situation.
The influence of the interaction force between loads and the loading order are analyzed in the modified fatigue cumulative damage method. Based on the modified method, the fatigue life of train wheels and axles is predicted through one-dimensional sequence spectrum. The train axle can run safely for 23.45 years, and the safe driving mileage is about 28.14 million km. From the prediction results, the prediction result of the modified fatigue cumulative damage method is more reasonable than that of the traditional method.
Supplemental Material
sj-pdf-1-ade-10.1177_1687814021992153 – Supplemental material for Fatigue life prediction of train wheel shaft based on load spectrum characteristics
Supplemental material, sj-pdf-1-ade-10.1177_1687814021992153 for Fatigue life prediction of train wheel shaft based on load spectrum characteristics by Jiao Luo, Shuci Wang, Xintian Liu and Shuanglong Geng in Advances in Mechanical Engineering
Footnotes
Handling Editor: James Baldwin
Declaration of conflicting interests
The author(s) declared no potential conflicts of interest with respect to the research, authorship, and/or publication of this article.
Funding
The author(s) received no financial support for the research, authorship, and/or publication of this article.
References
Supplementary Material
Please find the following supplemental material available below.
For Open Access articles published under a Creative Commons License, all supplemental material carries the same license as the article it is associated with.
For non-Open Access articles published, all supplemental material carries a non-exclusive license, and permission requests for re-use of supplemental material or any part of supplemental material shall be sent directly to the copyright owner as specified in the copyright notice associated with the article.