
Abstract
In developed countries, stenosis is the main cause of death. To investigate hemodynamics within different degrees of stenoses, a stenosis model incorporating fluid–structure interaction and microcirculation function is used in this paper. Microcirculation is treated as a seepage outlet boundary condition. Compliant arterial wall is considered. Numerical simulation based on fluid–structure interaction is performed using finite element method. Our results indicate that (i) the increasing degree of stenosis makes the pressure drop increase, and (ii) the wall shear stress and the velocity in the artery zone may be more sensitive than the pressure with the increase of percentage stenosis, and (iii) there are higher wall shear stress and flow velocity in the post-stenosis region of severer stenosis. This work contributes to understand hemodynamics for different degrees of stenoses and it provides detailed information for stenosis and microcirculation function.
Introduction
Arterial stenosis is a localized narrowing of the arterial lumen. It limits blood supply to tissues and significantly affects the development and formation of cardiovascular diseases. In developed countries, it is the main cause of death, which is greatly concerned. Hemodynamics plays a key role in stroke and heart attack. Due to the high complexity, the exact mechanism of these events is not well understood. Considerable efforts for flow in stenotic arteries have been made in the past decades.1–7 Under these efforts, it has been known that arterial stenosis provokes major disruption of the normal flow patterns and flow disturbances contribute to plaque development. It is vital to understand the changes of the flow with the development of stenosis. Different locations of initial stenosis source have been found to greatly affect the orientation of the further stenosis development. 8 Severity of primary stenoses has an impact on the progression of secondary stenoses. 9 Primary plaque length progression is more probable than secondary plaque formation distal to the stenosis when the stenosis degree increases. 10 Possible complications of arterial stenosis are hypertension. 11 Though there are reports about blood flow changes with progression of stenosis severity,12,13 they neglect microcirculation function. It has been indicated that microcirculation dysfunction could induce cardiovascular diseases.14,15 Total coronary resistance is controlled and myocardial blood flow is regulated by the coronary microcirculation. 16 Microcirculation is an important part of circulatory system and it plays an irreplaceable role in ensuring cardiovascular health. Hence, it is thought that microcirculation function may affect the occurrence and development of stenosis. Flow analysis in circulatory system should be done for more accurate models consisting of microcirculation. Although microcirculation cannot be imaged clinically due to the limitation of technology and equipment, its importance is firmly established. Numerical model could overcome the limitation to reflect the importance of microcirculation.
A representative model including microcirculation will increase the accuracy and validity of hemodynamic modelling and provide the constructive guidance for therapeutic solutions for cardiovascular pathologies. The purpose of this work is to investigate hemodynamics within different degrees of stenoses using a fluid–structure interaction stenosis model which contains microcirculation function. The construction of this computational model not only affords the comprehensive understanding of stenosis, but also provides a means to prevent disease progression. This model is specifically devised to include many features of medical interest in the simulation process with progressively more accuracy.
Model and methods
Figure 1 depicts a stenotic tube. We set its diameter D = 20 mm and thickness t = 2 mm. To consider microcirculation function, the length of the outlet is prescribed as the microcirculation domain. We define the stenosis severity by diameter as follows. 17

Where R is the uniform tube radius, in this paper, we specify S = 30% and 50% for numerical comparisons.

The geometrical model.
Due to the interaction of the non-Newtonian blood flow and wall in the artery zone, the fluid governing equations are as follows using the Carreau-Yasuda shear thinning model. 18


Where
The wall governing equations are as follows using the linear-elastic model. 20


Where
The wall in the microcirculation zone is assumed to be rigid due to the tiny microvascular deformation. We simulate microcirculation function using a porous model. The permeability in this model is defined as. 22
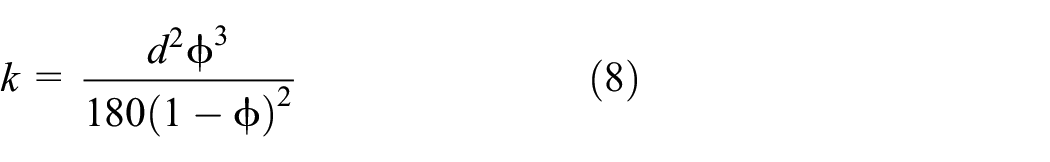
Where d is the microvascular diameter and it is set to 8 µm,
To reflect the microcirculation role, we treat microcirculation as an outlet boundary condition while the inlet velocity is assigned in Figure 2. The tube ends are fixed in all degrees of freedom and the zero initial conditions are assumed.23,24

The inlet velocity.
A natural traction equilibrium and no-slip boundary condition and continuity of displacement are set on the blood-wall interface. It is essential to calculate the importance of the two-way interaction between blood flow and arterial wall. In the two-way fluid–structure interaction simulation, the obtained pressure by first solving the fluid mode is transferred to the wall model as the external load, and then structural stress is calculated accordingly. In the process, both fluid and wall domains deform, thus re-meshing problem is solved. These results affect the fluid again. The finite element method is employed for solving the transient equations in the fluid domain. The fluid flow equations are solved until the convergence (10−4) is obtained. The arbitrary Lagrangian-Eulerian algorithm is used. This numerical simulation is performed by coupling transient structural (ANSYS) and fluid flow (CFX) analysis systems. These governing equations are solved by Newton-Raphson iteration method. The proper grid (106,800 four-node fluid elements and 18,500 eight-node solid elements) is obtained to produce numerically accurate results when the results become independent of its size. In this study, we conduct a test concerning the time step sensitivity and adopt a proper time step of 0.01 s and calculate three cycles to guarantee the periodic steady solution.
Results
Different sectional maximal pressures
Figures 3 and 4 show the pressure waveforms in the artery zone and they are identical for whether 30% or 50% stenoses. It can be seen that the pressure amplitudes decrease progressively in the artery zone. The difference lies in the pressure drop that describes the decrease in pressures from one point in a tube to another point downstream. The pressure drop is 725 Pa for 30% stenosis because the peak pressure is about 800 Pa at section S1 while it is 75 Pa at section S2. However, when the stenosis attains 50%, the peak pressure is about 2000 Pa at section S1 while it is 50 Pa or so at section S2. Thus, the pressure drop reaches 1950 Pa for 50% stenosis. Clearly, there is the higher pressure drop for 50% stenosis in contrast to 30% stenosis. It is found that the increase of percentage stenosis makes the pressure drop increase. Figures 5 and 6 depict the pressure distributions in the microcirculation zone for 30% and 50% stenoses respectively. There are negative pressures in Figures 5 and 6. Furthermore, compared with section S3, there are the higher pressure levels at section S4. Meantime, these absolute values for 50% stenosis are quite higher than those for 30% stenosis.

The maximal pressures in the artery zone for 30% stenosis.

The maximal pressures in the artery zone for 50% stenosis.

The maximal pressures in the microcirculation zone for 30% stenosis.
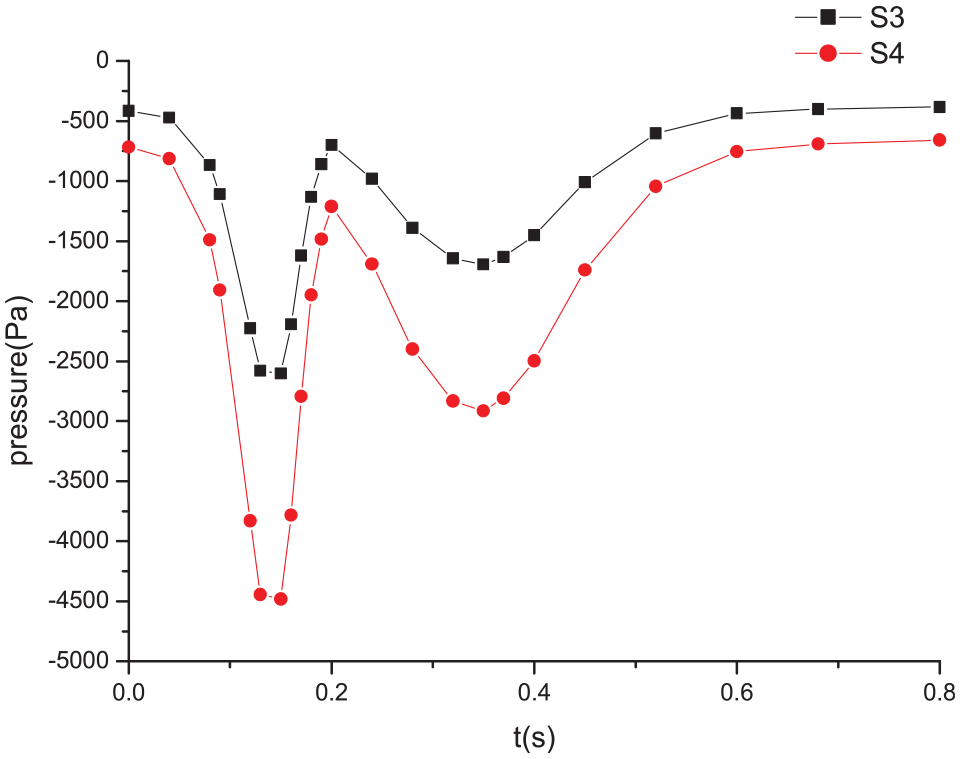
The maximal pressures in the microcirculation zone for 50% stenosis.
Different sectional maximal velocities
Figure 7 shows that there is the higher peak velocity at section S1 in contrast to section S2. However reversely, Figure 8 plots that there is the higher peak velocity at section S2 in contrast to section S1. The finding indicates that the velocity for 30% stenosis falls with the increasing distance away from the inlet while the velocity for 50% stenosis rises. The locations of sections S1 and S2 respectively belong to the pre- and post-stenosis regions. Hence, it explains that the abnormity of the velocity arises with the increase of stenosis severity and a higher flow velocity occurs at the downstream of 50% stenosis. Figures 9 and 10 present the velocity distributions and they do not almost change in the microcirculation zone in contrast to the artery zone. The velocity tendencies for 30% and 50% stenoses are consistent. The velocities in the microcirculation zone are much lower so that they can be thought that the velocities in microcirculation are steady.

The maximal velocities in the artery zone for 30% stenosis.

The maximal velocities in the artery zone for 50% stenosis

The maximal velocities in the microcirculation zone for 30% stenosis.

The maximal velocities in the microcirculation zone for 50% stenosis.
Different sectional maximal wall shear stresses
Though there are almost the same wall shear stress waveforms at sections whether S1 or S2 for different stenoses, the wall shear stresses are obviously higher when the stenosis is 50% (Figures 11 and 12). The peak wall shear stress for 30% stenosis at section S1 is approximately 1.9 Pa, which is higher than 1.1 Pa at section S2. But, the peak wall shear stress for 50% stenosis at section S1 is almost the same as that at section S2. They almost achieve 2.3 Pa. Hence, the wall shear stress value changes with the progression of stenosis severity. Higher wall shear stresses occur in the post-stenosis region for 50% stenosis. The distributions and tendencies of the wall shear stresses basically resemble those of the velocities. In the same way, due to the tiny amplitude, the wall shear stresses in the microcirculation zone can be deemed to be constant, as shown in Figures 13 and 14.

The maximal wall shear stresses in the artery zone for 30% stenosis.

The maximal wall shear stresses in the artery zone for 50% stenosis.
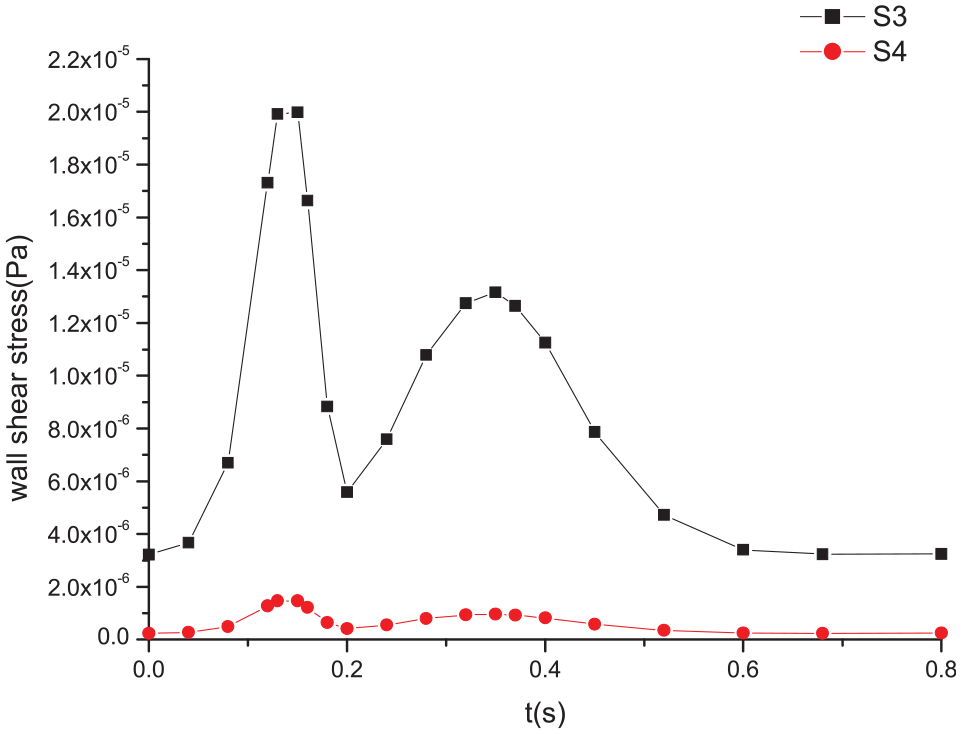
The maximal wall shear stresses in the microcirculation zone for 30% stenosis.

The maximal wall shear stresses in the microcirculation zone for 50% stenosis.
Discussion
These separate methodology effects for stenosis and for no stenosis artery have been investigated in our previous papers.25,26 Particularly, we discuss the pressures of a healthy artery and find that the pressure fluctuation range in the artery zone rises gradually, which matches with clinical observations. 27 On the contrary, the fluctuation range of an artery with whether 30% or 50% stenoses progressively falls. It is implied that microcirculation loses an important role in regulating blood pressures once stenosis happens. Our previous work contributes to understanding the relationship between stenosis and the function of microcirculation and to improving our understanding of the mechanism of the formation of stenosis. 26 This work is further to validate the effects of stenosis severity on hemodynamics. Our numerical simulation is validated by comparing the results with Li’s results. They agree well with each other. 20 The results indicate that stenosis remarkably leads to the characteristic changes. In addition, the numerical comparisons of 30% and 50% stenoses suggest that the wall shear stress and the velocity in the artery zone may be more sensitive than the pressure with the increase of percentage stenosis. The reason is that the pressure tendency does not change while the tendencies of the velocity and the wall shear stress evidently change when stenosis severity alters. There are high pressures for severe stenosis. Further, high pressures induce high wall shear stresses and high flow velocities, which is disadvantage to arterial tissues and leads to relevant diseases. Stenosis may create high pressure drop. 28 It is obvious that plaque cap rupture could be provoked by high wall shear stress. Therefore, these high hemodynamic factors result in the progression of stenosis severity. Thus, a bad feedback comes into being. Regarding hemodynamics, mild stenosis is better in contrast to severe stenosis. Only the pressure tendency in mild stenosis is different from that in no stenosis. It illustrates that the pressure changes are caused when stenosis happens. However, other factors, such as velocity and wall shear stress, just change as the responses of the increase of stenosis severity. Therefore, it is very necessary that stenosis should be treated positively at the initial stage. The treatment is sticky with the increasing degree of stenosis. It is believed that the occurrence of stenosis and microcirculation dysfunction have a close and direct relationship. The normal running of arterial circulation depends on microcirculation function working in the right way. Without exaggeration, microcirculation is a gate and its function is vital to arterial health. In addition, the permeability also affects microcirculation when it is considered as a porous media. The permeability effects of porous media for outlet boundary condition have been discussed in our previous work. 29 The potential implication in clinical management is that understanding the importance of microcirculation not only provides a method for early risk detection of arterial diseases, but also affords an approach for risk stratification, medical interventions to avoid disease progression in the pathophysiological process.
Conclusion
In this work, a fluid–structure interaction stenosis model containing microcirculation function is used to investigate hemodynamics within different stenosis severity. According to the comparisons between 30% and 50% stenoses, the results suggest that (i) the increasing degree of stenosis makes the pressure drop increase, and (ii) the wall shear stress and the velocity in the artery zone may be more sensitive than the pressure with the increase of percentage stenosis, and (iii) there are higher wall shear stress and flow velocity in the post-stenosis region of severer stenosis. The novelty of this present work is to validate the effects of stenosis severity on hemodynamics incorporating compliant arterial wall and microcirculation. The understandings of hemodynamics for different degrees of stenoses provide detailed information for stenosis and microcirculation function.
Footnotes
Acknowledgements
We thank the National Natural Science Foundation of China (81401492), and the Science and Technology Project of Beijing Municipal Commission of Education (KM20151001 6012) for financially supporting this research.
Handling Editor: James Baldwin
Declaration of conflicting interests
The author(s) declared no potential conflicts of interest with respect to the research, authorship, and/or publication of this article.
Funding
The author(s) disclosed receipt of the following financial support for the research, authorship, and/or publication of this article: The work is also supported by the National Clinical Research Center for Cardiovascular Diseases, Fuwai Hospital, Chinese Academy of Medical Sciences (Grant No. NCRC2020007).
Data availability
The data used to support the findings of this study are included within the article.