
Abstract
The objective of this paper is to optimize the selection of seismic ground motion intensity indexes in the seismic fortification of urban shallow-buried rectangular tunnels. This paper takes a shallow-buried rectangular tunnel in a city as the research object, uses ABAQUS to establish a finite-infinite element coupling model, and selects 70 typical seismic ground motions for dynamic calculation. Using dynamic time history analysis method to study the seismic response of tunnel lining structure in terms of internal force, minimum safety factor and strain energy, and analyze their correlation with 15 seismic ground motion parameters. Selecting the seismic ground motion parameters with strong correlation, good effectiveness, and high credibility for safety evaluation. The research results show that: Peak acceleration (PGA) has a weak correlation with the seismic response of tunnel lining structures, and PGA as an independent seismic ground motion intensity index has greater uncertainty in the seismic fortification of tunnels; Peak displacement (PGD), Root-mean-square velocity (RMSV), Root-mean-square displacement (RMSD), and Specific energy density (SED) can be used as independent seismic ground motion intensity index, The linear regression model is used to evaluate the safety of the lining structure, and finally the evaluation result is verified by the incremental dynamic analysis method (IDA), which shows that the evaluation result is accurate. The research results can provide reference for the preliminary design of seismic fortification of rectangular shallow tunnels.
Keywords
Introduction
With the development of underground space, the proportion of urban tunnels in public transportation is increasing year by year. Since the 1980s, frequent earthquakes have destroyed a large number of underground buildings, and the seismic protection of urban tunnels has received much attention in the engineering design process and academic research fields. 1 Seismic response time analysis of urban tunnels under seismic action is the main research method for seismic analysis. 2 But due to the complexity of seismic ground motion, the relationship between seismic response of tunnels and seismic ground motion parameters is not clear, and the influence of seismic ground motion parameters on seismic response varies. 3 Scholars have mostly quantified the strength of seismic ground motion by the PGA for the seismic analysis of tunnels. The correlation between tunnel seismic response and PGA is limited, and there are limitations in using PGA as an independent seismic ground motion intensity index for tunnel seismic design.4–6 Therefore, in the process of seismic protection of urban tunnels, it is of great significant to select suitable seismic ground motion intensity indexes.
Scholars have researched the analysis of seismic ground motion intensity index and the seismic response of various types of structures, which have achieved a large number of results. Bakalis et al. 7 used 135 seismic ground motion records for the dynamic computational analysis of above-ground liquid tanks and showed that the correlation between the average spectral acceleration and the structural response was the strongest. Kostinakis et al. 8 used 64 sets of seismic ground motion records for the dynamic calculation of a flat five-story building and discussed the correlation between its seismic response and different seismic ground motion parameters, the results of the study showed that the correlation of PGA was poor and the trend of correlation between different seismic response indices and individual seismic ground motion parameters was diverse. Zuo et al. 9 selected 20 seismic ground motions and studied the influence of near-fault seismic ground motions on the seismic response of curved bridges and the correlation between seismic ground motion intensity index and the seismic response of curved bridges. The results showed that the peak velocity and peak acceleration ratio (PGV/PGA), PGD and RMSD had strong correlation. Chen et al. 10 used 89 seismic ground motion records to study the correlation between the overall damage index and seismic ground motion parameters in the horseshoe mountain tunnel using dynamic time history analysis method. The results showed that the correlation of PGA was limited, and the correlation of PGV and Arias intensity with the structural seismic response was the strongest two. Huang et al. 11 selected 12 natural seismic ground motion records and used the incremental dynamic method to study the correlation between seismic response and seismic ground motion parameters of circular tunnels on soft ground, and the calculation results showed that the PGA was not always the most correlated as the burial depth increased. The results of numerous studies have shown that the optimal seismic ground motion intensity index based on various types of structures are not consistent. However, most of the research contents are mainly focused on the above-ground building structures, and the correlation between the seismic response of underground structures and seismic ground motion parameters is less analyzed. A clear correlation between the seismic response of rectangular shallow buried tunnels and seismic ground motion parameters can select the appropriate seismic ground motion intensity index for such projects.
Based on the research results of some scholars on seismic ground motion parameters, this paper takes a shallow buried rectangular tunnel in a city as the research object, selects 70 typical seismic ground motions around the world, and uses the dynamic time analysis method to study and analyze the seismic response of the tunnel lining structure under the action of seismic ground motion in both internal force and energy by numerical simulation software ABAQUS. 12 The correlation between the seismic response of the tunnel and 15 seismic ground motion parameters are analyzed and discussed. To minimize the randomness of the analysis results, two correlation calculation methods, Pearson correlation coefficient, and Spearman correlation coefficient, were used to quantify the correlation between tunnel seismic response and seismic ground motion parameters. After the seismic ground motion parameters with strong correlation of seismic response for rectangular shallow buried tunnels are derived, the effectiveness and credibility of these parameters as independent seismic ground motion intensity index for rectangular shallow buried tunnels are analyzed. A linear regression control calculation is then performed for the seismic ground motion intensity index based on tunnel safety. Finally, the IDA was used to verify the regression control results.
Calculation model
A shallow buried rectangular double-linked arch tunnel in a city is used as the engineering background to establish a numerical model for computational analysis. The site where the project is located has good drainage conditions, and the influence of groundwater can be ignored during construction and use. The burial depth of the tunnel is 8 m. The material of the tunnel lining structure is C25 impermeable concrete. The sponge rubber damping layer and the C20 plain concrete cushion layer are installed between the surrounding rock and the bottom of the lining structure. The section size of the lining structure is shown in Figure 1.

Section dimensions of tunnel lining structure.
To reduce the influence of the model boundary on the seismic wave transmission, 70 m of surrounding rock was taken for the calculation of the left and right sides of the tunnel, and the longitudinal thickness of the model was 1 m. The calculation model is shown in Figure 2, and the material-related parameters are shown in Table 1.
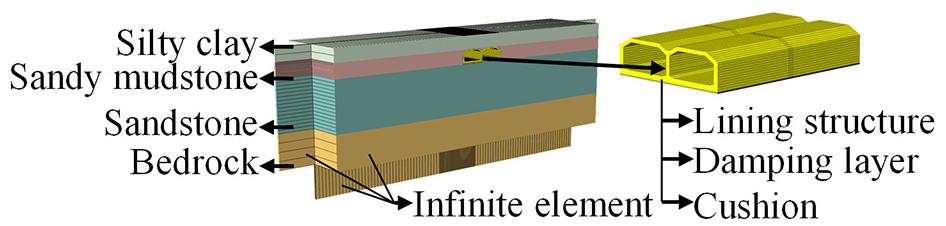
Calculation model.
Mechanical parameters of model materials.

Xiao et al. 13 used infinite element boundary simulations of infinite soils to study the effect of soil blockage during vibrations of grouted piles. Kouroussis et al. 14 calculated the structural response of vehicle loads on roadbeds to study the propagation and reflection effects of infinite element boundaries on load waves. Feng et al. 15 used a finite-infinite element coupling model to study the reinforcement depth of foundations under seismic action. The results of these studies demonstrate the usability of the infinite element boundary in the process of dynamical calculations. In addition, relative to the fixed boundary and viscoelastic boundary, the use of infinite elements can not only simulate infinite soil, but also reduce the superposition caused by the reflection of seismic waves from the boundary, and the calculation results are stable. The computational efficiency is greatly improved under the premise of ensuring computational accuracy. Therefore, some scholars use the finite-infinite coupling element model for computational analysis in the study of geotechnical dynamic response.
Selection of seismic ground motions and related parameters
Selection of seismic ground motions
Based on previous scholars’ research results on the selection principle of seismic ground motion, the time history data of typical seismic ground motions recorded in the US Pacific Earthquake Engineering Research Center (PEER) database is used as the input seismic dynamic loads.16,17 In this paper, the seismic ground motions are not amplitude modulated or filtered. Select 70 seismic ground motions, and their response spectrums are shown in Figure 3.
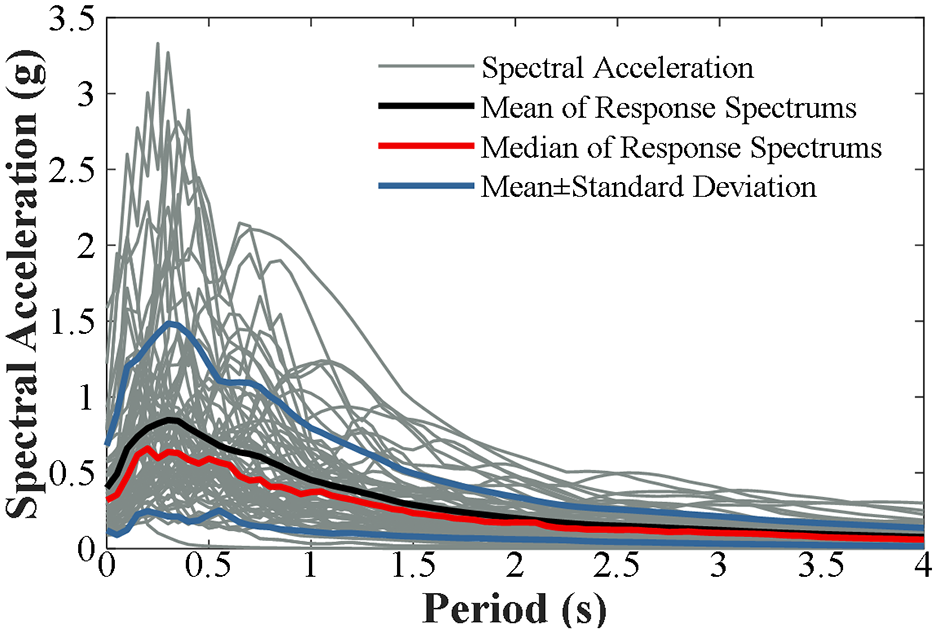
Seismic waves acceleration response spectrum curves.
Seismic ground motion parameters
Combined with the seismic wave signal software SeismoSignal, 15 seismic ground motion parameters, which with strong attention from scholars, greater influence on engineering design, and strong dispersion are selected for research and analysis.18,19 The specific names and numbers are shown in Table 2.
Selected seismic ground motion parameters.

Seismic response index and evaluation method
Internal force and safety factor of lining structure
The degree of tunnel safety under seismic ground motion load is measured by the structural safety factor. 20 The monitoring section is selected at a position of 0.5 m in the longitudinal direction of the tunnel model of each working condition, and nine monitoring points are arranged to calculate the internal force and safety factor of the tunnel lining structure. The arrangement of the monitoring points is shown in Figure 4. The axial force and bending moment at the location of the monitoring point are calculated according to the following formulas 21 :


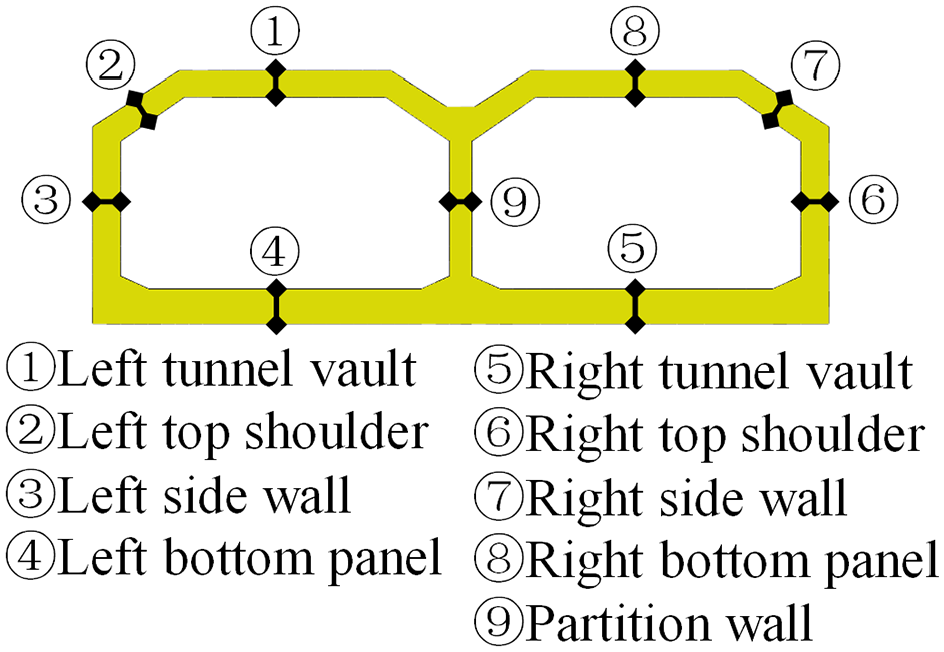
Distribution map of monitoring points.
In these formulas, N – axial force; M– bending moment; E– elastic modulus; εi, εo– internal and external strain on the structure; b– cross-sectional width, here h = 1 m; h– cross-sectional thickness.
The safety factor of the tunnel lining structure is calculated according to the following formulas:


In these formulas, K– safety factor; φ– longitudinal bending coefficient of the member; α– eccentric influence coefficient of axial force; Ra– compressive ultimate strength of concrete; Rl– tensile ultimate strength of concrete; e0– cross-sectional eccentricity.
Strain energy of lining structure
After the tunnel is subjected to seismic ground motion loads, phenomena such as damage, cracking, partial destruction, and overall instability will occur, which is an inevitable result of structural energy conversion. 22 According to the principle of conservation of energy, the energy produced by seismic ground motion loads on the tunnel-surrounding rock system consists of energy that can be absorbed by the surrounding rock and lining structure, and part of the energy absorbed by the tunnel will gradually reduce the strength of the structure, that is, energy dissipation, and the rest is stored in the structure in the form of strain energy. The strain energy can be simplified by the following formula:

The material properties of the tunnel-surrounding rock system are identical for each condition, and the maximum amount of strain energy absorbed by the lining structure, Uemax, can be considered as a constant value, and the ratio of this constant value to the strain energy Ue absorbed by the lining structure under seismic dynamic load in each area, can reflect the safety of the lining structure from the energy absorption level. Therefore, 1/Ue can also be used as the seismic response index of the tunnel lining structure for the seismic response research analysis of this project.
Relevance evaluation
Studies have shown that the seismic ground motion parameters and the seismic response index of the building structure approximately satisfy a log-linear correlation. 23 Taking the natural logarithms of the two as Xi and Yi respectively, then Xi and Yi are approximately subject to linear correlation. Due to the strong randomness and uncertainty of the two variables, two correlation calculation methods are used to quantify the correlation between the two variables. The linearity between Xi and Yi was quantified by calculating the Pearson correlation coefficient ρp and the harmony between the two by calculating the Spearman correlation coefficient ρs. 24


In these formulas, n – sample size of variables Xi, Yi, here n = 70; di– the difference of rank (r(Xi), r(Yi)) of sample points (Xi, Yi), which can be calculated by the following formula:

Effectiveness evaluation
Effectiveness reflects the degree of dispersion of the tunnel seismic response results measured using seismic ground motion parameters. The influence of seismic ground motion parameters on the results of tunnel seismic response is uncertain. The selection of highly correlated and effective seismic ground motion parameters for the seismic fortification design of the tunnel can effectively reduce the dispersion of the seismic response estimates. The average standard deviation value β is introduced to quantitatively calculate and analyze the effectiveness of seismic ground motion parameters. The linear regression relationship between Xi and Yi is obtained by linear regression analysis of the two, and calculate the β of the linear regression model.
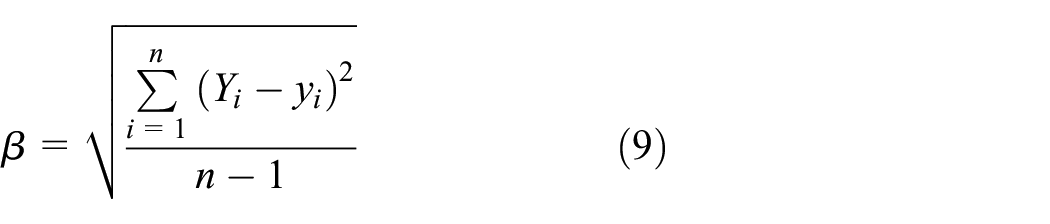
In the formula, yi– estimated logarithm of seismic response calculated by linear regression.
Credibility calculation
Evaluate the credibility of the Xi and Yi linear regression model by calculating R 2 . It is generally considered that the linear regression model is more credible when R 2 ∈ [0.5,0.7), R 2 > 0.7 indicates that the linear regression model is very credible, and R2 < 0.5 indicates that the linear regression model is poorly fitted and is not suitable for linear regression analysis.

Seismic response and correlation analysis
Seismic response
Calculate the axial force, bending moment and safety factor at each monitoring point of the tunnel lining structure at each time under different seismic ground motion loads, and obtain the maximum axial force, maximum bending moment and minimum safety factor at each monitoring point of the lining structure during the entire loading process. Figure 5 shows the distribution of the maximum internal force and the minimum safety factor at each monitoring point. Under the action of seismic ground motions, the maximum internal force value and the minimum structural safety factor value at each monitoring point of the tunnel lining structure have a certain degree of dispersion, which shows that the correlation analysis of this group of seismic ground motion loads has a certain universality. The discrete values of maximum internal forces and minimum structural safety factors at the locations of each monitoring point of the tunnel lining structure under these seismic ground motion loads indicate the universality of the correlation analysis using this group of seismic ground motions. The distribution trend of internal force at each monitoring point of the lining structure under different working conditions is almost identical. The maximum value of axial force at the location of the partition wall, the maximum value of bending moment at the location of the left and right tunnel vaults, the minimum safety factor of the structure appears at the location of the left and right tunnel vaults. It shows that the bearing characteristics of the calculation model under different seismic ground motion loads are basically the same.

Distributions of internal force and safety factor of tunnel lining structure: (a) minimum safety factor, (b) maximum axial force, and (c) maximum bending moment.
Correlation analysis
The strain energy of the lining structure, maximum axial force, maximum bending moment, and minimum safety factor at each monitoring point location are used as seismic response indexes. Calculate Xi, Yi and the correlation between the two.
As Figure 6 shows the calculation of the correlation coefficients, the correlation between PGA and seismic response index is weak, indicating that there are limitations of PGA as an independent seismic ground motion intensity index and using it for seismic design of rectangular shallow buried tunnels, which is consistent with the previous research results on above-ground building structures. 25 PGD, RMSV, RMSD, and SED, as independent seismic ground motion intensity index, are strongly correlated with the seismic response of the tunnel lining structure.

Calculation results of correlation between seismic ground motion parameters and seismic response indexes: (a) Pearson correlation coefficient ρp, (b) Spearman correlation coefficient ρs, (c) absolute mean of correlation coefficients of structural internal forces and safety coefficients, and (d) correlation coefficient of strain energy.
Effectiveness analysis
Combined with the results of correlation analysis, linear regression analysis was performed for the four seismic ground motion parameters with strong correlation and two types of seismic response of tunnel structure safety factor and strain energy, and the calculated results of their regression curves are shown in Figure 7. The estimated values of the seismic response corresponding to the seismic ground motion parameters were calculated by the linear regression model, so as to calculate the average standard deviation β of each seismic ground motion parameter, and the calculation results are shown in Table 3.
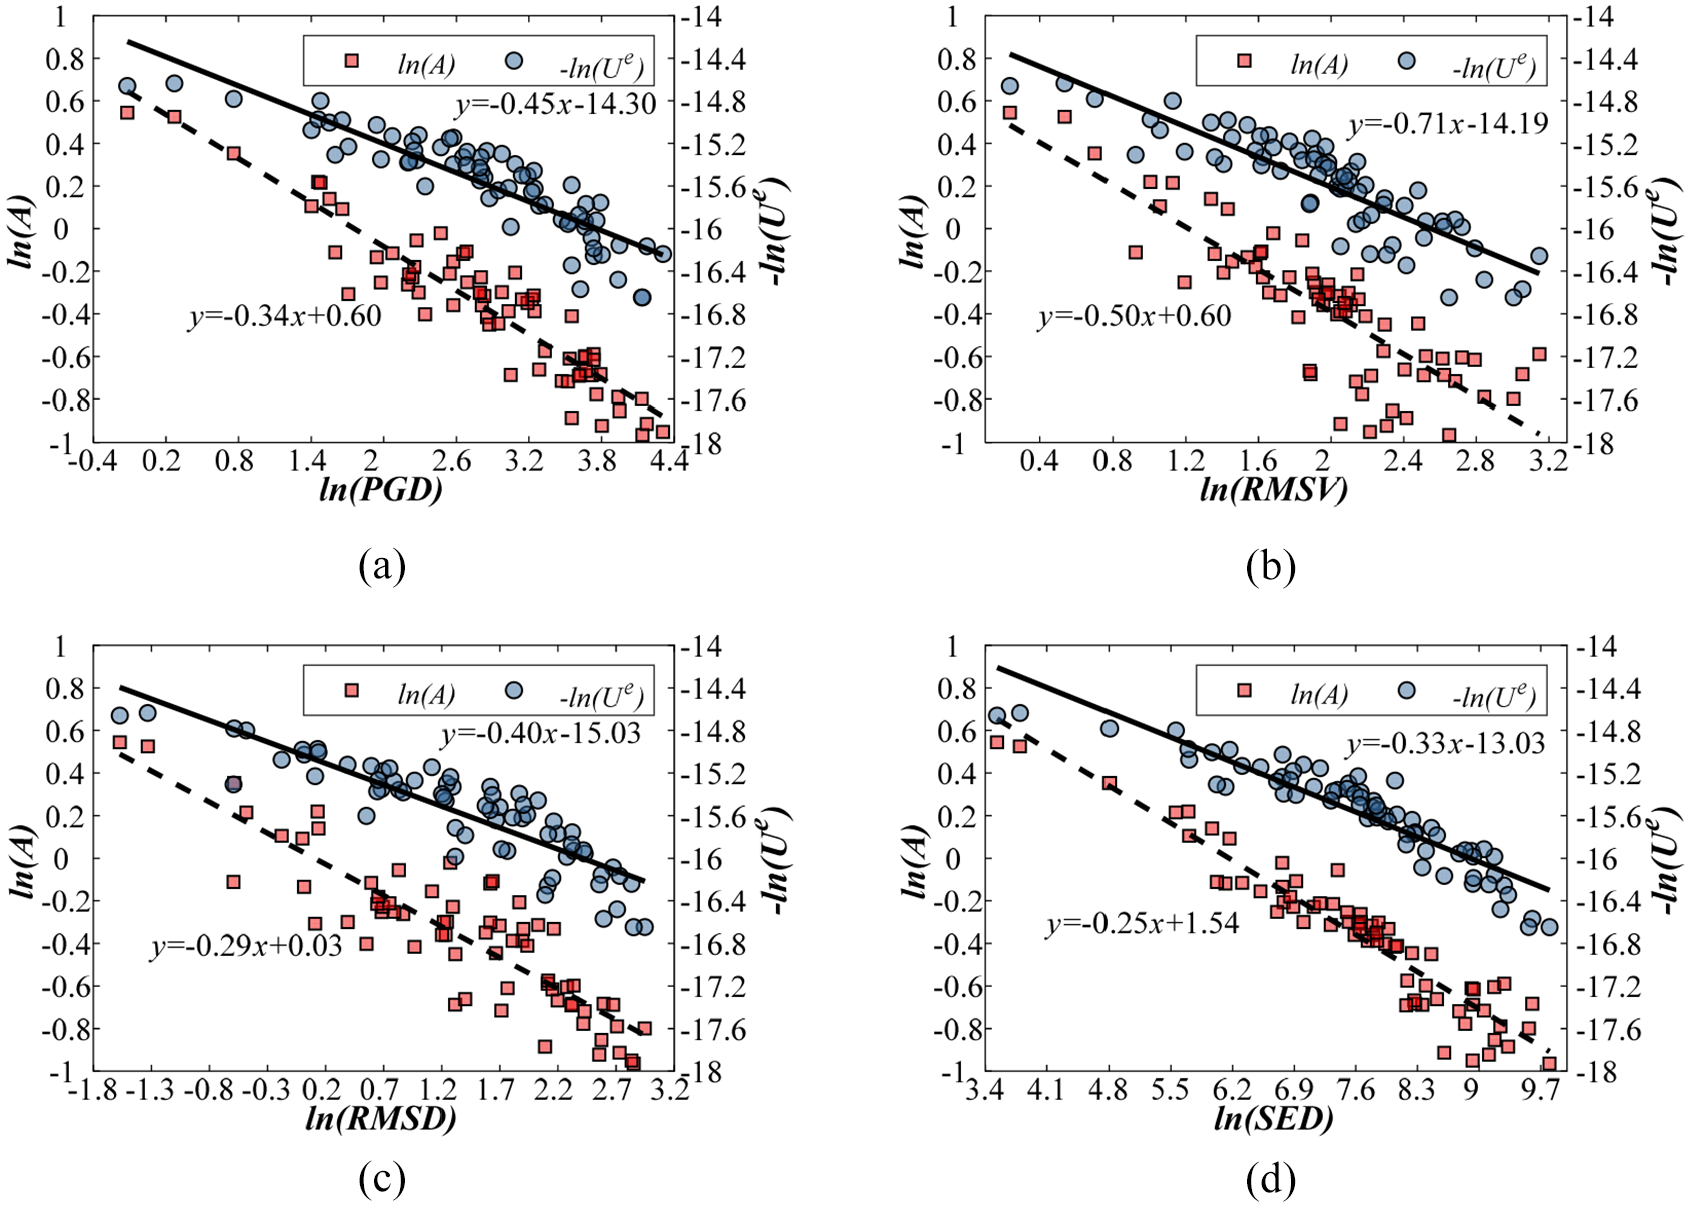
Linear regression analysis models: (a) PGD, (b) RMSV, (c) RMSD, and (d) SED.
The calculation results of the mean standard deviation.

The effectiveness of four seismic ground motion parameters, PGD, RMSV, RMSD, and SED, which have a strong correlation with the seismic response, is analyzed. From the safety discussion of the internal force and energy of the lining structure, the results of the two analyses are consistent. SED is the most effective as an independent seismic ground motion intensity index, followed by PGD, and RMSD again. The RMSV is relatively low, and the range of β is 0.1074–0.2325. It can be considered that the effectiveness of the above four seismic ground motion parameters is good.
Evaluation of seismic ground motion parameters
Safety regression analysis
According to the current tunnel code, based on the characteristics of the project used in this paper, the seismic protection of this project can be considered as meeting the design requirements when the safety factor of the tunnel lining structure is not less than 2.0. 26 Combined with the above seismic ground motion parameter regression models, the safety interval of seismic ground motion parameters of this project was estimated and analyzed. Then the credibilities of these corresponding linear regression models were calculated. The calculation results are shown in Table 4.
Calculation results of the safe interval of seismic wave parameters and credibility.

The calculated analysis shows that the regression calculation of tunnel safety factor using four linear regression models, PGD, RMSV, RMSD, and SED, can be interpreted to a high degree, and all of them have a confidence level of more than 70%. It shows that the minimum safety factor of the tunnel lining structure can be analyzed by the above four linear regression models for regression calculation.
The results show that when SED, PGD, RMSD, and RMSV are used as independent seismic ground motion intensity index, the lining structure meets the requirements of seismic protection when they are not greater than 946.60 cm2/s, 11.58 cm, 2.22 cm, and 6.73 cm/s, and the confidence level is more than 70%.
IDA verification
The calculated results of the regression model were validated by IDA. The design response spectrum in the building seismic design code was used as the target response spectrum (expanding the spectral values by factors of 1, 2, and 3 to form a total of three target response spectrums). 27 The artificial seismic wave generation software SeismoArtif was used to generate six sets of artificial seismic waves with a holding time of 20 and 30 s to match these target response spectrums. 28 The response spectrums are shown in Figure 8. The SED, which with the strongest correlation, was used as the benchmark, and the six sets of artificial waves were adjusted in the interval of 50–2000 cm2/s. The calculation results are shown in Figure 9.
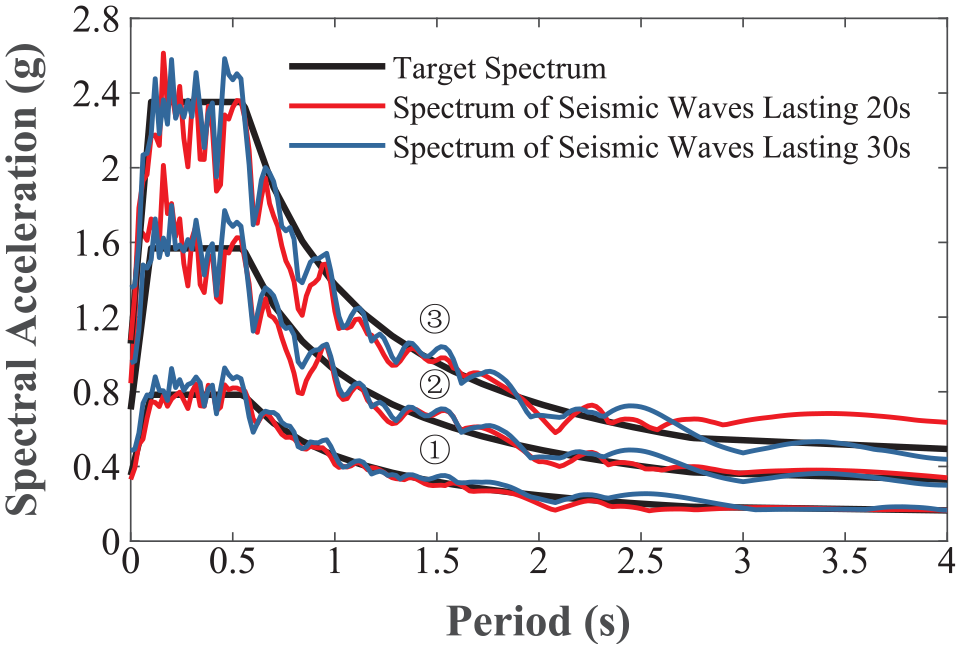
Artificial waves acceleration response spectrum curves.

Calculation results of IDA: (a) PGD, (b) RMSV, (c) RMSD, and (d) SED.
The results showed that the calculated intervals of the critical values of safety factor for PGD, RMSV, RMSD, and SED are 11.50–12.86 cm, 6.56–6.87 cm/s, 2.11–2.40 cm, and 898.54–959.45 cm2/s, respectively, with errors were within 11.05%, 2.53%, 8.11%, and 4.43%, respectively, indicating that the regression results were highly accurate.
Conclusions
In this paper, 70 groups of seismic ground motions were used for the dynamic calculation of a rectangular shallow buried tunnel in an urban area. By correlation evaluation, 15 seismic ground motion parameters were compared and analyzed. Finally, these parameters with strong correlation were analyzed for validity and parameter evaluation. The following conclusions are drawn.
(1) The correlation between PGA and seismic response of tunnel lining structure under the action of seismic ground motion is weak, and there are limitations of PGA as an independent seismic ground motion intensity index for seismic design of tunnel lining structure.
(2) From the correlation and validity analysis of seismic ground motion parameters and seismic response of tunnel lining structure, PGD, RMSV, RMSD, and SED can be used as independent seismic ground motion intensity index for seismic response analysis and evaluation of this type of project.
(3) The linear regression models with four seismic ground motion parameters PGD, RMSV, RMSD, SED, and minimum safety factor of tunnel lining structure were used to estimate the safety of tunnel lining structure with strong and higher than 70% confidence.
(4) When the seismic ground motion load acts on this type of project, the minimum safety factor of the tunnel lining structure can be judged to meet the seismic requirements when PGD, RMSV, RMSD, and SED are used as independent seismic ground motion intensity index and they are less than 11.58 cm, 6.73 cm/s, 2.22 cm, and 946.60 cm2/s, respectively.
(5) The IDA validation results show that the accuracy of the linear regression model calculation results is good, providing a safety design idea for such projects.
In the research process of this paper, only three aspects of seismic response of tunnel lining structure, internal force, safety factor, and strain energy have been considered. At the same time, due to the strong uncertainty of the underground structure, this paper has not calculated and analyzed other projects, and the universality of the research results needs to be further verified.
Footnotes
Handling Editor: Chenhui Liang
Declaration of conflicting interests
The author(s) declared no potential conflicts of interest with respect to the research, authorship, and/or publication of this article.
Funding
The author(s) disclosed receipt of the following financial support for the research, authorship, and/or publication of this article: This work was supported by the National Natural Science Foundation of China (Grant Numbers: 51408008); The Youth Talent Program of North China University of Technology.