
Abstract
Turning has a significant effect on the performance of water-jet pump. Here, the axial flow water-jet pump was used as the research object, the performance and inner flow characteristics of water-jet pump under different turning angle were simulated through numerical simulation. The thrust, vorticity, bubbles in impeller, vapor volume fraction and surface load of blade were analyzed in detail when the turning angles were ±10°, ±20°, and ±30°, respectively. The results demonstrate that the thrust of the water-jet pump decreases linearly with the increase of the turning angle. At the same angle, the thrust of the water-jet pump when turning right is larger than that when turning left, and the maximum thrust difference is 9.14% of that without the turning angle. As the turning angle increases, the overall pressure of the water-jet pump decreases and the streamline distribution gets turbulent gradually. The vortex direction is the same as the turning direction basically. And the vortex distribution range is smaller when turning right under the same turning angle. The cavitation bubbles in the impeller occur firstly at the rim of the blade inlet and develop to the middle of the blade as the turning angle increases. The cavitation area is concentrated on the blade at turning side and the cavitation area when turning right is smaller than that when turning left.
Introduction
As a type of propulsion, the water-jet propulsion is driven by the reaction force generated by the high-speed water jets from the water-jet pump in the study of Jin 1 and Wu and Chen 2 . The stable and efficient operation of the water-jet pump is the basis of the safe navigation of the ship, but the maneuvering conditions such as turning will change the inflow of the water-jet pump, In the study of Wang et al., 3 Cao et al., 4 and Luo et al. 5 it resulting in the performance degradation of the water-jet pump.
As for the performance of water-jet pump when turning, Sun et al. 6 studied the performance of the water-jet ship under turning and found that the effective intake positive suction head of the pump decreased with the increase of the rudder angle. It will make it easier for the water-jet pump to enter the restricted area, which will degrade its performance. However, the positive suction head of the water-jet pump decreases more greatly under the condition of high rotation speed and ship speed. In order to avoid the water-jet pump entering the restricted area, many scholars put forward the maneuvering strategy when the ship turning. In the course of actual navigation, the rudder angle of turning at high ship speed should be limited and turning should be slow. Kong et al. 7 noted that the water-jet ship should not turn at a high initial speed and the maximum allowable initial speed must be considered correctly under turning.
Ding et al.8,9 established the steady and dynamic mathematical model of water-jet turning maneuver system. The results show that in order to keep the water-jet pump performance, it is not suitable for all pumps to turn at large rudder angle under high ship speed. It is preferable to reduce ship speed first and then turn. However, the above scholars mainly focus on the phenomenon of water-jet pump performance degradation when turning, and put forward solutions, but they did not study the reasons for the performance degradation of water-jet pump. In order to explore the reason why the water-jet pump enters the restricted area when the ship turning, Chen 10 took the water-jet catamaran as the research object and analyzed the ship performance under turning conditions. It was found that when the ship was turning at a high ship speed, the ship speed would quickly drop and stabilize, while the rotation speed of the water-jet pump did not change greatly, which caused the water-jet pump entering the restricted working area quickly. Although the above research explains the phenomenon that the water-jet pump is easy to enter the restricted zone, there is a lack of research and analysis on the internal performance changes of water-jet pump when turning, so the principle of performance degradation of water-jet pump when turning cannot be revealed in essence.
As the water-jet pump, the turning condition of the ship mainly leads to the change of the inflow direction of the water-jet pump. Therefore, the turning conditions can be simulated by changing the different inflow directions of the water-jet pump, and the performance of the water-jet pump when turning can be further obtained. Xu and Zou 11 studied the influence of different inlet directions on the performance of the water-jet pump. The results show that the velocity non-uniformity coefficient increases rapidly with the increase of the navigation deflection angle, which is not conducive to the efficient operation of the water-jet pump. To sum up, although the existing research has carried out some exploration on the ship turning conditions, the external characteristics of the propulsion pump and the turning control method of the ship are mainly studied. But there is little research on the inner flow, especially the cavitation performance under turning. Therefore, under the ship turning, the performance of water-jet pump, especially the inner flow and cavitation performance still need to be further studied.
By theoretical analysis and numerical simulation, the performance of water-jet pump is studied and analyzed under different turning conditions. Turning conditions are simulated by changing the inlet angle of water-jet pump, to reveal the transient change and development law on inner flow of water-jet pump under turning. The purpose is to provide some reference for further improving the operation stability of the water-jet pump.
Research model and scheme
Model
The research was based on an axial flow water-jet pump whose design flow rate, head, rotation speed, design ship speed, and specific speed were Q = 630 kg/s, H = 21 m, n = 1800 r/min vd = 30knot, and ns = 531, respectively. The computational domain of the water-jet pump is shown in Figure 1. As shown in Figure 1, the water-jet pump is composed of the impeller, diffuser, nozzle intake duct, and water tank. Table 1 provides the geometric details of the water-jet pump.

Computational domain of the water-jet pump system.
Main geometric parameters of the water-jet pump.

Research scheme
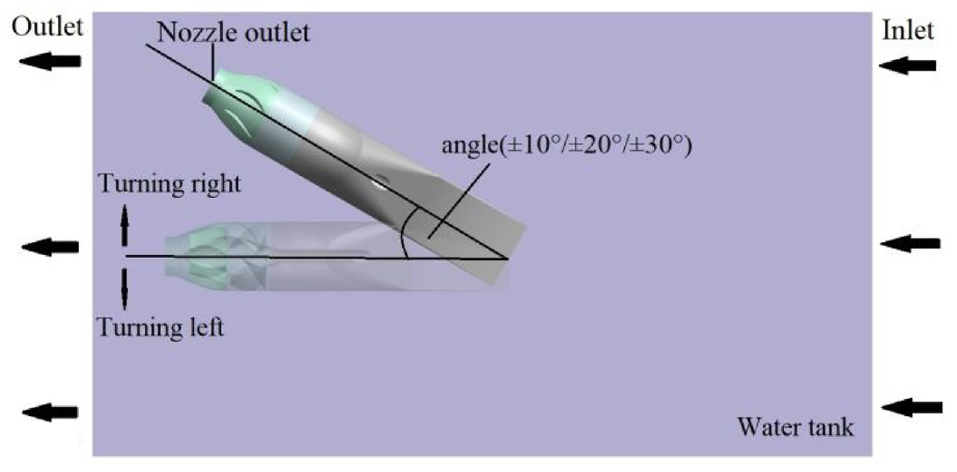
Through changing the inflow angle, the different turning conditions of the water-jet pump were simulated under the condition of 1800 r/min and 40 knots. In practical engineering applications, the ship generally does not turn in large turning angle. On the one hand, the large turning angle will lead to an increase in the load of the main engine. On the other hand, the large turning angle will lead to serious cavitation in water-jet pump. Therefore, the three different small angles (±10°, ±20°, and ±30°) are selected as the research conditions of ship turning. The inlet angles of water-jet pump include ±10°, ±20°, and ±30°, respectively. As shown in Figure 2, the turning angle was defined as the angle between the shaft of the water-jet pump after turning and the shaft when driving straight. Meanwhile, it was defined that turning right is a positive angle and turning left is a negative angle. The thrust, inner flow performance, vortex, bubbles in the impeller, vapor volume fraction and blade surface load of the water-jet pump were analyzed in detail.
Computational domain of the water-jet pump system.
Numerical simulation method
In the recent years, numerical simulation is widely used in scientific research.12–14 Many studies in Guo et al., 15 Zong et al., 16 and Hao et al. 17 have demonstrated that numerical simulations can accurately predict performances of the water-jet pump. As a commercial software of ANSYS, ANSYS-CFX is widely used in fluid dynamics simulation. Therefore, the software ANSYS-CFX is used in this paper to simulate the three-dimensional flow within a water-jet pump under turning conditions.
Computational grid and mesh independence test
The high-precision structured hexahedral grids are generated for the whole computational domain using ANSYS-ICEM mesh generation tool. The boundary layer of the impeller and the diffuser is divided into an O-shape to ensure that the mesh element quality is above 0.3 and meet the calculation accuracy requirements. The grid of each component of the water-jet pump is shown in Figure 3.

Grid of each component of water-jet pump: (a) impeller grid, (b) diffuser grid, (c) inlet duct grid, and (d) nozzle grid.
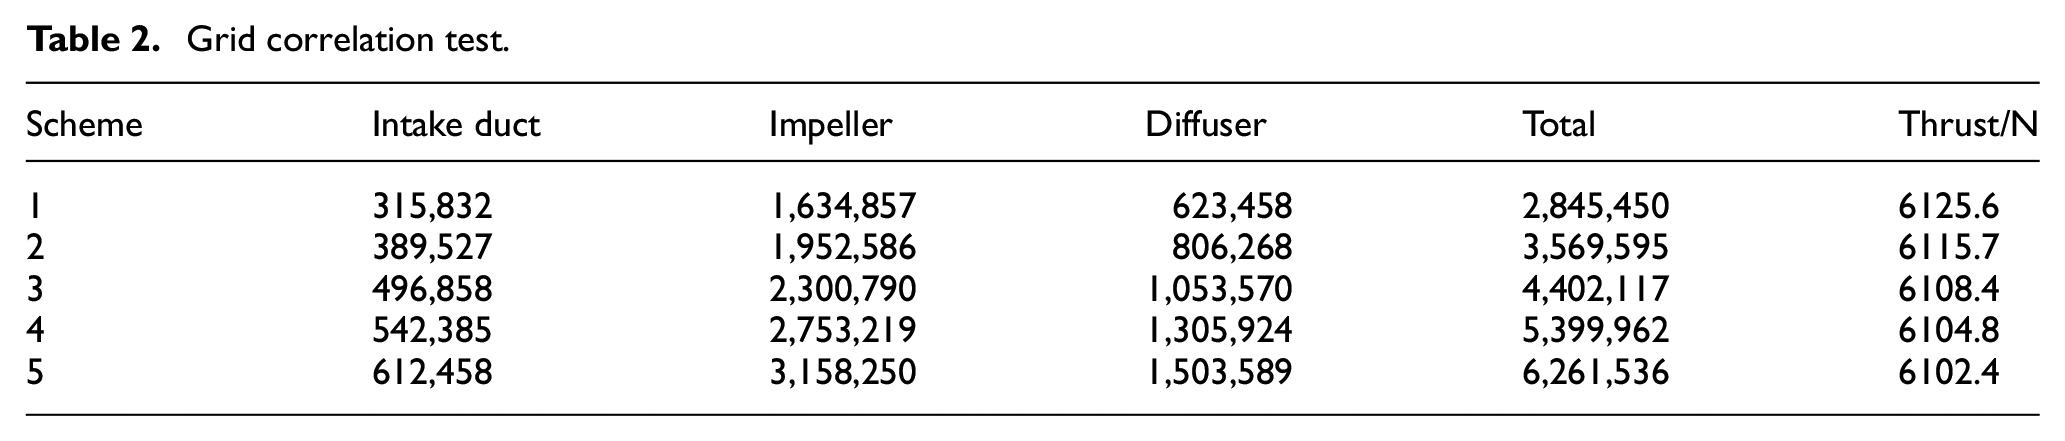
To avoid the influence of grid quantity on the calculation results, five sets of grids of the water-jet pump were generated to check the grid independence, and the thrust of the water-jet pump was used as the criterion under rated conditions. Meanwhile, according to the elementary momentum theory, the reaction thrust equals to the variation rate of water momentum, and can be written as:

Where
The results are summarized in Table 2. It can be seen from Table 2, with the increase of grid number, the grid number has little influence on the thrust after scheme 3. Considering the computational complexity and calculation accuracy, scheme 3 was selected finally.
Grid correlation test.
Turbulence model
The steady–state turbulent flow based on the Reynolds–averaged Navier–Stokes equations were solved by the RNG k-ε model to give accurate predictions of the flow separation phenomena. Meanwhile, k-ε model was used to examine the various parameters in a turbulent flow. The transmission equations for this model are as follows:


Where
Cavitation model
Z-wart cavitation model is widely used in cavitation calculation.18–21 The Z-wart cavitation model is proposed by Zwart et al., 22 being applied in this study, can be derived from Rayleigh-Plesset equation. The cavitation model is derived from the mass transfer equation as follows:


Where u is the velocity,
Boundary conditions
ANSYS-CFX18.0 was used to simulate the complicate flow in the water-jet pump. As seen in the vessel frame of reference, the impeller domain was set as the rotating frame with design shaft speed. The diffuser, intake duct, nozzle, and water tank were set as a stationary frame. Furthermore, the interface between the stationary frame and the rotating frame was set as the rotor-stator interface, where frozen rotor method was used for the frame change. Moreover, the non-slip wall condition was imposed at the solid walls, and the adjacent wall area was processed by the standard wall function.
The inlet boundary condition was set as the velocity inlet type (Normal Speed/knot), the outlet boundary of the water tank was set as the free flow type (Opening), and the nozzle outlet boundary was set as the static pressure outlet type (Static Pressure). The location of the inlet and outlet is shown in Figure 2. The high resolution scheme was used for the convection terms, and a high-precision second-order upwind solution in which the convergence accuracy of 10−4 was adopted. The fluid was the ideal water at 20°C, and the saturated vapor pressure of the fluid is set to be 3169 Pa.
Validation of the numerical simulation
Test system
In order to verify the calculation reliability of the numerical simulation, a performance test was carried out on the pump section (impeller, diffuser, and nozzle) of the water-jet pump. The test rig is mainly composed of inlet water tanks, outlet water tanks, impellers, diffuser, nozzles, inlet varied diameter pipe, outlet varied diameter pipe, inlet elbows, motors, electromagnetic flowmeters, and pressure sensors. The structure of the model pump test rig is shown in Figure 4. The sketch of the experimental set-up is shown in Figure 5. The test shaft speed is set as the rated rotation speed of the water-jet pump, 1800 r/min. The inlet angle of water-jet pump is 0° (without turning condition). The performance test of water-jet pump starts from the maximum flow rate, and the mass flow rate is adjusted by adjusting the discharge valve. The head of water-jet pump under different mass flow rate is recorded, and then the performance of water-jet pump is obtained under rated speed. The uncertainty of the electromagnetic flowmeter is 0.2%, while the torque meter has an uncertainty of 0.1%. The uncertainty of the pressure transducer is less than 0.1%.
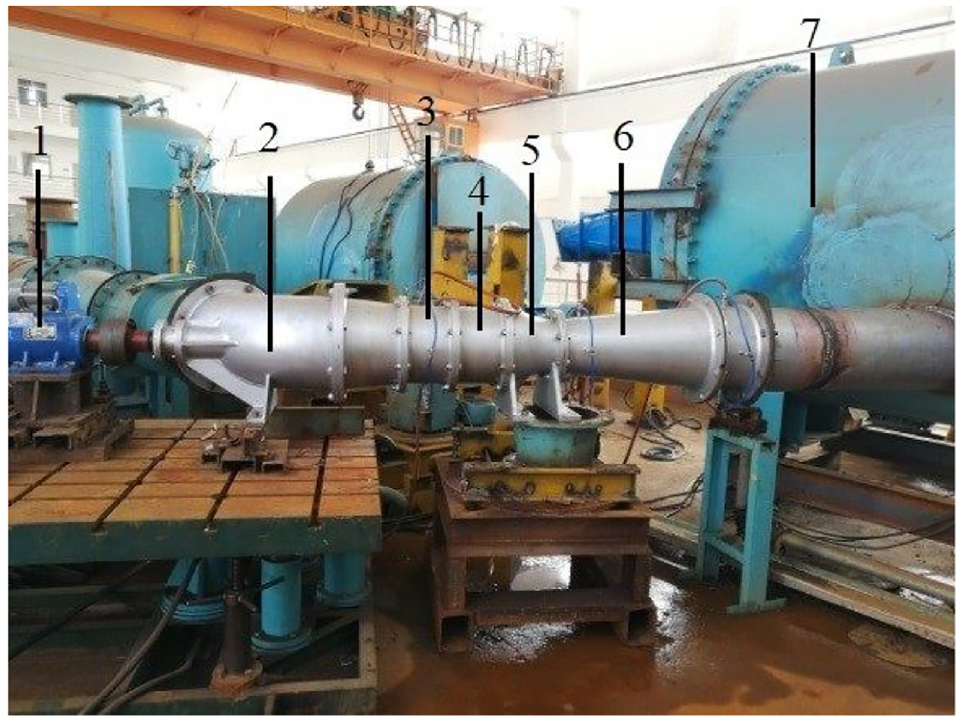
Model pump test rig: (1) motor, (2) inlet elbows, (3) impeller, (4) diffuser, (5) nozzle, (6) outlet varied diameter pipe, and (7) outlet water tank.
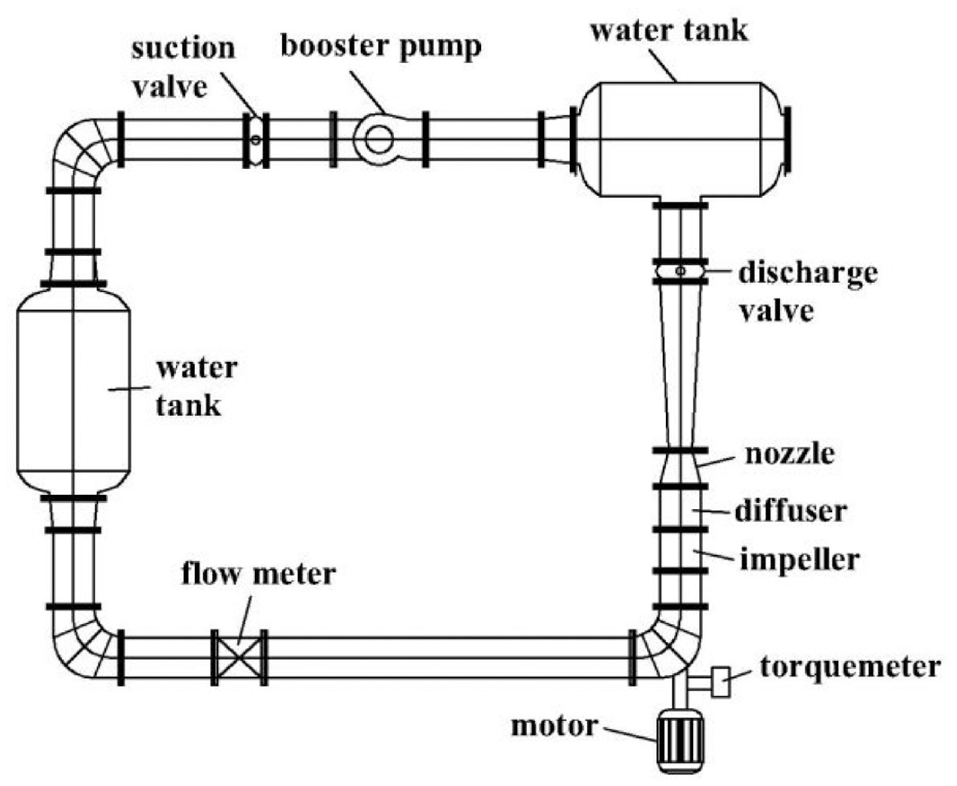
Sketch of the experimental set-up.
Test verification
The performance of the water-jet pump is simulated by the above method, and compared with the test data. Figure 6 shows the comparisons of the head for the water-jet pump between the experiments and the numerical simulations. It shows that the calculated head is in good accordance with the experimental head. The head deviation increases under the partial working conditions, but the maximum deviation of the head is within 2%, which meets the accuracy requirements. Therefore, the numerical approach is validated to be feasible and reasonable for the research.

Comparison of head between numerical and experimental results.
Results and discussion
Thrust under turning conditions
Figure 7 shows the thrust of water-jet pump under different turning angles. It can be seen from Figure 6 that when the turning angle is 0°, the thrust of the water-jet pump is 4161.72 N. Under turning conditions, the thrust decreases linearly as the turning angle increases. It can be found that the thrust under turning right is generally larger than that under turning left at the same turning angle. The thrust difference increases gradually with the increase of turning angle and the maximum thrust difference is 9.14% of the thrust under no turning angle. It is shown that the thrust performance of the water-jet pump is better under turning right.

The thrust of the water-jet pump under different turning angles.
Inner flow under turning conditions
Flow in intake duct
Figure 8 shows the flow in the intake duct under different turning angles. It can be seen that the pressure in the intake duct increases gradually from inlet to outlet, and the high pressure area is at the inlet lip and the upper side of the intake duct. As the turning angle increases, the overall pressure in the intake duct decreases gradually and the pressure distribution of the intake duct under turning right is basically the same as that under turning left.
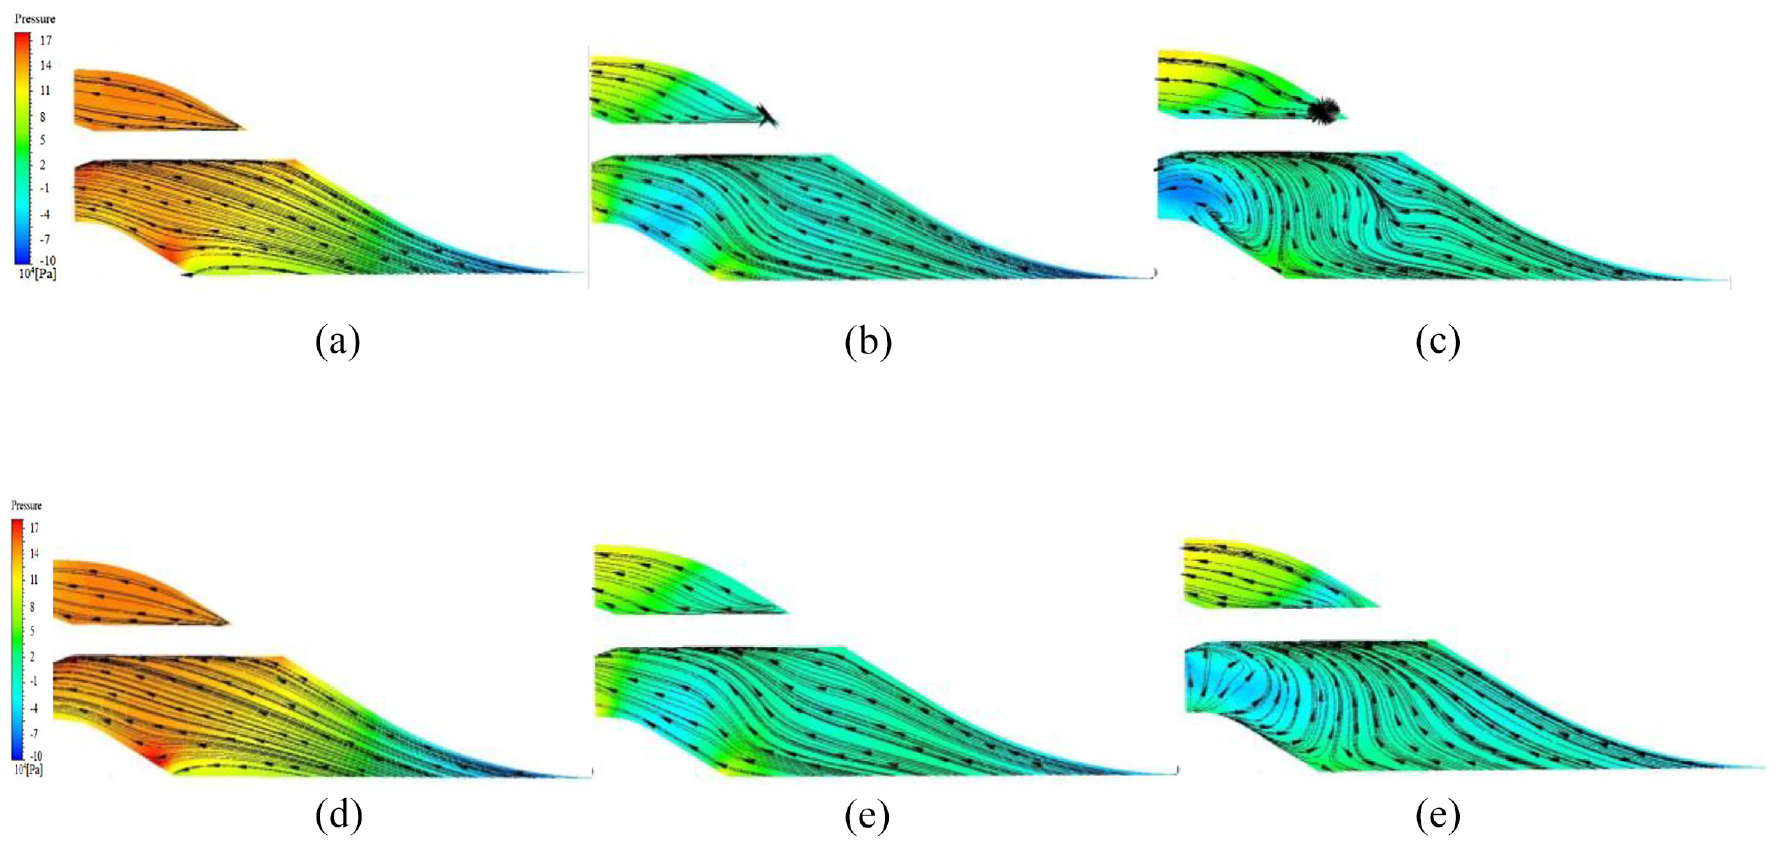
Pressure and streamline in intake duct under different turning angles: (a) −10°, (b) −20°, (c) −30°, (d) 10°, (e) 20°, and (f) 30°.
From the streamline distribution, it can be seen when the turning angle is ±10°, the streamline distribution in the inlet is more uniform, and there is vortex at the inlet lip (Figure 8(a) and (d)). When the turning angle is ± 20°, the cylinder disturbing phenomenon of the rotating shaft intensifies, and the streamline in the channel deflects partially (Figure 8(b) and (e)). When the turning angle is ±30°, there is a large range of backflow under the channel (Figure 8(c) and (f)). In conclusion, the increase of the turning angle will result in the deterioration of the flow in the intake duct, especially near the rotating shaft, where vortex and backflow appear, resulting in a local low pressure area, and this may cause cavitation. By comparison, it can be found that the streamline distribution is more uniform when turning right, which means lower pressure drop, less inner vortex and more stable flow.
Flow in impeller and diffuser
Figure 9 shows the axial static pressure distribution in axial section of water-jet pump under different turning angles, the axial section of water-jet pump is the only symmetry plane. It can be seen from Figure 9 that the pressure distribution increases first and then decreases in water-jet pump. This is because the fluid pressure will increase due to impeller rotation. As the turning angle increases, the pressure at the impeller inlet decreases gradually, and the local low pressure area appears, which may result in cavitation. Compared with different turning directions, the pressure when turning left is smaller than that when turning right. When turning left, the pressure of the water-jet pump is reduced obviously, and the flow stability in the diffuser also decreases as the angle increases.

Static pressure in impeller and diffuser under different turning angles: (a) −10°, (b) −20°, (c) −30°, (d) 10°, (e) 20°, and (f) 30°.
When turning occurs, it will lead to loss increase in the channel, but because the turning of the shaft is certain, turning right is equivalent to giving a positive torque to the shaft, which can improve the work capacity of the impeller, and the pressure distribution in the channel will be more obvious. When turning left, the resistance in the channel is increased, so the pressure distribution in the channel is significantly lower than under normal conditions.
Vorticity distribution in the impeller
The vorticity is a measure of the intensity of vortex, which is used to characterize the changes of vortex in the fluid. Figure 10 shows the vorticity distribution under different turning angles. With the increase of the turning angle, the vortex is initially concentrated at the rim of the inlet and the tip gap, diffused to the middle of the blade gradually, and the vorticity distribution becomes larger. The vorticity distribution is different on different blades. Comparing different turning directions, the vorticity direction is the same as the turning direction basically. Under the same turning angle, the vorticity distribution changes when turning left. It showed a flaky distribution when the rim of the blade inlet developed to the middle, with a larger distribution range and more serious shedding from the blade.

Vorticity distribution in the impeller under different turning angles: (a) −10°, (b) −20°, (c) −30°, (d) 10°, (e) 20°, and (f) 30°.
In general, the vortex direction is the same as the turning direction basically, this can be explained that when the ship turn right, it is equivalent to giving a positive torque to the rotating shaft, and it is opposite when ship turn left. Therefore, the vorticity is concentrated on the right blade when turning right, and it is opposite when turning left. When turning left, the inflow has a partial velocity opposite to the impeller rotation direction, due to the influence of flow resistance, more vortex appear in the blade, and the loss in the channel increases. When turning right, the situation is opposite, so the vorticity distribution range of impeller is smaller and the hydraulic loss is smaller.
Influence of turning conditions on cavitation performance of water-jet pump
Cavitation in the impeller
Figure 11 shows the bubbles distribution and pressure under different turning angles. When turning at a low angle, cavitation is initiated. There are a few bubbles on the blade suction surface, and the bubbles are concentrated on the rim of the blade inlet. This is because the pressure at the rim of the blade inlet is lower than the saturated vapor pressure, which leads to cavitation. As the turning angle increases, the range of blade low pressure region increases, leading to more bubbles and serious cavitation. It can be seen from the Figure 11 that the bubbles pressure gradually increases from the inlet rim to the hub. This explain that bubbles initiate from the rim of the blade inlet, develops to the middle of the blade, and gradually collapses. As the turning angle increases further, a large number of bubbles also appear at the hub. The bubbles with large angle turning fall off from the blade, and the degree of cavitation is serious gradually. The cavitation is concentrated in the same direction as the turning direction, and the cavitation when turning left is more serious than that when turning right.

Bubbles distribution in the impeller under different turning angles: (a) −10°, (b) −20°, (c) −30°, (d) 10°, (e) 20°, and (f) 30°.
In order to further analysis of the impeller cavitation development, Figure 12 shows the volume fraction distribution on the span = 0.2, 0.4, 0.6, 0.8 of the blades under different turning angles. When the turning angle is ±10°, the cavitation is still in its initial state, and the bubbles are almost invisible from the rim to the hub (Figure 11(a) and (d)). When the turning angle increases to ±20°, the bubbles are concentrated on the suction surface of the blade, and the volume fraction of the cavitation increases near the rim and the hub (Figure 11(b) and (e)). When the turning angle increases to ±30°, the cavitation bubbles fall off gradually at the hub and develops gradually from the rim to the middle of the channel (Figure 11(c) and (f)). Compared with turning left, the vapor volume fraction on each section of the blade is lower under turning right, indicating that the cavitation performance is better under turning right.

Vapor volume fraction distribution under different turning angles: (a) −10°, (b) −20°, (c) −30°, (d) 10°, (e) 20°, and (f) 30°.
Through the analysis, the left turn is opposite to the shaft turn of the water-jet pump, and the resistance in the channel increases, which is equivalent to providing a negative suction head and more prone to cavitation, on the contrary, the kinetic energy of the flow is reduced under turning right. Therefore, the situation under turning right is better than that under turning left.
Vapor volume fraction in Impeller
Figure 13 show a comparison of the vapor volume fraction in the impeller under different turning angles. The bubbles distribution law in the impeller is similar under different turning direction, and the vapor volume fraction in the impeller increases sharply with the increase of the turning angle. However, the increase rate is different under different turning direction. The cavitation is obviously more serious under turning left. When the turning angle is 10°, the cavitation is in its initial state, and the vapor volume fraction in the impeller is similar under different turning direction. When the turning angle is 20°, the vapor volume fraction in the impeller has reached 5.24 times that under the turning right. When the turning angle is 30°, the cavitation development in the impeller, which causes the vapor volume fraction to continue to increase, and the gap between the vapor volume fraction also increases under different turning, and the vapor volume fraction under turning left is 3.42 times that under turning right.

Comparison of vapor volume fractions in impellers under different turning angles.
Blade surface load
In order to further analyze the functional strength of blades under different turning angles and the degree of blade cavitation, Figure 14 shows the location of the different blades (From the inlet, blade 1 is at the upside). Figures 15 and 16 show the load distribution of the middle streamline of the blades when the turning angles are ±10°, ±20°, and ±30°. In order to facilitate the analysis of changes of load in the blade, the relative position of the middle streamline is represented by x/X.

The location of the different blades.

The blade surface load distribution under different turning angles (left turn): (a) blade 1, (b) blade 2, (c) blade 3, (d) blade 4, and (e) blade 5.

The blade surface load distribution under different turning angles (right turning): (a) blade 1, (b) blade 2, (c) blade 3, (d) blade 4, and (e) blade 5.
It can be seen from Figure 15 that due to the flow separation at the chamfer of the blade inlet, there are high pressure points and low pressure points at the blade inlet under different conditions. When there is no turning, the pressure on the back of the blade decreases first and then increases, and reaches the minimum value at x/X = 0.1. When the turning angle is −10°, it is the same as when there is no turning that the pressure distribution on the middle streamline on blade back. When the turning angle is −20°, the pressure on the back of blade 1 and blade 2 decrease at x/X = 0∼0.01 (Figure 15(a) and (b)). The pressure on the back of the blade 3 has a maximum value at x/X = 0.1, and the pressure on the back of the blade 4 decrease sharply between x/X = 0∼0.03, indicating that cavitation has occurred in the middle of the blade (Figure 15(c) and (d)). The pressure remains constant on the back of the blade 5 at x/X = 0∼0.2, indicating that the cavitation area in the middle of the blade becomes larger gradually. When the turning angle is −30°, the pressure remains constant on the back of the blade 3 and blade 4 at x/X = 0∼0.3, indicating that the cavitation area increases with the turning angle increasing, and the pressure on the back of the blade 5 is only a constant value at x/X = 0∼0.08 (Figure 15(e)). The cavitation area of the blade decreases.
It can be seen from Figure 16 that when the turning angle is 10°, the pressure distribution on the middle streamline of the blade is basically the same as when there is no turning. When the turning angle is 10°, the pressure on the middle streamline is slightly higher than that when there is no turning, indicating that cavitation does not occur basically in the water-jet pump when the turning angle is small. When the turning angle is 20°, the load distribution in each blade is relatively uniform, and only the pressure of blade 2 is a constant negative pressure at x/X = 0∼0.07, indicating that cavitation has occurred at the inlet of blade 2 (Figure 16(b)). When the turning angle is 30°, the pressure on the back of the blade 3 is a constant negative pressure at x/X = 0∼0.2, and the pressure on the back of the blade 4 has a minimum value at x/X = 0.12 (Figure 16(c) and (d)).
Comparing Figures 15 and 16, under different turning conditions, the surface load distribution of the middle streamline on the blade working face is basically the same, as the streamline direction first increases and then decreases, it reach an extreme value at x/X = 0.75. Under turning right, the constant negative pressure is smaller in the surface load of the middle streamline on the blade back, the stability of the pressure distribution is better, and the blade is more functional.
Conclusion
By changing the inlet flow angle of water-jet pump, the equivalent turning conditions are obtained. The thrust performance, inner flow performance and cavitation performance of the water-jet pump under different turning angles and different turning direction are compared and analyzed. The main conclusions are as follows:
The thrust of the water-jet pump decreases linearly with increase of the turning angle. The thrust under turning right is greater than that under turning left at the same turning angle, and the maximum thrust difference is 9.14% of that without the turning angle.
As the turning angle increases, the pressure in the intake duct decreases gradually, and the flow of the intake duct deteriorates. The inlet pressure of the impeller decreases gradually, and the local low pressure area increases. The vortex distribution is basically the same as the turning direction, and the vortex distribution range is larger under turning left at the same turning angle.
The cavitation bubbles in the impeller are first generated on the rim of the impeller inlet, and the cavitation area is concentrated on the blade of the turning side. The cavitation under turning right is better than that under turning left. With the increase of the turning angle, the cavitation on each section develops gradually from the rim of the blade suction surface to the middle of the flow channel.
Under different turning conditions, the surface load of the middle streamline of the blade working surface increases first and then decreases with the flow direction. Under different turning angles, there is a sudden drop in pressure at the back of the blade, which is relatively small under turning right.
Footnotes
Handling Editor: Chenhui Liang
Declaration of conflicting interests
The author(s) declared no potential conflicts of interest with respect to the research, authorship, and/or publication of this article.
Funding
The author(s) disclosed receipt of the following financial support for the research, authorship, and/or publication of this article: This work was supported by the National Natural Science Foundation of China under Grant 51779108, 51979124, and 52179084; And the Priority Academic Program Development of Jiangsu Higher Education Institutions (PAPD).