
Abstract
Seismic behavior of a structure is directly related to its dynamic characteristics, which include natural frequency, damping ratio, and mode shape. This study focuses on the long-term monitoring of dynamic characteristics of six selected target structures. The covariance-driven stochastic subspace identification (SSI) approach is used to estimate the fundamental natural frequency and damping ratio of target buildings based on long-term motion records in order to examine the temporal variation of dynamic properties. The fundamental natural frequency and damping ratio variations over time are first discussed. It is found that the fundamental natural frequency of some structures reduces dramatically after the 2011 Tohoku Earthquake, accompanied by a rise in damping ratio. Then, regression analysis is used to assess the relationship between dynamic characteristics and ground motion parameters (Peak ground acceleration (PGA), magnitude, focal depth, and epicentral distance) and structural response (root mean square acceleration, maximum response amplitude). It is discovered that the identified natural frequency has no clear correlation with the focal depth, a slight negative correlation with the epicentral distance, and a strong negative correlation with the magnitude and PGA. The root mean square acceleration and the maximum response amplitude are negatively correlated to the target buildings’ natural frequencies. Finally, the influence of environmental factors on dynamic properties is investigated.
Keywords
Introduction
Earthquake is the external cause of earthquake damage, and its effect is equivalent to the load in structural analysis. The dynamic characteristic of a structure is an important internal factor that determines its response under seismic loads. The dynamic characteristics mainly include natural frequency, damping ratio, and mode shape. Natural frequencies and mode shapes are determined by an “eigenvalue equation” that depends on the physical parameters (stiffness and mass) of the structure. 1 Together with damping characteristics they completely determine the structural dynamic response under dynamic loads. When the structure resonates with the dynamic load, its dynamic response increases significantly, this is determined by the natural frequency. Damping is related to energy dissipation, that is, the greater the damping, the lower the response. Mode shape affects the nature and spatial distribution of vibration. In civil engineering, this situation is often found. If the natural frequency and damping ratio of two structures with similar appearance are very different, the dynamic performance of the structure is also very different. Different structures, but their natural frequency and damping ratio are very similar, their dynamic performance is basically the same under dynamic load. For seismic design of high-rise or super high-rise buildings, the natural frequency is a meaningful reference index. Natural frequency is one of the main dynamic characteristics of a structure or system. It is related to many factors, such as the layout of the plane, mass distribution, component stiffness, material properties, and foundation conditions. 2 Damping is a factor that attenuates vibration, or a factor that causes energy to be dissipated. Single-frequency vibration has a constant vibration form. This kind of vibration form in which the displacement shape of the structural system remains unchanged is called the main mode or mode. It is important for engineers to accurately identify the dynamic characteristics of the engineering structure and understand its changing laws, and then determine or estimate the actual behavior of a engineering structure, and ensure the reliability of a structure. In other words, the natural frequency of a structural system is a significant factor. It not only reflects the mass and stiffness distribution state of the structure. If the natural frequency of the structural system changes, it can also indirectly reflect the change in the physical behavior of a structural system. Therefore, it can qualitatively and quantitatively discriminate the change of the state of a structural system. 2 The ground motion recorded by the strong motion accelerometer is called the strong motion record. Identifying the dynamic characteristics of the structure based on strong motion records can accumulate data for the safety evaluation and damage identification of the building, and provide a basis for the establishment of a reasonable building numerical model. 3 The seismic response of the structure depends on the ground motion input and the dynamic characteristics of the structure itself. The level of seismic response analysis is also improved with the deepening of people’s understanding of above two aspects. Todorovska and Trifunac 4 evaluated the propagation time of the vertical wave of the Van Nuys 7-story hotel using the impulse response function calculated by deconvolution of strong motion data, and then used the wave propagation time to estimate the fundamental fixed-base frequency. Based on long-term strong earthquake records, Morishita et al. 5 investigated the relationship between the natural frequency of RC constructions and the maximum displacement. This work not only discusses the long-term changes in the dynamic characteristics of various types of target buildings, but it also focuses on the dynamic characteristics’ influencing factors, such as ground motion input, structural response, and environmental factors.
With the rapid development of high-rise buildings, dynamic identification, and structural health monitoring (SHM) of high-rise building structures have become critical issues. Vibration-based structural health monitoring refers to a series of methods to obtain structural damage status information by measuring and analyzing the vibration response of structures. The key idea behind these methods is based on the assumption that damage will locally change the stiffness, mass, or energy dissipation mechanism of the structural member, thereby affecting the dynamic behavior of the overall structure. 6 In recent years, the improvement and promotion of effective automated output-only or operational modal analysis (OMA) technology has further promoted the selection of frequency as the priority damage detection parameter. 6 The natural frequency of the structure will alter as it is damaged or deteriorates. The most useful damage location methods (based on dynamic testing) may be those that use changes in resonant frequency, because frequency measurements can be made quickly and are usually reliable. 7 However, a significant change in frequency itself does not mean the existence of damage, because there are some other factors that may also cause changes in dynamic characteristics, such as the characteristics of ground motion itself, response amplitude, system nonlinearity, temperature changes, moisture absorption, soil structure interaction, and measurement noise. Kashima8–10 identifies the dynamic characteristics of the building structure based on strong earthquake records, and the correlation between the dynamic characteristics of the structure and the response amplitude is analyzed. In the monitoring of a 17-story steel frame building, Nayeri et al. 11 observed a strong correlation between modal frequency changes and temperature changes within 24 h. Wu et al. 12 proposed the use of environmental vibration measurement and the recently developed random subspace identification method for continuous dynamic monitoring of office buildings. Their research results show that the natural frequency is directly related to wind speed and indirectly related to air temperature. According to the present literature, there are many environmental factors impacting dynamic features, particularly temperature, which will alter the natural frequency of civil structures such as bridges, buildings, and heritage structures. The correlation between environmental conditions (temperature, humidity) and frequency can be positive or negative, depending on the specific structure and vibration mode, and the way in which the two are related to each other is not easy to predict. 6 Similarly, there is no consensus on the mechanism of frequency changes observed based on strong motion records.
In civil engineering, the input signal is generally not obtained, the output-only or operational modal analysis (OMA) is required in such applications to obtain reliable modal parameters. Either via the frequency domain or time domain analysis, several OMA methods were developed over the past few decades. 13 Among all these OMA approaches, stochastic subspace identification has gained particular popularity in civil engineering applications 14 since its widely employed formulation was initially proposed in 1991 15 and the corresponding algorithm for modal parameter identification was subsequently established.16,17 The method identifies a discrete-time state-space model of the structure from output-only data. The only parameter in this model is the model order. 17 In the study of dynamic characteristics of building structures based on strong motion records, the data-driven SSI and the covariance-driven SSI18–21 are widely used together with the developed automatic mode selection algorithm. This study also use the covariance-driven SSI method to determine the dynamic characteristics of the target building structures. Figure 1 depicts the content and analysis methods of this study. The dynamic characteristics of the building are then researched over time, and the association between the dynamic characteristics and ground motion parameters (peak ground acceleration (PGA), magnitude, and epicentral distance), structural response is assessed. Furthermore, the relationship between the dynamic properties of structures and environmental conditions (temperature and humidity) was thoroughly investigated in this work.

This paper’s content and methodology.
Target buildings and strong motion records
The building research institute (BRI) of Japan operates a strong motion network that covers buildings in major cities across Japan. Over many years, a large amount of strong motion data has been gathered in the observation stations that are part of the strong motion network. In this study, three super high-rise steel frame buildings, one super high-rise reinforced concrete building and two high-rise steel frame buildings were selected network. The three super high-rise structure buildings A, B, and D are all located in Tokyo, the super high-rise steel structure building C is located in Yokohama City, and the high-rise buildings E and F are located in Hokkaido and Aomori, respectively. Table 1 and Figure 2 detail their information. These buildings have experienced the 2011 Off the Pacific Coast of Tohoku, Japan Earthquake. The Mw9.0 Tohoku, Japan earthquake on March 11, 2011, which is officially named as the 2011 Off the Pacific Coast of Tohoku, Japan Earthquake 22 (hereafter, simply referred to as the Tohoku Earthquake) by Japan Meteorological Agency, could be the largest event in Japanese history.
Target buildings.

S: Steel; RC: Reinforced concrete; SRC: Steel-framed reinforced concrete; SI: with seismic isolation system; “21F”: 21 floors on the ground; “B4F”: 4 floors in the basement; Start: start date of recording.

Location of target buildings.
The goal of this study is to investigate the long-term changes in the dynamic characteristics of these target buildings. The gathered ground motion recordings were screened using the following principles: (1) Corrected records with complete time histories, with each record containing three components (two horizontal components and one vertical component) are used; (2) Records with epicentral distance of more than 500 km are not considered; (3) Records with PGA less than 0.5 cm/s2 are not selected. The statistical distribution of magnitude, epicentral distance, and PGA distribution of chosen strong motion records is depicted in Figure 3. Except for the target building F (HCN2), the target building B (CGC), around 90% of the strong motion records selected by the target buildings have a magnitude between 4.0 and 7.0, and approximately 10% of the records have a magnitude less than 4.0 and larger than 7.0. Strong motion records with an epicentral distance less than 100 km from C (YKH) account for around 60%, and strong motion records with an epicentral distance less than 100 km from the target structures D (TKD) and A (CG2) account for approximately 50%.
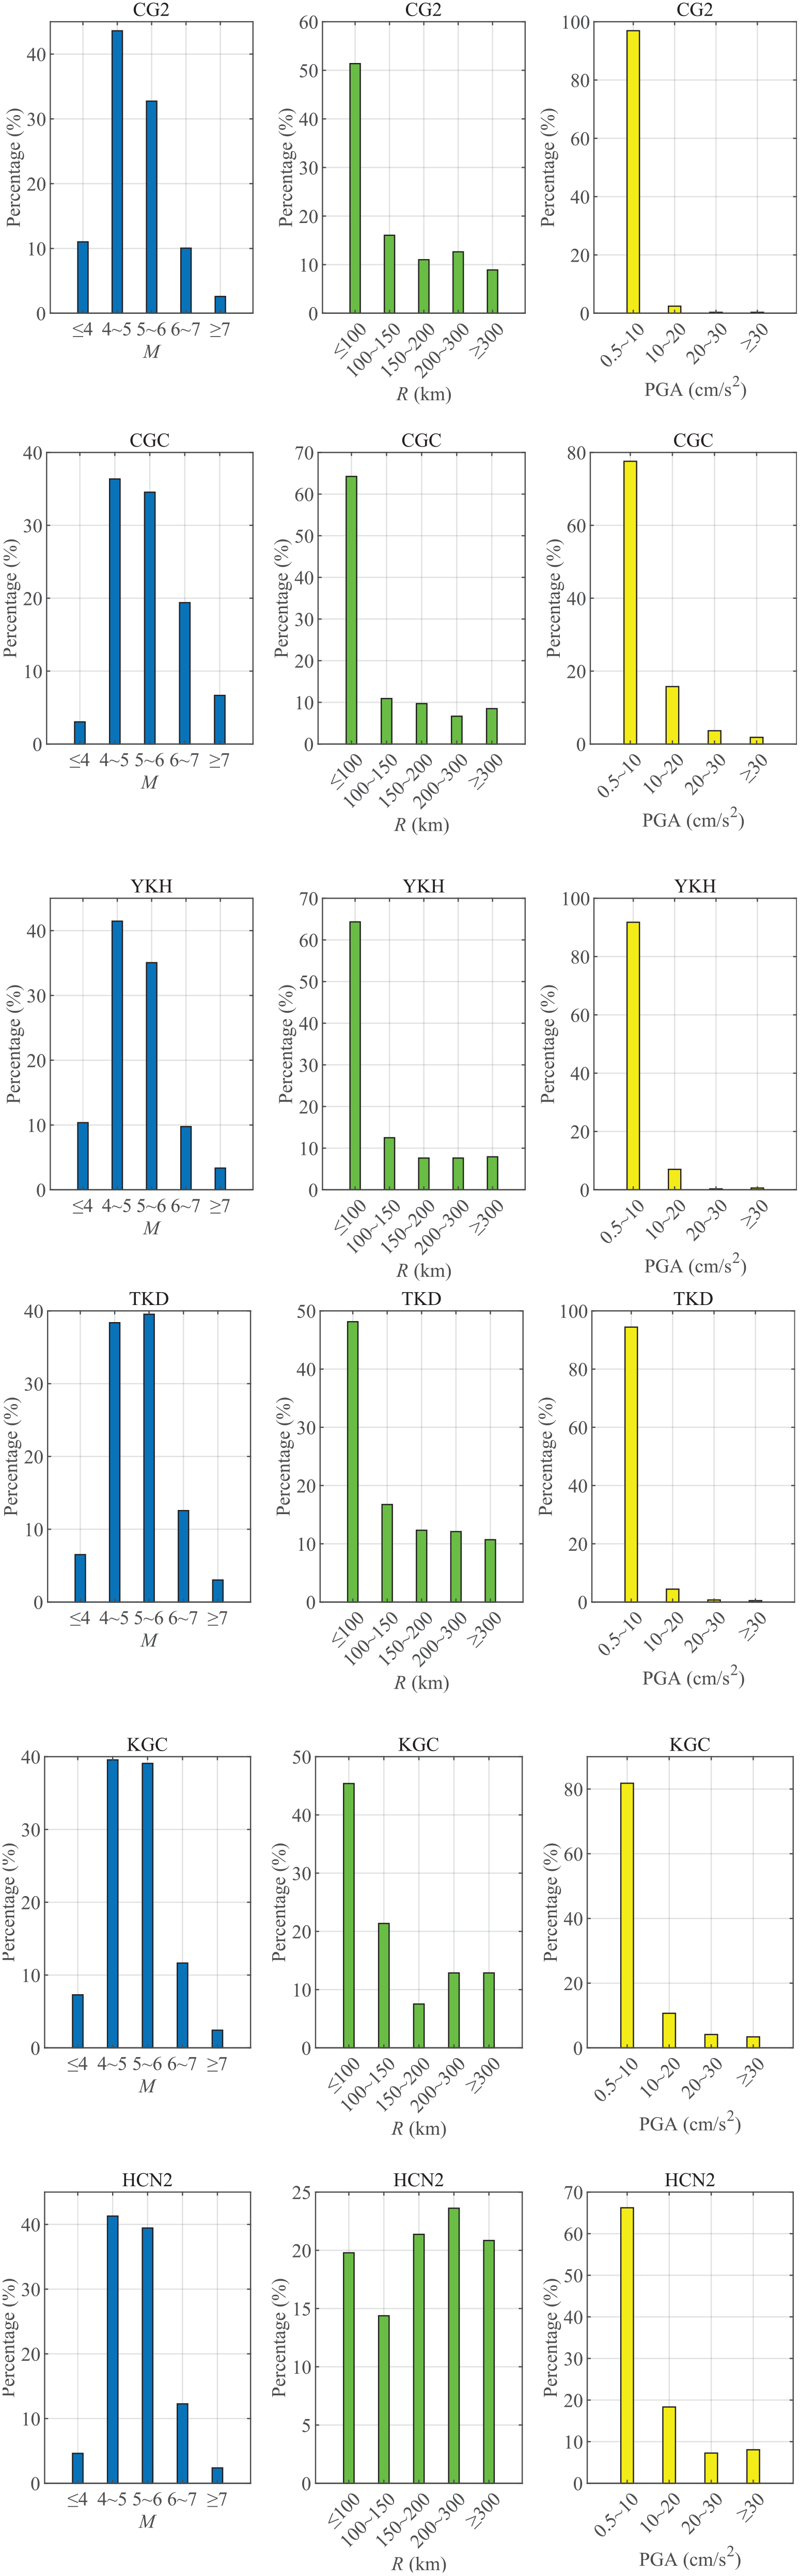
Histogram of magnitude, epicentral distance, and PGA.
To describe the two horizontal directions of the target building, X (longitudinal) and Y (transverse) are utilized here for simplicity. Table 2 displays the target structures’ maximum relative ground displacement (top displacement) and the drift angle (top displacement divided by total height) in the two horizontal directions. Because the displacements are all minor, it is reasonable to conclude that the structure is in elastic state. This study does not contain the near-field velocity pulse recording. At the same time, this study may include far-field long-period ground motions, but the resulting structure displacement is small, and the structure is in elastic state, so far-field long-period ground motions do not affect the modal parameter identification results of the target buildings. The distribution of magnitude-epicentral distance, as shown in Figure 4, demonstrates the phenomenon of large magnitude accompanied by large epicentral distance and small magnitude followed by small epicentral distance. The PGA of the selected ground motion records is more than 0.5 gal, and no velocity pulse phenomenon is observed in the near-field motion records.
Maximum relative displacement.


Distribution of magnitude and epicentral distance.
Modal parameter identification of structures
Structural modal parameter identification is the process of obtaining the natural frequency, damping ratio, and mode shape of the structure by using excitation, response, or only output data. 23 New design concepts, tightened performance criteria, and targets for cost-effectiveness have led to an increasing demand for modal identification. In a vibration assessment, control or retrofit project of an existing structure, modal identification is among the first few tasks to establish baseline dynamic properties. In structural health monitoring applications, modal properties are almost the default quantities of investigation and affect many decisions downstream. 24 Identification of dynamic characteristics of civil structures from response recorded during strong ground shaking has been a subject of research for more than three decades. In structural health monitoring, this process is time varying. Modal parameter identification is usually an indispensable part of structural dynamics research, and provides prerequisite information for a wide range of research fields such as dynamic response assessment, damage identification, vibration control, and optimal design of dynamic structures. 19 As mentioned above, this paper is based on the covariance-driven SSI to obtain the dynamic characteristics of the selected target building. This method starts with constructing the so-called Hankel matrix from the output data. Through projection operations, the Hankel matrix can be used to obtain the Toeplitz matrix. By performing singular value decomposition (SVD) on the Toeplitz matrix, the extended observable and controllable matrix of the system is obtained, and then the eigenvalue decomposition of the obtained system state matrix is performed to obtain the modal parameters. This method has strong noise resistance and can more accurately identify the dynamic characteristics of the structure. The steps of the SSI approach are clearly depicted in Figure 5. Figure 6 depicts the modal parameter identification results of the super high-rise steel frame structure A using data from the Tohoku earthquake as an example. The first-order frequency is approximately 0.5 Hz, and the second-order frequency is approximately 1.65 Hz. Similarly, the dynamic characteristics of the six selected buildings are identified using covariance-driven SSI method.

Steps of the covariance-driven SSI method.

Strong motion records and typical stabilization diagram.
It is well known that dynamic characteristics are important internal factors that influence structural response, and research into the relationship between dynamic characteristics and other variables is critical. The fundamental natural frequency and damping ratio of each target building have changed over time, as shown in Figure 7. The fundamental natural frequency and damping ratio are represented by the upper and lower blocks, respectively, in each building’s data graph. The red solid circle and the blue hollow triangle correspond to the two horizontal directions of each building, which are represented by X (longitudinal) and Y (transverse) respectively. The other green dashed line parallel to the vertical axis represents the Tohoku Earthquake (marked as 311). After the Tohoku Earthquake, the natural frequencies of the super high-rise structures A, B, C, and D decreased significantly, and the associated damping ratios increased to some extent. Especially for super high-rise target buildings A and D, the natural frequency drop is very obvious, and the natural frequency drop is permanent without recovery. No structural damage by the Tohoku Earthquake was reported for any of these buildings. Therefore, further investigation is necessary to discuss the cause of the change in natural frequency after the Tohoku Earthquake. This permanent frequency decline of the target building, as noted in the study by Celebi et al., 25 may be caused by soil nonlinearity rather than structural damage. The dynamic characteristics of high-rise buildings E and F in Hokkaido and Aomori prefectures did not decrease significantly. Of course, this may have something to do with their installation of seismic isolation systems. By the way, the response of a structure to earthquake shaking is affected by interactions between three linked systems: the structure, the foundation, and the soil underlying and surrounding the foundation. In spite of the fact that soil-structure interaction studies have been conducted as early as the 1930s the interaction is often ignored in analyses of building response. It is necessary to study the dynamic characteristics of these three systems, as well as the dynamic characteristics of the structural system they comprise. Their relationship and the law of change are not only useful for gaining a thorough understanding of the dynamic characteristics of the system, but they also provide useful information for seismic design of the building structure. This topic will be covered in greater depth in a subsequent paper in the series.

Long-term changes in the natural frequency and damping ratio of the target buildings.
Table 3 lists the average and standard deviation (STDEV) of the fundamental natural frequencies and damping ratios of the target buildings, as well as the corresponding coefficient of variation (CV). Taking the Tohoku Earthquake that occurred on March 11, 2011 as the dividing line, comparing the dynamic characteristics before (before 311) and after the Tohoku Earthquake, it was found that the target buildings A, B, C, and D have a greater degree of reduce. Here, “All” refers to the full period of long-term building monitoring, “Before” refers to the period prior to the Tohoku Earthquake, and “After” refers to the period following the Tohoku Earthquake. When compared to before the Tohoku Earthquake, the average value of the natural frequencies in the X direction for super high-rise structures A, B, C, and D has fallen by 17%, 5%, 4%, and 8%, respectively. The damping ratio corresponding to this grows at varying rates. Because of its greater spread, the rise tendency is simply a reference to its overall change trend. The average value of the fundamental natural frequency in the y direction has dropped by 14%, 8%, 6%, and 12%, respectively, compared with before the Tohoku Earthquake. There is essentially no noticeable difference between before and after the Tohoku Earthquake for high-rise structures E and F, regardless of the fundamental natural frequency in the X direction or the fundamental natural frequency in the Y direction. As confirmed by CV, the damping ratio is more dispersed than the fundamental natural frequency. Unlike the stiffness or mass matrix that can be modeled by basic mechanics, there is still no accepted method for modeling structural damping, 23 except for contributions from major discrete damping elements (such as dampers). Classical damping is conventionally assumed. Although we considered the type of structure when analyzing the seismic response of the building, and set the damping ratio of the structure to 5% or 3% based on experience or convention, there is no clear physical principle. From the results in Table 3, we can also see that if the error of the damping ratio obtained directly from experience is large, it is not accurate.
The fundamental natural frequency and damping ratio of the target buildings.

This hypothesis can be supported by observations. The decrease in frequency is always related to the increase in the corresponding damping ratio, because it can be clearly observed from Figure 8. The relationship between the natural frequencies and the corresponding damping ratios is shown in Figure 8, because in the target buildings with a significant decrease in frequency, the regular phenomenon is similar. Here, only four target buildings A, B, C, and D with a significant decrease in natural frequency are used for analysis. The change trend of Building C is not very obvious, but the overall trend is consistent.
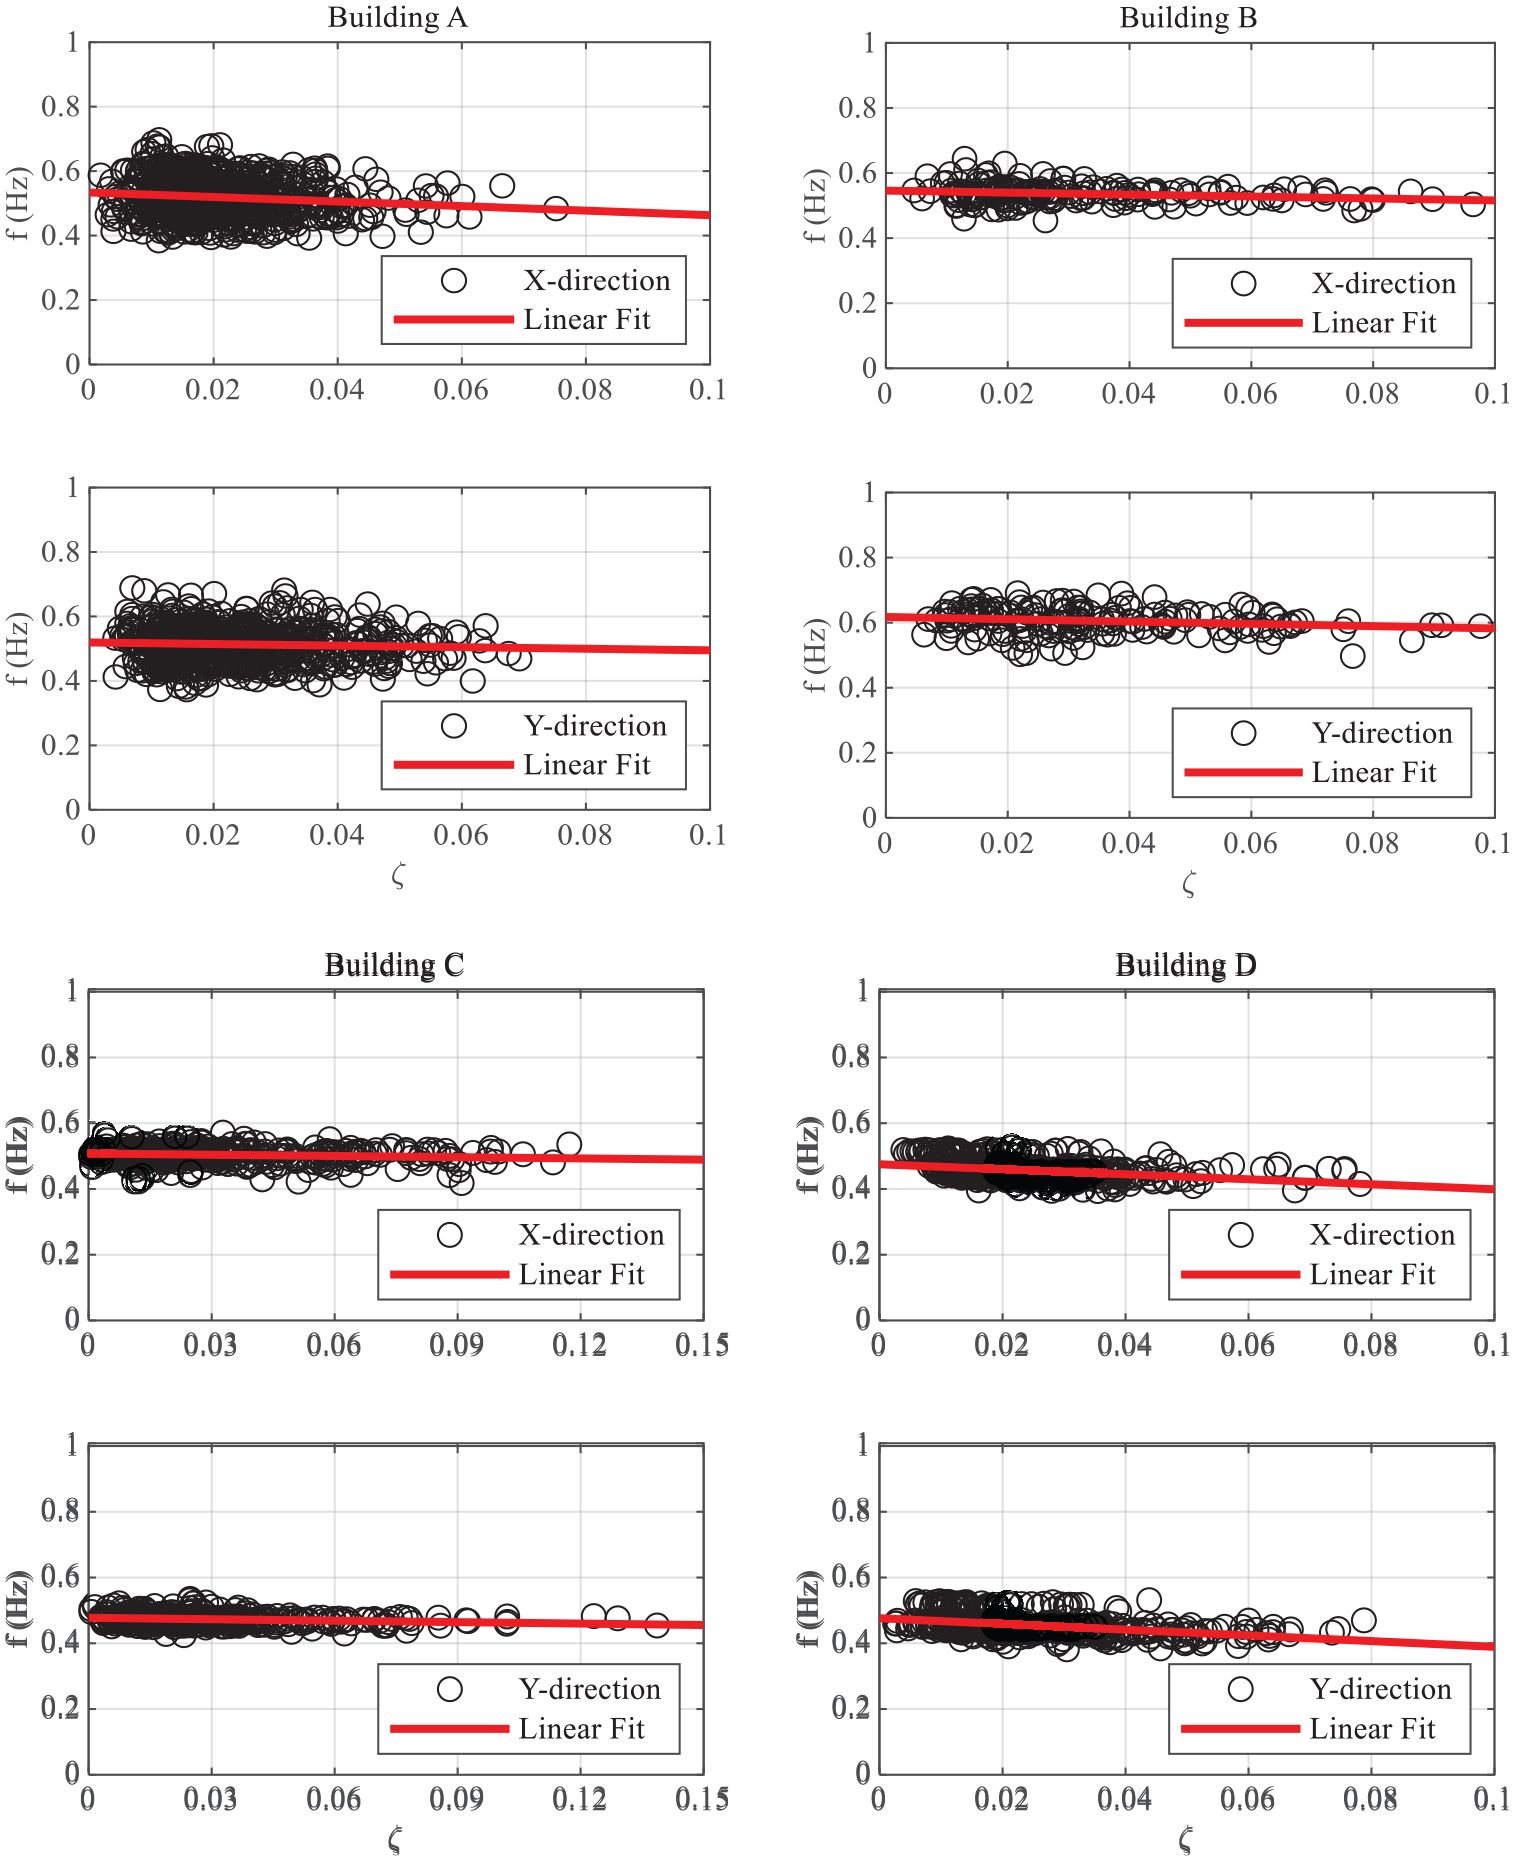
Correlation between frequencies and damping ratios.
The values of the relevant parameters of the target buildings A, B, C, and D are shown in Table 4. It can be seen that the natural frequency and the damping ratio are always negatively correlated, and the decrease of the natural frequency is always accompanied by the increase of the damping ratio. It can be seen from Table 4 that the decrease tendency in natural frequency of structures A and D is larger than that of structures B and C. Because the damping ratio is relatively small, the drop in natural frequency is minor, around 15%–20% of its initial value when the observation data was available.
Regression coefficient of natural frequency and damping ratio.

Correlation between dynamic characteristics and ground motion parameters and structural response
The influences of ground motion input parameters (focus depth, magnitude, epicentral distance, and PGA) and structural response amplitude on the dynamic characteristics of the target buildings are investigated in this section. Four super high-rise buildings (A, B, C, D) and two A high-rise structures (E and F) are studied in detail here. In order to better compare the similarities and differences of the dynamic characteristics of the target buildings before and after the Tohoku Earthquake, the data is divided into two portions, “Before” represents before the Tohoku earthquake, and “After” represents after the Tohoku earthquake.
From Figure 9, it can be seen that the natural frequencies of the four selected super high-rise buildings A, B, C, and D have no obvious correlation with the focal depth. The natural frequencies of the chosen two high-rise buildings E and F have no obvious relationship with the focal depth. However, when it comes to the influence of epicentral distance, the natural frequencies of target buildings B and C decrease to some amount as the epicentral distance grows, but the natural frequencies of other target buildings decrease only little. Different from the influence of focal depth and epicentral distance, the influence trend of magnitude is very clear, that is, the natural frequencies of all selected target buildings decrease significantly as the magnitude increases. Similarly, when the peak acceleration of ground motion increases, the natural frequencies of all structures drop. Consequently, for any of the target structures, there is no apparent connection between natural frequency and focus depth. For all target buildings, the natural frequency has a definite negative correlation with the magnitude and PGA, as well as a small negative relation with the epicentral distance.

Correlation between natural frequencies and ground motion inputs.
The relationship between the modal parameters and the root mean square (RMS) of the corresponding top-level acceleration records can be analyzed. In order to eliminate the contribution of the unrelated modes in this study, the acceleration records can be appropriately band-pass filtered. It can be observed that for super high-rise building B and high-rise buildings E and F, as the root mean square acceleration amplitude increases, the natural frequency decreases. The negative association between RMS and natural frequency supports the conclusions reached by Regni et al.
6
However, the natural frequency of the super high-rise building A is not so sensitive to the root mean square acceleration, which may have a certain relationship with the small acceleration peaks recorded by the building. At the same time, the correlation between the damping ratio and the root mean square acceleration is not so obvious.
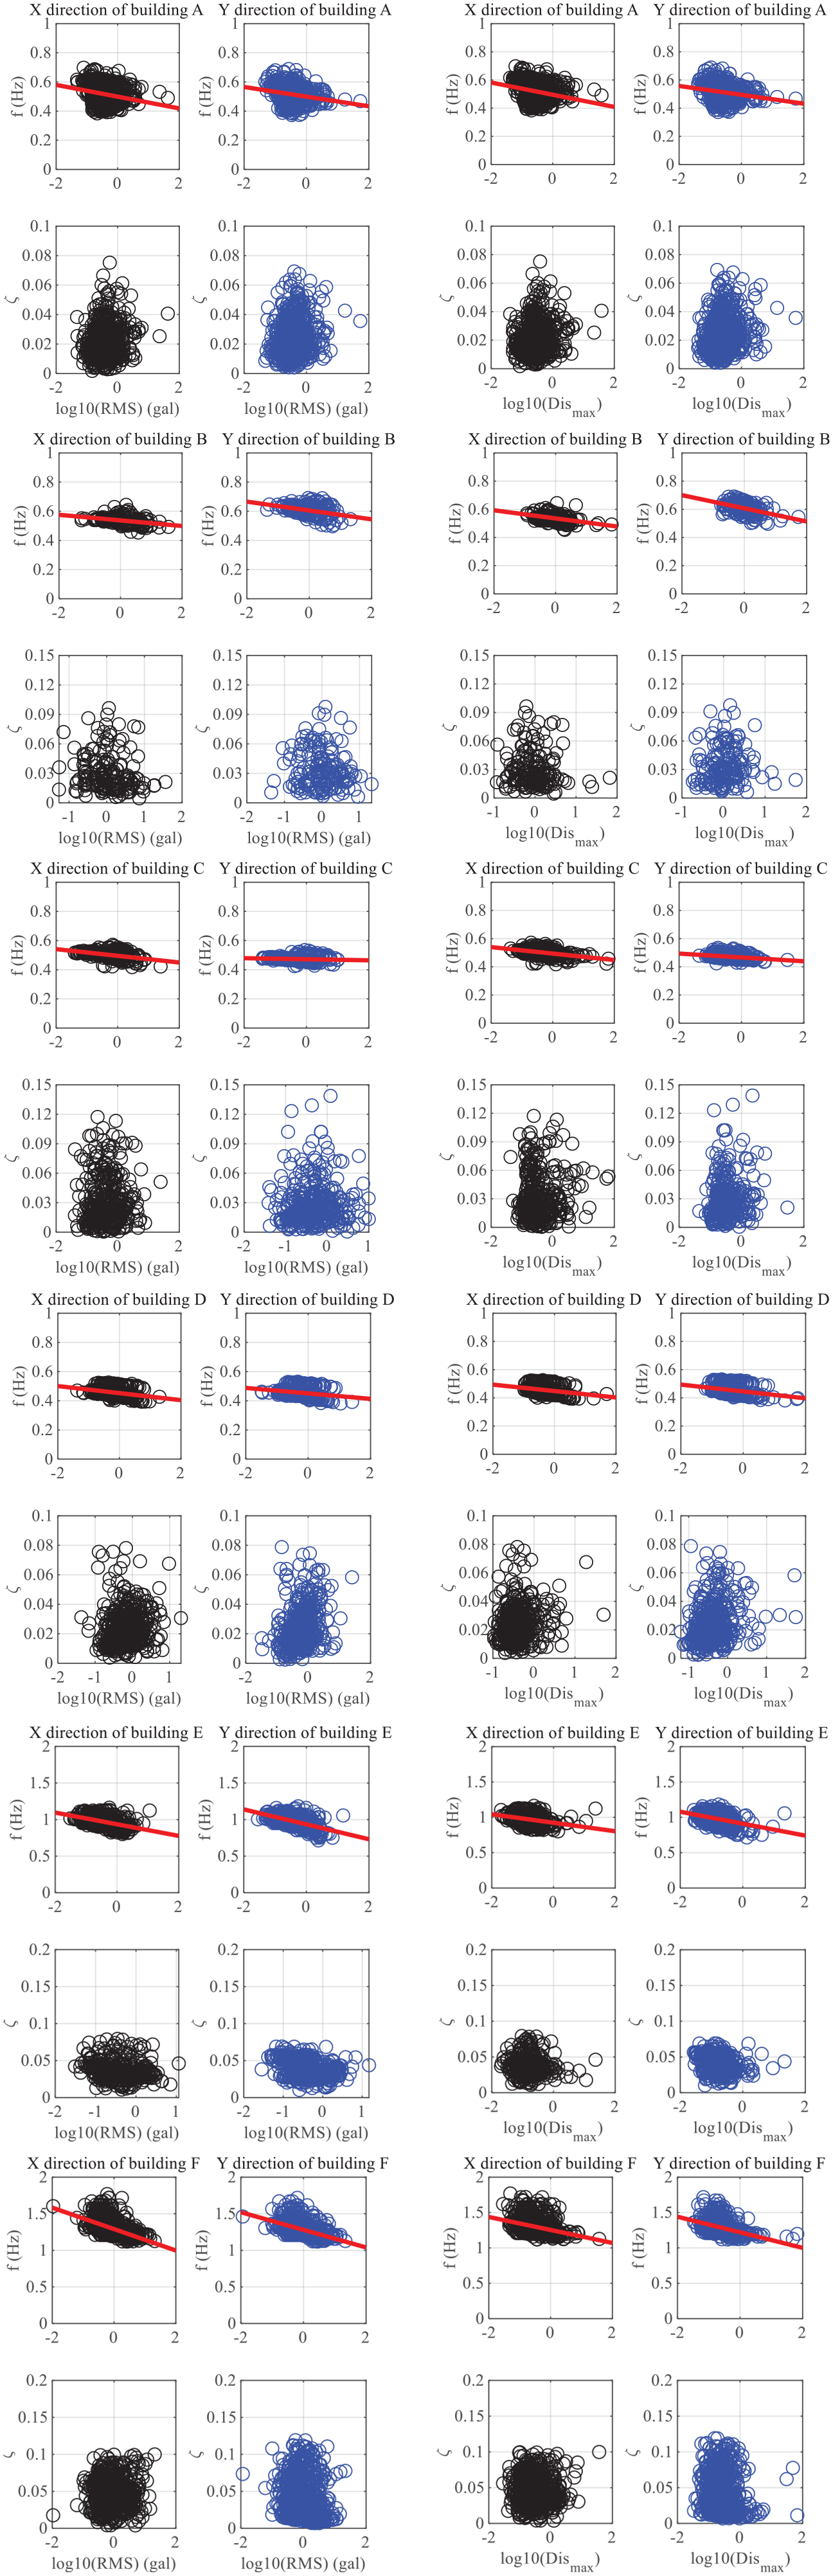
The relationship between dynamic characteristics and RMS and maximum displacement.
Regression coefficient of natural frequency and RMS and Dis max respectively.

Influence of environmental conditions on dynamic characteristics
In this section, we will study the change trend of the modal parameters (natural frequency and damping ratio) and analyze the effects of various environmental conditions using long-term strong motion record data from these selected target buildings. The first two environmental factors investigated in this study are temperature and air relative humidity. Temperature and air humidity have an obvious periodicity, as illustrated in Figure 11. In order to better find out the correlation between the dynamic characteristics and them, it is better to perform the Fourier transform of the identified dynamic characteristics.

The evolution of air temperature and relative humidity in the history of long-term years and identified natural frequencies.
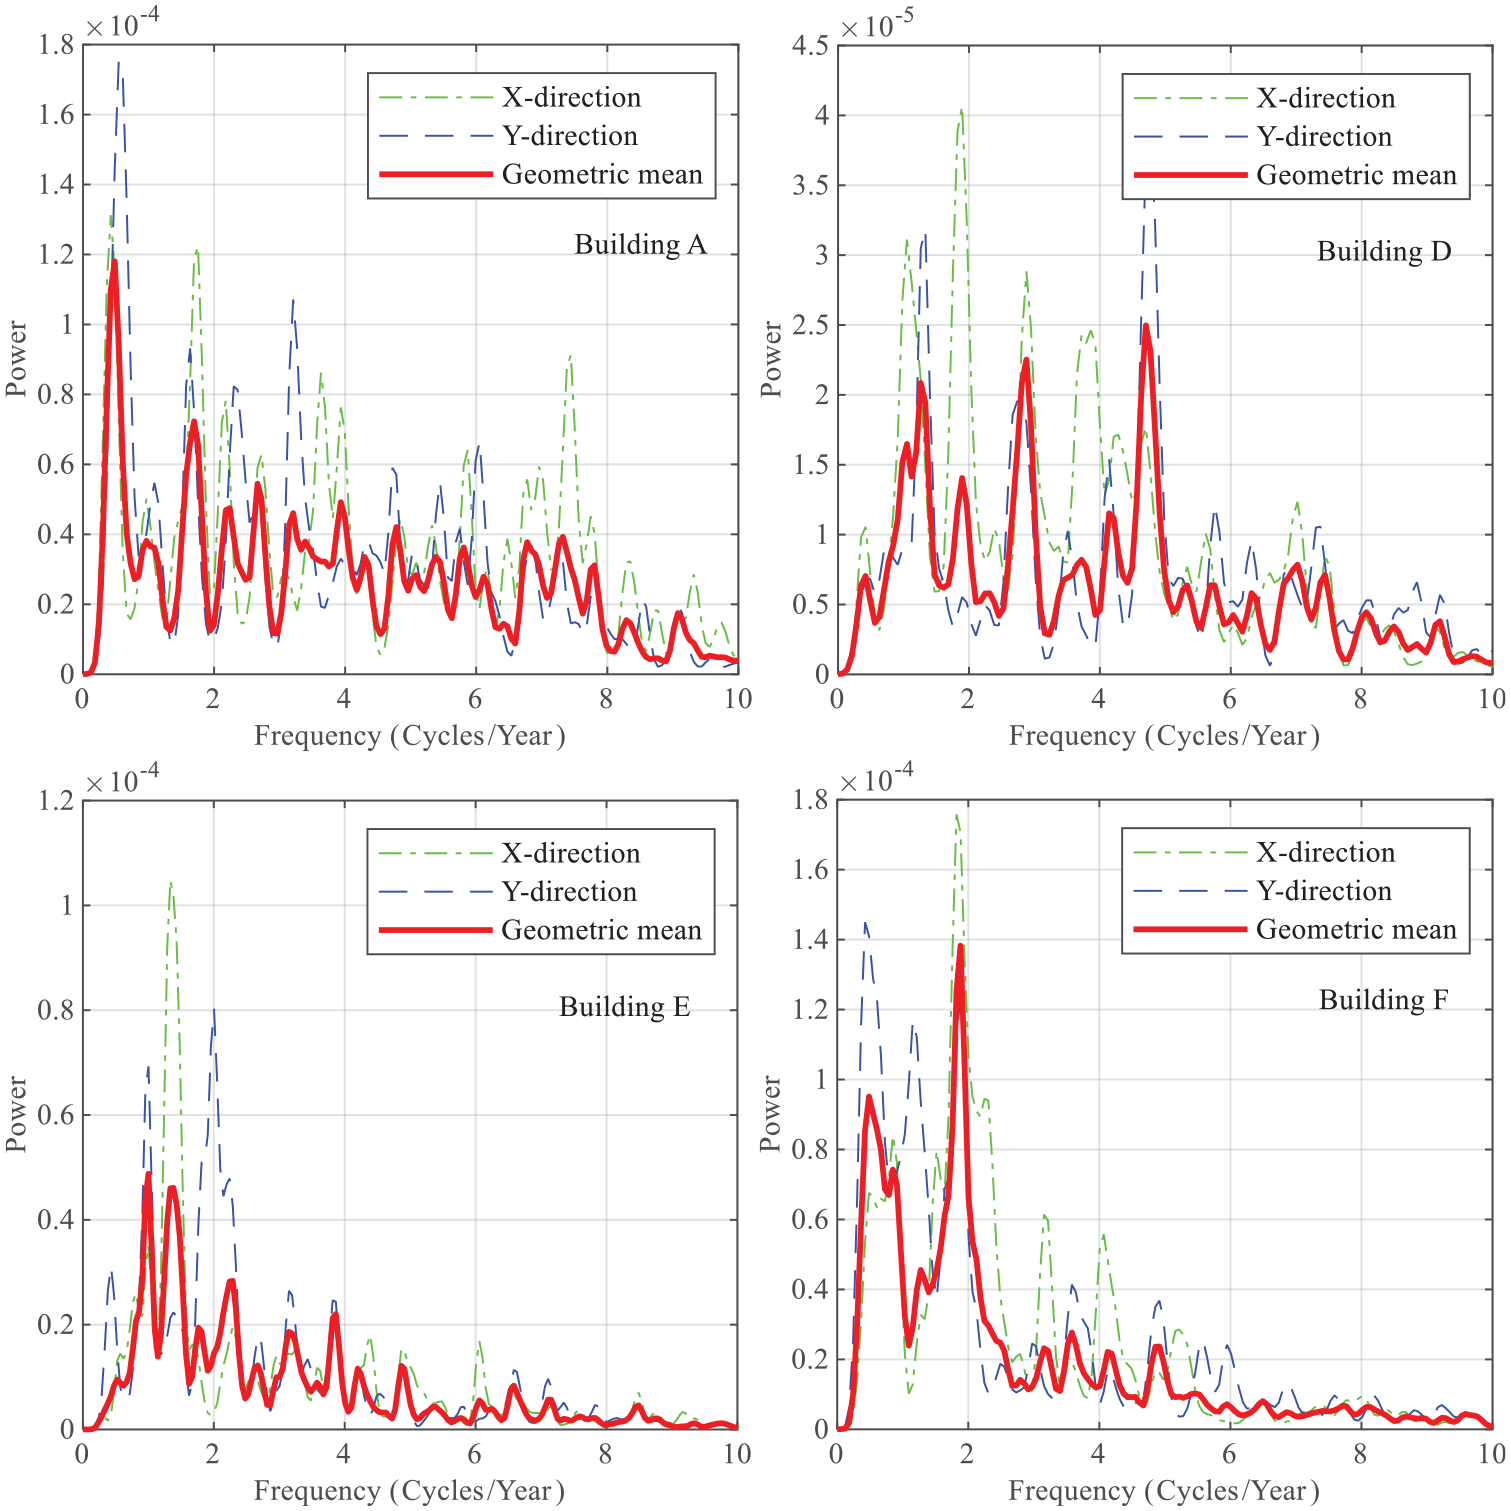
Similarly, the target buildings A, D, E, and F are used to discuss the influence of environmental conditions (temperature, relative humidity) on dynamic characteristics in greater depth. Using the year as the abscissa, Fourier transform the fundamental natural frequency obtained by identifying the modal parameters, then interpolate at equal intervals and determine its power spectrum. The power spectrum of the natural frequencies changing with time is shown in Figure 12. The frequency content of the two horizontal directions changing with time is basically the same. The change trends of the four target buildings in 2 years (0.5 cycle/year) and 1 year (1 cycle/year) are clearly presented, especially the target building F. The change frequency of temperature and relative humidity is exactly 1 year. Here, if the first peak point of the power spectrum of the target building A and F is taken, then the target building will be delayed by 1 year with the change of environmental conditions. Similarly, the Fourier transform of the damping ratio is used to calculate the power spectrum. Figure 13 clearly shows that the frequency change of the first peak point is exactly 2 years (0.5 cycles/year), which corresponds to the natural frequency. From the second peak point, the dynamic characteristics are consistent with the change cycle of environmental conditions, both of which are 1 year (1 cycle/year).

Power spectrum of natural frequencies.
Power spectrum of damping ratios.
More and more studies have shown that environmental conditions26,27 (temperature and humidity) will affect the dynamic characteristics of the structure. Unfortunately, because the modal parameter identification results of the damping ratio are more spread, and the damping ratio is affected by other factors have obvious effects, and the relationship with environmental factors is difficult to quantify, so this paper does not further discuss the quantitative relationship between damping ratio and temperature and humidity. Take environmental conditions as the abscissa to study the correlation between natural frequencies and environmental conditions. Similarly, “Before” represents the data obtained before the Tohoku Earthquake, and “After” represents the modal parameter identification result after the Tohoku Earthquake. According to Figure 14, it can be seen that the dynamic characteristics before and after the Tohoku Earthquake are consistent, and environmental conditions have different or even opposite effects on various. For example, as the temperature rises, the natural frequency of the target building E of the RC structure type rises slightly, but the natural frequencies of the buildings E and F of the SRC structure type have a downward trend. It can be seen from the analysis results that the influence trend of temperature and humidity on the dynamic characteristics is consistent, that is, if the relationship between temperature and natural frequency is positively correlated, then the influence of humidity is generally positively correlated. Table 6 shows the regression parameters based on linear regression analysis.
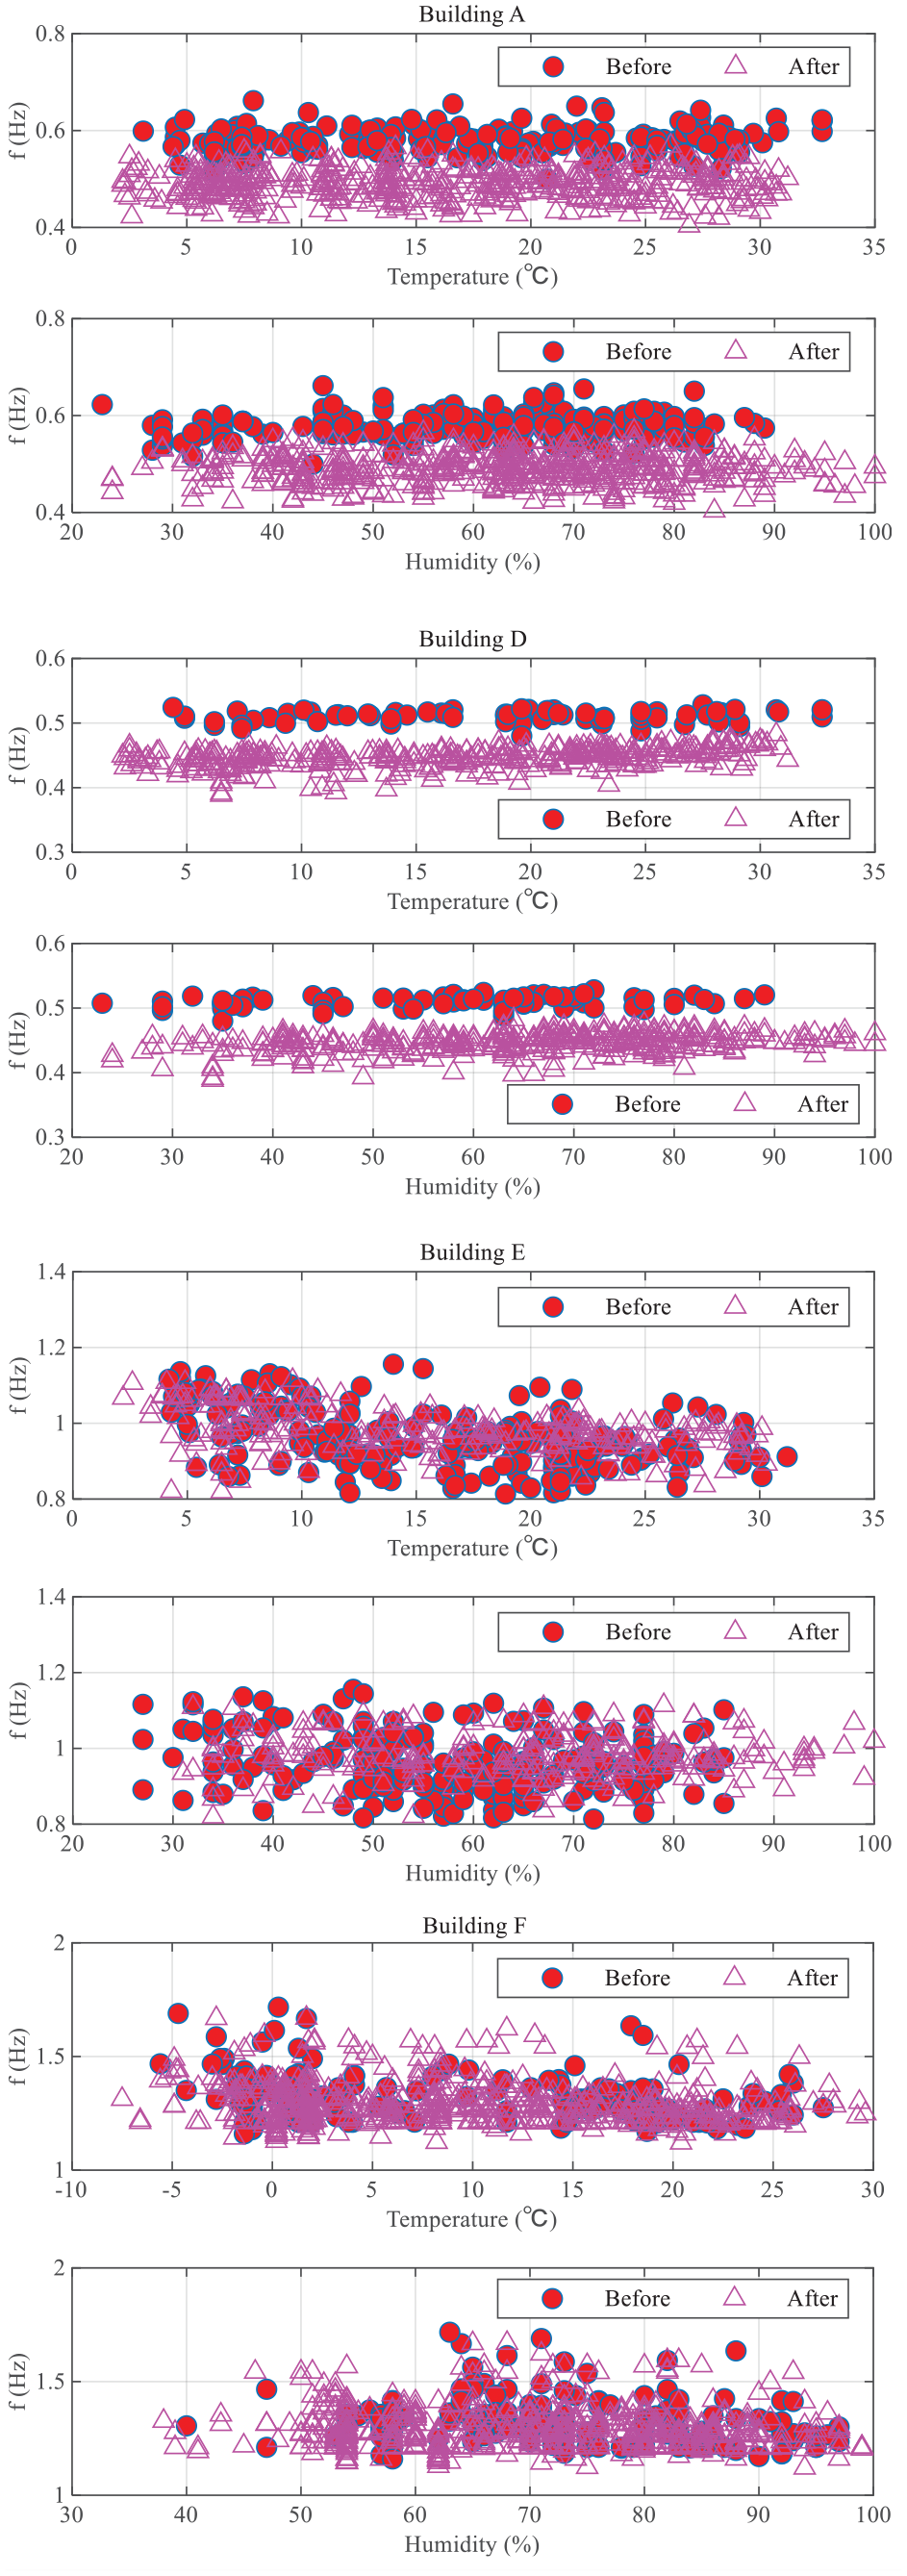
The relationship between natural frequency and environmental conditions.
Regression coefficient of natural frequency and environmental conditions.

Because of the long time span and obvious changes in the dynamic characteristics of the target buildings following the Tohoku Earthquake, the fitting results obtained solely by considering the influence of temperature or humidity are not as consistent, but it is certain through analysis that the trend of temperature and humidity exists, and the effect of different structures (such as structural form, height) exists. Furthermore, the analytical results suggest that temperature has a bigger influence on dynamic characteristics than humidity.
Conclusions
First and foremost, this study is concerned with the long-term changes in dynamic characteristics. In this section, the modal parameter identification approach is utilized to obtain the dynamic characteristics of six target buildings based on long-term strong motion records, and then the regularity of those characteristics is investigated; second, we studied the factors that influence dynamic properties and the relationship between dynamic characteristics of target buildings and these factors (ground motion parameters, structural response amplitude and environmental conditions, etc.). The following are the major findings of this study:
The natural frequencies of the four super high-rise buildings A, B, C, and D selected for this study all decreased to varied degrees after the Tohoku Earthquake and did not recover. The natural frequencies of the chosen high-rise structures E and F did not significantly decrease. The reason for this permanent decline has to be investigated further in future studies. Moreover, the decrease in natural frequency is always related to the increase in the corresponding damping ratio.
The identified natural frequencies have no obvious correlation with the focal depth, and have a slight negative correlation with the epicentral distance, but have an obvious negative correlation with the magnitude M and PGA. In other words, among the influence of ground motion parameters on dynamic characteristics, the influence of magnitude and PGA dominates.
Dynamic characteristics of all selected target buildings have obvious response dependence. When the response amplitude increases, the fundamental natural frequency decreases. Furthermore, the natural frequency is negatively associated with the RMS of the recorded response acceleration, according to the regression analysis results of this study. The regularity of the damping ratio varies according to the target building.
The dynamic characteristics of the target buildings A, D, E and F are clearly presented for 2 years (0.5 cycle/year). The change frequency of temperature and relative humidity is exactly 1 year. From the second peak point, the dynamic characteristics of the target building are consistent with the change cycle of environmental conditions, both of which are 1 year (1 cycle/year).
In terms of the influence of environmental conditions, the dynamic characteristics of the target buildings change trends before and after the Tohoku Earthquake are constant, and environmental conditions have distinct effects on buildings of different structural types, and may even be contradictory. As the temperature rises, the natural frequency of the target building E of the RC structure type increases slightly, but the natural frequencies of the buildings E and F of the SRC construction type decrease. Additionally, the effect of temperature and humidity on dynamic properties is consistent. Furthermore, the results of the analysis indicated that temperature has a stronger influence on dynamic characteristics than humidity.
Footnotes
Acknowledgements
Handling Editor: Chenhui Liang
Declaration of conflicting interests
The author(s) declared no potential conflicts of interest with respect to the research, authorship, and/or publication of this article.
Funding
The author(s) disclosed receipt of the following financial support for the research, authorship, and/or publication of this article: This work was supported by National Natural Science Foundation of China under Grant No. 10802104.