
Abstract
The vibration and sound signals get widely applications in fault diagnosis of rolling bearing systems, but the detection accuracy is unstable at different measuring positions. This paper puts forward a two-step vibration-sound signal fusion method, in which sound signal fusion and vibration-sound signal fusion are executed respectively. The sound signals are fused through weighting to the vibration signal to reduce the influence by measuring positions, and the phase difference is eliminated by a sliding window on the time axis. Then a second fusion between the vibration signal and sound signal is conducted after normalization and superposition, and the performance of two-step fusion is compared with the existing direct fusion. Results show that the two-step fusion provides a larger signal-to-noise ratio, and the amplitudes of characteristic frequencies are also higher. A cascaded bistable stochastic resonance system is applied in the post-processing of the fusion signal to make the signal features more clear, and it is proved that the fault detection effect has an obvious improvement after the whole process. This method provides a new approach for weak fault feature detection in vibration and sound signals, and is of great significance for the maintenance of rolling bearing systems.
Introduction
In recent years, the working conditions of rotary machines are becoming more and more complex, and the requirements for rolling bearings have increased significantly.1–3 The rolling bearings are widely used in extreme conditions of high speed, heavy load, and lack of lubrication, such as high speed machine tools, compressor, and turbine engine, where the running abilities are extremely important.4–6 Weak faults such as small spallings and minor cracks come from initial defects in materials, and usually grow to serious breakdown in a short time. The detection of weak faults is one of the main approach of detecting faults at the early degradation, and is of great significance for the prognosis and maintenance of related devices.7–10 Recently weak fault detection is mainly carried out through the analysis of status signals, such as vibration and sound.11–13 Ye and Yu 14 put forward a deep morphological network for feature learning from vibration signal, and applied the morphological layer in the extraction of impulses and filtering of noise. A new feature fusion method is proposed to enhance channels with strong impulsive features, and the residual is recalibrated for feature learning to make the feature selection more clear. Kumar et al. 15 developed a new approach of automatic identification of defects using symmetric single valued neutrosophic cross entropy, and the energy of modes was extracted as features and processed to form single valued neutrosophic sets. The minimum argument principle is used in testing samples in a more intelligent way, and the relative accuracy got greatly improved. Lu et al. 16 proposed an angular resampling sound analysis-based bearing fault diagnosis method, which segmented the sound signal for transient identification. The frequency smearing phenomenon was eliminated through angular resampling, which solved the problem in variable-speed motor bearing fault diagnosis.
Fault detection methods based on vibration or sound signals depend largely on the qualities of collected signals. Nowadays, most of the vibration signal collections are conducted by contact sensors due to the low cost and high reliability. However, the number and locations of the sensors are limited by the structure, and the fault characteristics gradually decayed in the transmission path. As a result, the weak faults can hardly be detected in complex structures, which is not conducive to the fault detection at the early stage.17–19 Compared with vibration signals, sound signals are less affected by the transmission paths, and reflect the running status more directly.20–22 However, background noise is one of the biggest interference factors in sound signals, and needs to be eliminated through targeted filtering. The vibration-sound fusion signal combines the advantages of vibration and sound signals, and contains more running status that is suitable for weak fault detection. Recently multi-information fusion methods are developed, and the combination of signals provides more information for the fault detection.23–25 Shi et al. 26 proposed a two-stage multi-sensor information fusion method including the fault feature fusion and the decision-making information fusion. Features from signals of multi sensors are extracted separately, and the statistical features are optimized and fused based on Dempster-Shafer evidence theory and convolution neural network for more effective fault detection. Ai et al. 27 developed a fusion information entropy method based on n-dimensional characteristic parameters distance. The singular spectrum entropy in time domain, power spectrum entropy in frequency domain, wavelet space characteristic spectrum entropy, and wavelet energy spectrum entropy were analyzed, and the fusion with vibration and sound emission signals was proved of higher accuracy. Lu et al. 28 put forward an adaptive stochastic resonance method based on sound-vibration fusion signal for fault diagnosis. The sound and vibration envelop signals were superimposed directly, and the features are enhanced through matching with a moving sliding window. The studies are valuable for weak fault detection research, but the feature difference in signals at different measuring positions are not taken into consideration, and further studies are therefore needed. This paper focused on a two-step fusion algorithm between vibration and sound signals with phase differences, and the algorithm is shown in Section 2. Section 3 gives the post-processing method of the fusion signal, and experimental analysis are conducted in Section 4. The signal processing is carried out step by step in Section 5, and the overall performance is discussed in Section 6. Finally conclusions are drawn in Section 7.
Vibration and sound signal fusion method
The vibration and sound are caused by the collisions and frictions between the bearing components, and the signals are collected by corresponding sensors. Here the sound signal is expressed as S[j], where j = 1, 2, … , Ns shows the measured values in the sound signal. The vibration signal is expressed as V[i], where i = 1, 2, … , Nv shows the measured values in the vibration signal. Here Ns and Nv show the sampling numbers of sound and vibration signals, respectively. Assuming that the sound sensors are placed close to the bearing, and sound radiation from other devices are ignored. Then the vibration signal and sound signal can be regarded to be radiated from the same source, and the correlation factor between the signals can be expressed as

where Vk and Sk show the vibration and sound signals collected by the kth sensor, respectively. Here the length of the vibration and sound signals are the same to get the correlation factor between the vibration and sound signals. To eliminate the phase difference between the vibration and sound signals, a sliding window Wk[j] is constructed on the time axis of the sound signal, which can be expressed as

As shown in equation (2), the length of sound signal is longer than that of the vibration signal. When the sampling frequencies of the vibration and sound signals are the same, the window can be adjusted to include the same time interval with the vibration signal. Then a preliminary fusion signal can be constructed as
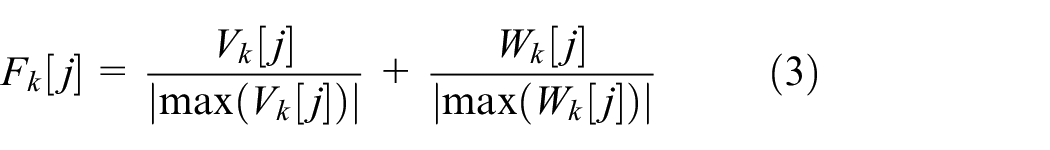
where max(Vk[j]) and max(Wk[j]) denote the maximum value in the signal fragment, so that the amplitudes of the signals can be modulated between −1 and 1 to avoid the influence of amplitude difference. An index is set to evaluate the fusion performance as

where RMS(Fk[j]) shows the root mean square of the signal Fk[j], and SM() represents the degree of smoothness of the input and output signals, which can be expressed as

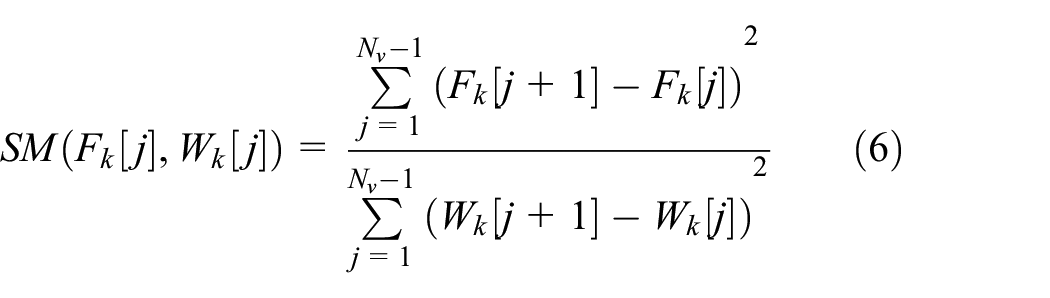
It can be inferred from equation (5) and (6) that both RMS and SM increase with the relationship between the signals, therefore the optimal fusion signal can be obtained through the sliding window as

When the sound signals are collected by multiple sensors, the vibration signal can be fused with each sound signal, and the number of fusion signals is equal to the number of sensors. To enhance the fault features contained in the sound signal, a signal fusion with weighting among the sound signals needs to be conducted, which can be shown as

where Ms shows the number of sensors in the sound array, and Ak(fr) shows the amplitude of the rotating frequency in the frequency-domain result of Fk[j]opt through Fast Fourier Transform (FFT). The weighting factors are added to the window functions, and it can be considered that the sound fusion signal contains the information in all the collectors. Then a second fusion is conducted to combine the information in vibration and sound signals. The fusion process is carried out in the same way as equation (2)–(7), and another sliding window W[m] is needed. The length of the vibration signal in the second fusion is cut into half of that in the first fusion, and the sliding window function can be expressed as

And the vibration-sound fusion signal can be obtained through

where FVS[m] is the second-order fusion signal, and can be expressed as

And RS[m] can be obtained through similar processes in equations (4)–(6).
Signal post-processing through cascaded bistable stochastic resonance system
The running status information is contained in the vibration and sound signals, and the characteristic gets enhanced through the signal fusion. However, there are still some interference frequency components in the fusion signal, which make it difficult to pick the weak fault feature. Stochastic resonance is one of the main methods in post-processing and noise reduction. 29 Here a cascaded bistable stochastic resonance (CBSR) system is applied in the signal post-processing. The movement of Brownian particle in CBSR system can be expressed as

where x(t) shows the trajectory of the Brownian particle, U(x) is the potential function, and n(t) is the noise signal, which can be expressed as

where <n(t)> shows the statistical average of n(t), D is the noise intensity, and δ(t) is the Dirac function. Here U(x) can be expressed as
where a and b are potential well parameters, and the maximum and minimum values can be adjusted through the parameters. The CBSR system is able to improve the processing performance by increasing the cascading times, as shown in Figure 1.

Principle of the CBSR system.
As shown in Figure 1, there are p BSR systems, and xp(t) is the output signal of the system Up(x), where p > 1 is a positive integer. The input for U1(x) contains FVS[m] and n(t), and the inputs for the left BSR systems are the outputs of the former BSR systems. The mathematical model for the CBSR systems can be described as

where ap and bp are the parameters of the BSR system Up(t). ap and bp have impact on the height of the potential barrier, and need to be optimized for each BSR system. Here the ant colony algorithm is used for the parameter optimization, and finally the weak fault characteristics in the fusion signal FVS[m] is processed through the CBSR system with parameter optimization on each BSR system. The signal-to ratio (SNR) is used to quantify the post-processing performance, which is expressed as

where fc is the characteristic frequency, and X(fc) and Y(fc) can be shown as

where A(fc) is the amplitude at frequency fc, and f1 and fn denote the frequency range of the FFT. The flowchart of the whole process is shown in Figure 2.

Flowchart of the whole process.
As shown in Figure 2, the whole process is made up of three steps: Sound fusion, vibration-sound fusion, and feature enhancement. First the fusion is carried out on the sound signals collected by the sound sensors, and then the information in the vibration and sound signals is combined through signal fusion between the vibration and sound signals. The feature enhancement is conducted on the vibration-sound fusion signal through the CBSR system at last. The weak fault feature is mainly enhanced through the two fusion steps, and the CBSR system act as a post-processing tool that makes the picked feature more clear.
Experiments and signal acquisition
The experiments are conducted on the bearing-rotor test rig to check the processing performance of two-step fusion and CBSR system. The test rig is shown in Figure 3, and the structural parameters of the bearing is given in Table 1.
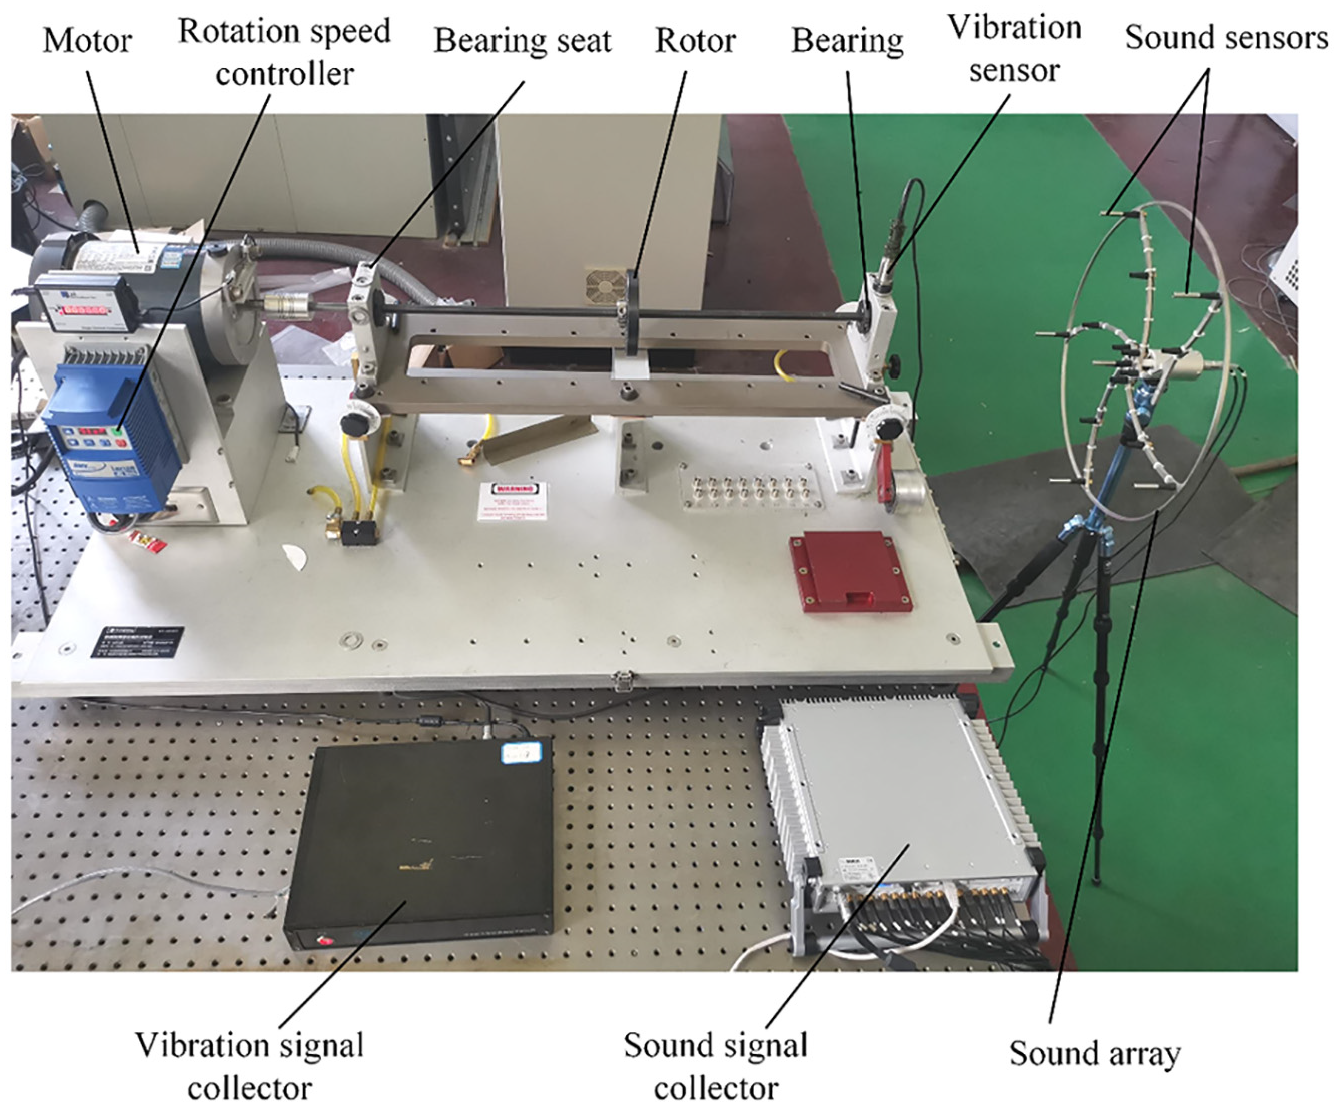
Bearing-rotor test rig.
Information of the bearing.

As shown in Figure 3, the bearing-rotor system is driven by the motor, and the motor speed can be adjusted manually by the rotation speed controller. The inner ring runs with the shaft, and the outer ring is fixed in the bearing seat. The vibration sensor is placed on the bearing seat, and the sound sensors are arranged on an array perpendicular to the shaft. The vibration and sound signals are collected by the corresponding collectors, as shown in Figure 4.

(a) Vibration signal collector. (b) Sound signal collector.
Here the rotation speed of the rotor is set as 4800 r/min, and the radial load is 100 N. There are six sensors on the sound array, with one at the center and the other five evenly distributed on a circle. The ambient noise is below 40 dB during the experiment. The diameter of the circle is 460 mm, as shown in Figure 5.

The distribution of the sound sensors.
As shown in Figure 5, the sensor at the center is marked as point 1, and the rest sensors are marked from 2 to 6 in a clockwise order. The center of the sound array is on the axis of the shaft, and the axial distance between the sound array and the bearing is 400 mm. The sampling rates of the vibration and sound sensors are set as 16,384 Hz, the length of the vibration signal Nv is 81,920, and the length Ns is 163,840. Two cases with minor faults on the outer race and the inner race are studied, and the time domain vibration signals are shown in Figure 6. The widths of the faults are 2 mm, and the depths are also 2 mm.

Vibration speed with (a) outer race fault and (b) inner race fault.
To get the information contained in the signal, the time domain signal needs to be transformed into the frequency domain through FFT. Then the frequency domain signals are shown in Figure 7, and the SNRs are calculated through equations (16) and (17).

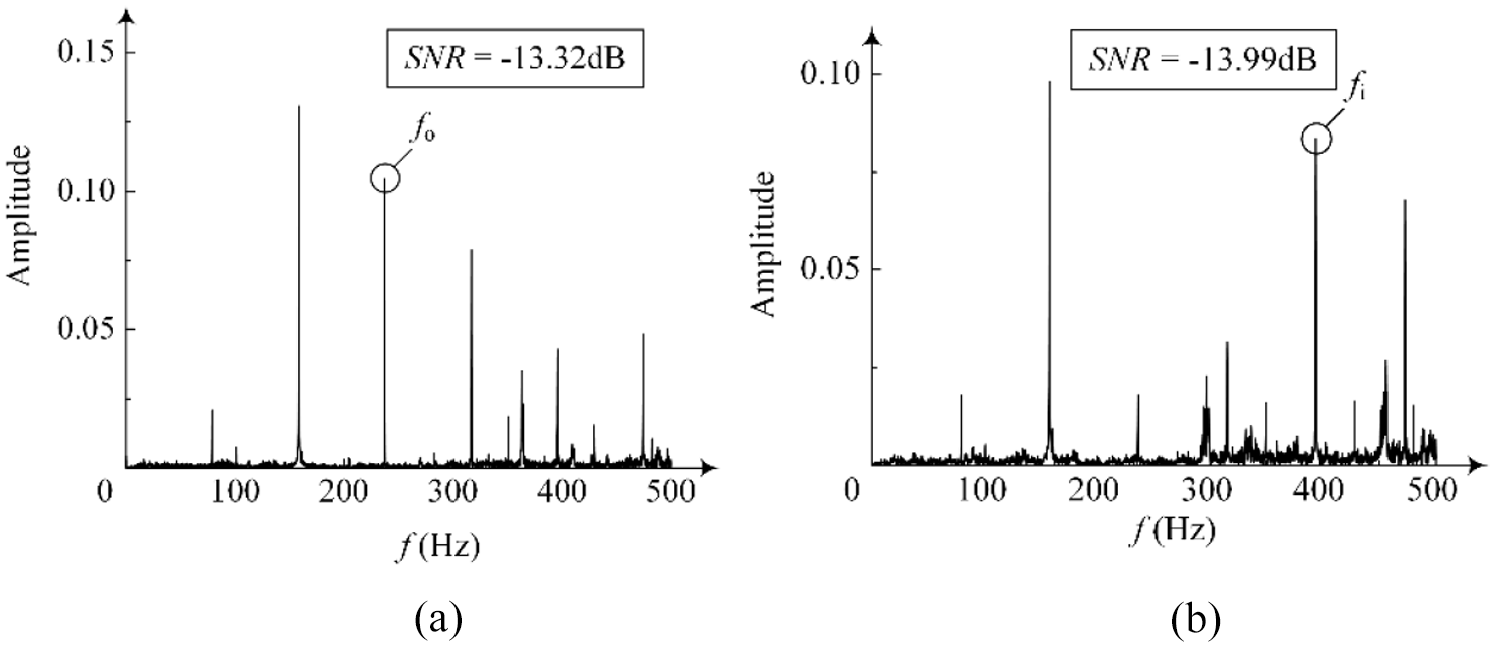
Frequency domain of the vibration signals with (a) outer race fault and (b) inner race fault.
In Figure 7, fr is the rotating frequency, fo is the outer ring fault frequency, and fi is the inner ring fault frequency. It can be seen that there are peaks at the fault frequencies, but the amplitudes of the fault frequencies are not obvious compared with the harmonic frequencies of fr. As a result, it is hard to detect the weak faults only through vibration signals. The sound signals with faults on the outer race and inner race in frequency domain are shown in Figures 8 and 9.

Sound signal with outer race fault in frequency domain at: (a) point 1, (b) point 2, (c) point 3, (d) point 4, (e) point 5, and (f) point 6.

Sound signal with inner race fault in frequency domain at: (a) point 1, (b) point 2, (c) point 3, (d) point 4, (e) point 5, and (f) point 6.
The fault frequencies fo and fi can be seen clearly in the corresponding frequency results in Figures 8 and 9, and the SNRs are higher in sound signals compared with the results in Figure 7, indicating that the sound signals are more effective for weak faults detection. However, the amplitudes of the fault frequencies vary with the sensor location, and are lower than those of the frequency components related with fr, which is particularly evident in Figure 8. Then it can be inferred that the weak fault detection is insufficient through single vibration or sound signal since the corresponding amplitudes are not obvious enough, and a signal fusion is needed for the extraction of the common features buried in the vibration and sound signals.
Signal processing
Sound signal fusion process
As stated above, the length of the sound signal is longer than that of the vibration signal, and the sliding window is set on the time axis of the sound signal to find the optimal Wk[j]. Here k = 1, 2, 3, 4, 5, 6, and a sound fusion signal is obtained based on the collected signals, as shown in Figure 10.

Sound signal fusion process.
As shown in Figure 10, the vibration signal eliminates the phase difference by finding the maximum RSk. The lengths of the original sound signals are 10 s, and become 5 s after fusion, which is the same as the length of the vibration signal. The sound fusion signals with outer race fault and inner race fault are shown in Figure 11.

Sound fusion signal with: (a) outer race fault in time domain, (b) inner race fault in time domain, (c) outer race fault in frequency domain, and (d) inner race fault in frequency domain.
It can be seen from Figure 11 that compared with the results in Figure 8, the SNR of the sound fusion signal with outer race fault has a remarkable increase, and the SNR of the sound fusion signal with inner race fault also grows compared with the results in Figure 9. The information in the sound signals is combined through phase difference elimination and signal weighting, and peaks at the characteristic frequencies become more obvious. The weak fault features in the sound signals can be enhanced through the preliminary fusion, but there are other frequency components in the signal, so a second fusion is needed.
Vibration-sound signal fusion process
The length of the vibration signal is changed from 5 to 2.5 s after the sound signal fusion, then a 2.5 s sliding window is set on the time axis of the fused sound signal. Here the signal with outer race fault is taken as an example, and the vibration-sound signal fusion process is shown in Figure 12.

Vibration-sound signal fusion process.
As shown in Figure 12, the vibration-sound fusion process is similar with the sound signal fusion process, and finally the length of the fusion signal is 2.5 s. The fusion performance for outer race fault and inner race fault are given in Figure 13.

Fusion performance for: (a) outer race fault in time domain, (b) inner race fault in time domain, (c) outer race fault in frequency domain, and (d) inner race fault in frequency domain.
Compared with the results in Figure 11, the peaks at the feature frequencies increase significantly, and the amplitudes of the characteristic frequencies grow higher than the harmonic frequencies of fr. It is shown that the fault features are more obvious after the vibration-sound signal fusion. Great improvements also occur on SNR, which makes it easier for weak fault detection. However, there are still some other frequency components, whose amplitudes also get enhanced through the vibration-sound signal fusion. More filtering processes are needed to make the frequency domain result more clear, and at the same time further improve the SNR.
Signal processing through CBSR system
Here the CBSR system is applied in the post-processing, and p is set as 3 to reduce the calculation time and ensure the processing performance. For the case with outer race fault, the optimized parameters of the CBSR system through ant colony algorithm are a = 0.75, b = 0.72. For the case with inner race fault, the optimized parameters are a = 0.85, b = 0.52. Then the final output signals through the CBSR system with the outer race fault and inner race fault are shown in Figure 14. As shown in Figure 14, the output signals through CBSR system become more clear, and the amplitudes of the characteristic frequencies become the highest in the corresponding frequency domain results. Then it can be inferred that the CBSR system acts as the filter in the whole process, and the weak fault detection is easier realized through the CBSR system.

Output signals through CBSR system with: (a) outer race fault in time domain, (b) inner race fault in time domain, (c) outer race fault in frequency domain, and (d) inner race fault in frequency.
Performance comparison
Comparison between the two-step fusion and the direct fusion
In order to check the fusion performance of the proposed method, a comparison between the proposed method with an existing fusion method 28 is conducted here. The fusion method in Lu et al. 28 combines the vibration and sound signals directly. The sound signal collected at point 1 is taken as the sound signal in calculation, and the fusion results in frequency domain are shown in Figure 15.
Performance with direct fusion of vibration and sound signals with: (a) outer race fault and (b) inner race fault.
Compared with the results in Figure 13, the fault information contained in the sound signals are not well extracted, and the feature frequency components are also not obvious in the single sound signal. Therefore, the SNRs of direct fusion of vibration and sound signals are much lower, and the amplitudes of the characteristic frequencies are also not obvious. It can be inferred that the proposed two-step fusion method have better performance in enhancing the fault features, which is more suitable for weak fault detection.
Comparison between the CBSR and second-order bistable SR system
Here the two-step fusion signal in Figure 13 is processed through an overdamped bistable SR system given in Zhao et al., 30 and the processing performance is compared with the CBSR system, as shown in Figure 16.

Performance with direct fusion of vibration and sound signals with: (a) outer race fault and (b) inner race fault.
It can be seen from Figure 16 that the peak frequencies at fo and fi can be detected clearly from the frequency domain results of the processed signals, which indicates that the overdamped bistable SR method is also effective in the signal denoising. However, the SNRs are lower than those in Figure 14, and it is implied that the processing performance of the cascaded bistable SR method is better than the overdamped bistable SR method. The processing performance is related with processing times, and the CBSR system has the advantage of multiple processing times in series. As a result, the CBSR system is more suitable for weak fault detection, and is therefore more preferred in the proposed method.
Discussion
The whole signal processing is made up of three stages: Sound signal fusion, vibration-sound signal fusion, and CBSR system. The change of SNR in different signals are given in Figure 17.

Change of SNR in different signals.
As shown in Figure 17, the SNR gradually rises through the signal processing, indicating better weak fault detection performances. The original vibration and sound signals are usually interfered by factors such as background noise and sensor locations, and it can be seen from Figures 7 and 8 that neither original signal is suitable for weak fault detection. So a sound fusion is essential to extract the status information. The SNR of the original sound signal with outer race fault varies from −29.09 to −25.31 dB, and comes to −13.86 dB after fusion. The SNR of the original sound signal with inner race fault varies from −16.62 to −13.23 dB, and comes to −10.36 dB after fusion. The SNR gets improved with more sensors, but the SNR with two faults are close after sound signal fusion, indicating that the performance of sound signal fusion has an upper limit due to the single source. Then the vibration-sound signal fusion is carried out to combine the features in vibration and sound signals. It can be seen from Figures 11 and 13 that the amplitudes of the corresponding frequencies have remarkable increases after the vibration-sound signal fusion, which makes it easier to detect the weak faults through frequency results. The SNR comes to −5.76 dB for outer race fault, and −6.72 dB for inner race fault, which indicates that the improvement through vibration-sound fusion is not related with the original SNR. There are still some clutter frequencies after sound signal fusion and vibration-sound fusion, and the fusion signal needs to be processed. Compared with the signals in Figure 13, the signals in Figure 14 are more clear, and the amplitudes of fault frequencies and rotating frequency-related components are further enhanced. The SNR with outer race fault becomes −4.26 dB, and the SNR with inner race fault becomes −4.90 dB, the trends are in consistent with those of the vibration-sound fusion signals. The performance of CBSR method is compared with the overdamped bistable SR method, and it is proved that the CBSR system is more suitable for extraction of weak fault features. It can also be inferred that the processing performance will get better as the number of BSR systems increases.
Conclusion
This paper puts forward a weak fault detection method based on the processing of vibration and sound signals, and the CBSR system is applied in the signal post-processing. Sliding window functions are set to eliminate the phase difference in two steps, and the SNR gets further improved after the two fusion steps. A direct fusion of vibration and sound signals is conducted for comparison of fusion performance, and it is proved that the two-step signal fusion has better performance in weak fault detection. The processing performance of CBSR system is also compared with another existing method, and the fault feature extraction performance is proved to increase with processing times. After the processing of the proposed method, the amplitudes of main frequency components get enhanced obviously, and the weak fault features can be detected easily in frequency results. The process greatly improves the efficiency and accuracy of the weak fault detection, and provides significance for the maintenance and diagnosis of related equipment.
Footnotes
Handling Editor: Chenhui Liang
Declaration of conflicting interests
The author(s) declared no potential conflicts of interest with respect to the research, authorship, and/or publication of this article.
Funding
The author(s) disclosed receipt of the following financial support for the research, authorship, and/or publication of this article: This research was funded by the Korea-China Young Researchers Exchange Program (2020), the Science Foundation of Shenyang University of Chemical Technology (No. LQ2020020), Natural Science Foundation of Liaoning Province (No. 2021-MS-259).
Data availability statement
The data that support the findings of this study are available upon reasonable request from the authors.