
Abstract
The tractor-trailer-train at the braking process prone to braking instability caused by asynchronous braking between the shafts. With respect to the lack of intelligent detection of Braking Time Sequence (BTS), a non-contact dynamic detection scheme of intelligent vehicle BTS is proposed. Based on the monocular vision principle, the edge markers of tractor-trailer train tires are identified, and the tire slip rate is solved. The noise reduction of the collected image is processed. The marker area is obtained by Blob analysis. This region at the image to be matched is identified by the template matching algorithm based on contour. The camera is calibrated by Zhang’s calibration method. In order to verify the effectiveness of the detection scheme, the real vehicle test was carried out. The test results show that the error of slip rate solution is below 4.2%.
Keywords
Introduction
Tractor-trailer-trains occupies an important position in the transportation industry because of its high fuel economy and convenient. Although tractor-trailer-trains have high transport efficiency and adapt to the current logistics development requirements, they also have many inevitable shortcomings. Since tractor-trailer-trains are composed of tractor and one or more trailers, the dynamic performance of the vehicle becomes complex and the handling stability becomes poor. Improving the handling stability of tractor-trailer-train has also become the focus of scholars’ research. In the braking process of tractor-trailer-train, if the front axle braking is prior to the rear axle, it is prone to folding accidents. If the front axle braking lags behind the rear axle, it is prone to dragging. Therefore, the inter-axle braking sequence affects the braking stability of the vehicle. At present, the test methods of vehicle braking performance mainly include bench test and road test. With the help of portable braking performance tester, the road test method can detect the braking distance, the fully emitted average deceleration and the braking deviation. The bench test method mainly relies on the drum reaction brake test bench and the flat plate brake test bench for testing, which can detect the braking force and braking imbalance and block force, and meet the detection of most vehicles. However, the above two test methods can not realize the detection of the BTS of the vehicle, which is difficult to reflect the braking performance of the vehicle. Therefore, it is particularly important to detect the BTS to determine whether it is necessary to adjust and maintain the braking system.
In order to improve the braking stability of the tractor-trailer-train, He and Jing 1 designed a new pneumatic braking system, and proposed a strategy to control the difference between the actual braking torque and the target braking torque of the semi-trailer. The simulation results show that the improved scheme reduces the braking response time and improves the braking stability of the vehicle. Elhemly and Fayed 2 established a Simulink model to study the BTS under different driving conditions. The model verified by experiments was used to predict the braking stability of tractor-trailer trains under different combinations of tractors and trailers. Castillo Aguilar et al. 3 developed an extended Kalman filter slip rate estimation algorithm based on tire force and vehicle speed. The scheme obtains the real-time torque of the tire by six-component wheel force sensor, and obtains the best slip rate with GPS system. Although the detection results are accurate, the hardware installation is complex, and the method is not suitable for multi-axle tractor-trailer trains. Goodarzi et al. 4 analyzed the braking process of tractor-trailer train, and proposed a scheme for braking force distribution by controlling the slip rate of tires on both sides of the coaxial line. This scheme improved the braking stability of tractor-trailer train. Wang et al. 5 conducted experimental analysis on the braking hysteresis characteristics of the pneumatic braking system of the multi-axle tractor-trailer trains, but the test can only qualitatively explain the factors affecting the braking hysteresis, cannot be quickly and accurately measured for specific models. Xie et al. 6 optimizes the braking force distribution coefficient of the tractor-trailer train and the hanging workshop by establishing the dynamic model of the tractor-trailer-train, so that the tractor-trailer-train brakes according to the best BTS and ensures the good braking performance of the vehicles.
For the detection of the BTS, Zhuang and Wu 7 used infrared photoelectric sensors to scan a disc with 36 sector-shaped grooves, and obtained pulse signals by cutting infrared light from the disc. This method has low accuracy and too complicated equipment installation to meet the current requirements of automated vehicle detection. Ling 8 detects the braking pressure of each brake by the accelerometer installed on the brake push rod of the vehicle, so as to obtain the BTS of each axle. However, this method belongs to static detection and cannot obtain the BTS under actual braking. Xiao 9 developed a detection system for the flatbed brake test sets of tractor-trailer train, due to the limitation of the space layout of the detection system. This method is not suitable for different types of tractor-trailer-train.
As a non-contact detection method, visual detection has been widely used in vehicle detection field because of its high detection accuracy and easy arrangement of detection system. Furferi et al. 10 designed a set of wheel angle detection system based on three-dimensional machine vision technology. The accuracy of the system in measuring the front beam angle and camber angle meets the requirements. Shan et al. 11 used stereo vision technology to realize the dynamic detection of vehicle axle distance, and analyzes the error caused by vehicle curve driving, and compensates the detection results. Liu et al. 12 based on machine vision technology, established a real-time detection system of vehicle running angle. By comparing and analyzing the system data and test results, it is proved that the method is reliable in monitoring the change of track vehicle posture. Creager et al. 13 used DIC system to observe the force difference between wheel push-pull movement and traditional rolling in sandy soil. Through comparative tests, it was found that push-pull movement increased the driving force of the vehicle than the traditional rolling method, and also reduced the resistance that the wheel needed to overcome. Due to the high price of vehicle sideslip angle sensor device, it is only suitable for vehicle development and performance evaluation. Based on DIC system, Johnson et al. 14 improved the existing algorithm, and used cheap cameras to accurately measure the vehicle sideslip angle on rugged cross-country terrain. The above results show that machine vision technology can be applied to the research of intelligent vehicle detection.
Based on the above research, it can be seen that the braking performance detection and braking stability analysis are the focus of the current research on the braking of tractor-trailer-train. The research on the BTS is still very shallow. The existing technologies and methods have poor detection accuracy, low efficiency and lack of intelligence. Therefore, a method using monocular vision technology to detect the BTS is proposed. This method can detect the BTS in real time under the state of vehicle motion, and achieve dynamic and high-precision detection. The structure of this paper is as follows: Section I is the introduction. Section II analyzes the movement of the tire in the braking slip process of the tractor-trailer train, and proposes a scheme to solve the tire slip rate by using the tire edge marker. In Section III, the camera is calibrated by Zhang’s calibration method, and the accuracy of spatial positioning of monocular camera is verified by external parameter matrix. The contour-based template matching algorithm is used to identify the tire edge markers, and the collected images are processed. Blob analysis is used to obtain the position of the template area in the image. The Section IV conducts the real vehicle test to verify the effectiveness of the detection scheme and analyze the test results.
Theoretical analysis and design of detection scheme
Rationality analysis of BTS detection based on slip ratio
Tire slip ratio represents the degree to which the tire rotational speed do not enable to calculate correctly the vehicle speed when the vehicle starts or brakes at a significant acceleration. Tire slip ratio directly affects vehicle braking performance. The variation trend of longitudinal and transverse adhesion coefficient with tire longitudinal slip rate is shown in Figure 1.

Relationship between longitudinal slip ratio and adhesion coefficient.
When the tire slip rate is in the range of 0%–20%, the longitudinal adhesion coefficient increases rapidly, and the braking effect of the wheel in this region increases significantly, which can make the vehicle in a stable driving state. When the slip ratio is greater than 20%, the longitudinal and lateral adhesion coefficients show a downward trend, the braking effect and directional stability of the wheel become worse, and the vehicle is in an unstable state. Therefore, if the wheel can obtain high longitudinal and lateral adhesion coefficient at the same time, the wheel is easy to achieve good braking effect and has good directional stability. The BTS can be evaluated by the slip rate of the wheel: under the condition of a certain road adhesion coefficient, the time when the slip rate of each wheel reaches 20% is compared with the initial time when each wheel triggers the braking.
Solution of tire slip ratio and rotation angle
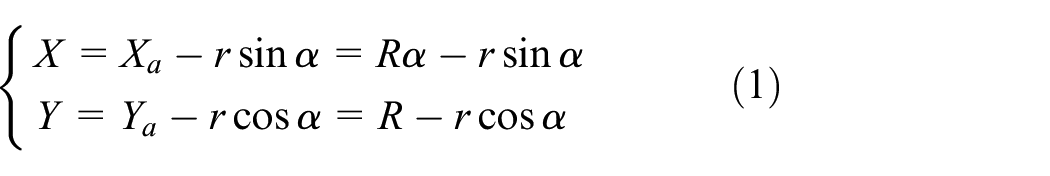
A circular marker is posted at the edge of the tire, and a monocular camera is used to detect the marker, and the trajectory of the marker is calculated to obtain the tire slip rate. In the rolling state, the cycloid formed by the movement of circular markers posted on the sidewall is a periodic function. The expression in the rectangular coordinate system is shown in. R and r denotes the radius of the tire and the distance between the tire center and the marker center respectively, α denotes the rotation angle of the tire, X and Y respectively denote the transverse and longitudinal coordinates of the marker center in the Cartesian coordinate system, Xa and Ya denote respectively the transverse and longitudinal coordinates of the tire center in the Cartesian coordinate system.
In the slip state, the tire increases a slip in the horizontal direction. The trajectory of the tire edge markers with and without slip is shown in Figure 2. The large circle in the figure represents the tire, and the small circle represents the circular marker. s1 and s2 denotes the cycloid trajectory of the tire edge marker without and with tire slip respectively, Xs denotes the horizontal displacement caused by tire slip. Under the slip state, the horizontal motion equation of the marker is shown in equation (2).


Slip trajectory diagram of tire edge marker.
The displacement Da of the center of the adjacent two-point tire under slip state is shown in equation (3). Figure 3 shows the relationship between slip and horizontal displacement of unslipped markers.


Relationship diagram of tire slip displacement.
In equation (3), X′a,i denotes the lateral displacement of the wheel center in the slip state of the tire, and the time interval between the two points is T. If T is small enough, the instantaneous velocity of the tire at i time can be expressed by the average velocity, as shown in equation (4).

Let uw be the translational velocity formed by the rotation of the tire at angular velocity ω. When T is small enough, the instantaneous velocity is expressed as the average velocity in time interval T, and the translational velocity uw,i at i time is expressed as equation (5).

According to formulas equations (4) and (5), the slip rate equation is shown in equation (6).

In order to obtain more accurate angle values, the rotation angles of the two markers were solved by using the inverse tangent function. The trajectories of the two markers in a cycle are shown in Figure 4. The angle formula of tire marker is shown in equation (7)


Trajectory diagram of dual-marker tire.
When vehicle is driving, tire subsidence will occur, affecting the marker coordinates. In order to reduce the tire subsidence, the vehicle should be no-load tested, and whether the tire pressure meets the standard tire pressure before testing. Affected by the internal force of the tire, the force of the tire near the rim is less than that of the tire edge, and the marker is posted near the rim.15–17
Camera calibration and tire marker extraction
Monocular camera imaging principle
In the whole monocular vision imaging system, the coordinate systems involved are: world coordinate system (Xw, Yw, Zw), camera coordinate system (Xc, Yc, Zc), image plane coordinate system (X, Y), pixel coordinate system (u, v). Pixel coordinates are discrete integer coordinates. The imaging principle is shown in the Figure 5.
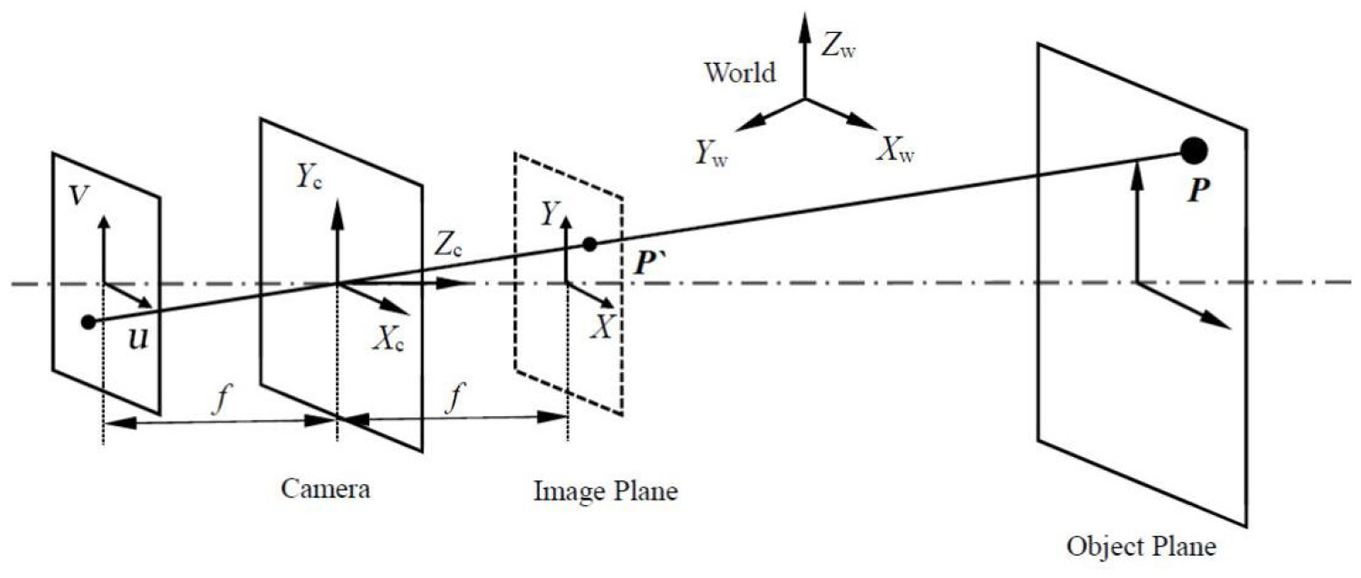
Monocular vision system imaging diagram.
The coordinate of any point P in three-dimensional space is (Xc, Yc, Zc)T, in the camera coordinate system, and the corresponding relationship with the coordinate (x, y) of the image point p in the physical imaging coordinate system is:

Let the homogeneous coordinates of a space point P in the world coordinate system be (Xw, Yw, Zw) T , and the homogeneous coordinates in the current camera coordinate system be (Xc, Yc, Zc)T. The coordinate in the physical imaging coordinate system is (x, y), and the coordinate in the image plane coordinate system is (u,v). The following relationship can be obtained by establishing the above coordinate system:

R denote rotation transformation matrix, and t denote translation vector. The transformation from camera coordinate system to physical imaging coordinate system is shown as follows:

Conversion of physical imaging plane coordinate system to image plane coordinate system:
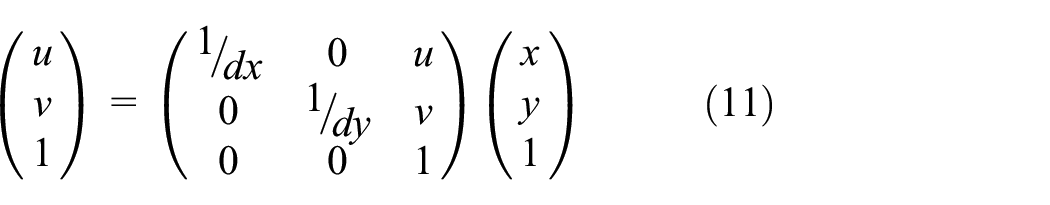
It can be obtained equation (12) from equations (8)–(11):

Camera calibration
The main purpose of camera calibration is to reduce the interference of camera imaging error on visual detection. The monocular camera is used to collect the marker images and obtain the marker center coordinates after image processing to obtain the tire slip rate, which requires the images collected by the camera to be consistent with the real scene as far as possible. In this paper, the monocular camera is calibrated based on Zhang’s 18 calibration method. Considering the influence of lens distortion factors, LM algorithm 19 is used to optimize the calibration parameters nonlinearly. LM algorithm combines the advantages of Newton’s downhill method and gradient descent method. By setting the adjustment factor according to the gradient change, it chooses which optimization method to use, so that the cost function is not easy to fall into local optimum. At the same time, LM algorithm can also provide accurate step size, local convergence faster. The optimization process of LM algorithm is as follows: Firstly, given the initial value x0 and the trust region radius μ0, the residual rk at the initial point and the Jacobian matrix Jk are calculated, and the iterative step length λ k is calculated. The Taylor approximation effect is calculated by the iterative calculation factor ρk, and the trust region radius is dynamically adjusted by the iterative calculation factor. The calculation formula of ρk is shown in equation (13).
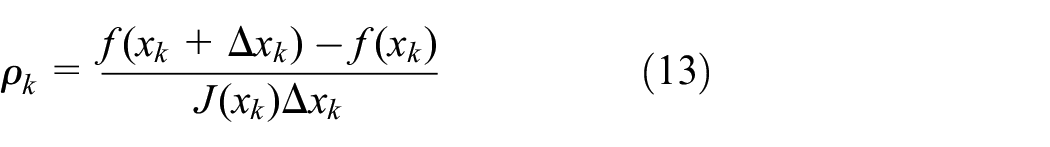
If ρk ≤ 0.25, indicating that the step size is large, Taylor approximation effect is not good, reduce the trust region radius μk+1 = 0.5 μk. If ρk ≥ 0.75, it indicates that the step size is small, the Taylor approximation effect is accurate, and the radius of the expanded trust region μk+1 = 2μk. If 0.25 ≤ ρk ≤ 0.75, the step size is appropriate, μk+1 = μk. When Δxk is small enough to stop iteration, the value of xk+1 is judged by ρk. When ρk ≤ 0, equation (13) shows that the error increases, the optimization stops. When ρk ≥ 0, the error can be further reduced, so xk+1 = xk + Δxk. LM algorithm can dynamically adjust the radius of the trust region μk according to the error of the function value with the iterative calculation factor ρk, so as to dynamically select the optimization method according to the change of the function error value. It can speed up the optimization speed and reduce the possibility of obtaining local optimal solution. 19
Matlab2019b is used to calibrate the monocular camera. The checkerboard is composed of black and white squares with 60 mm edge length. The array is 9 × 7 and the accuracy is ±0.001 mm. In order to better reflect the distortion degree of the image, the checkerboard target should traverse the entire field of view as much as possible. The chessboard and camera detail images are shown in Figure 6(a) and (b) respectively, and collected 16 calibrated target images are shown in Figure 7.

(a) Chessboard detail image and (b) camera detail image.

Chessboard image acquisition.
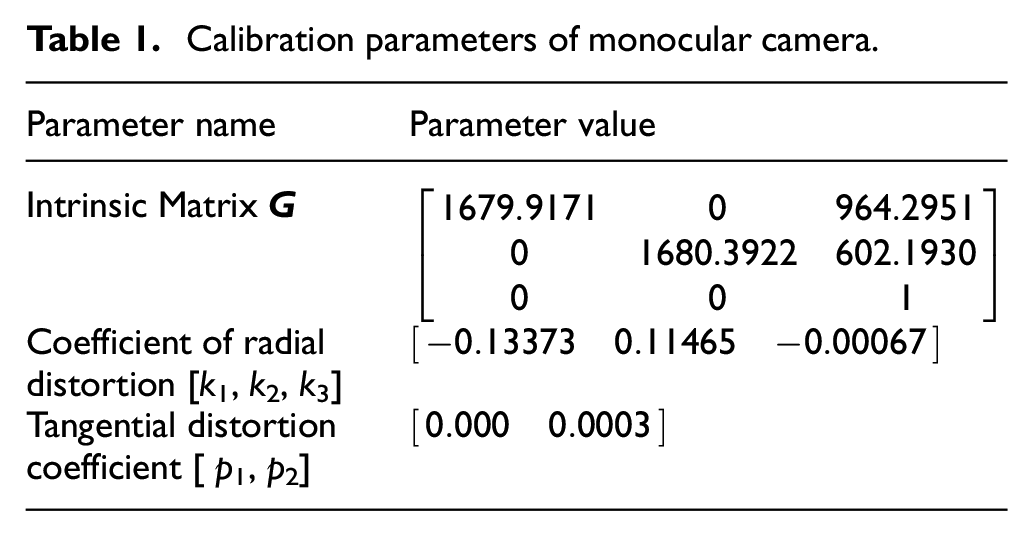
Through corner extraction, initial calculation of calibration parameters and LM algorithm optimization, the internal and external parameters of monocular camera are obtained, as shown in Table 1. The camera, lens type and parameters used in image acquisition are shown in Table 2.
Calibration parameters of monocular camera.
Camera and lens parameter table.

According to the camera parameters, the resolution of the camera is 1920 × 1200, and the main point coordinates of the camera should be in (960,600). It can be seen that the main point parameters of the camera obtained in Table 1 are basically near (960,600). At the same time, when the lens is 8 mm fixed focal lens and the pixel size is 4.8 μm × 4.8 μm, the theoretical value of fx and fy is about 1667. Table 1 shows that fx, fy are basically near 1667. This shows that the calibrated camera parameters conform to the actual camera parameters.
In order to further verify the calibration accuracy, the reprojection error is used to illustrate the calibration effect. The camera calibration reprojection error point cloud chart is shown in Figure 8. It can be seen from the reprojection error point cloud chart that the calibrated camera reprojection error is within ±1 pixel. It shows that the calibration results optimized by LM algorithm are ideal, and this calibration method can be applied to the BTS detection system.

Camera reprojection error figure.
Image acquisition and processing
Image processing uses Halcon software. The Halcon software package contains a large number of image processing operators, and provides a custom operator package to meet the modification and design of operators by image processing personnel. It also supports C# and C++ conversion of image processing code, and is widely used in various image processing projects. In order to speed up the image process and reduce the search range of template matching, the collected images are segmented to find the Region of Interest (ROI). Since the markers are all located in the tire, the ROI area selects the strip area where the tire is located. The gen_rectangle operator in Halcon is used to select the ROI area, and the reduce_domain operator is used to segment the image. The selected of circular markers and ROI are shown in Figures 9 and 10. As the BTS detection is carried out outdoors, the camera is affected by many interference factors, and the images are often mixed with various noises, mainly Gaussian noise and impulse noise. In order to ensure the quality of the image, Gaussian noise and impulse noise are added to the image. The image is processed by Gaussian filtering and median filtering. The selection of the filter is determined by the processing effect. The noise addition and filtering effect are shown in Figure 11. It can be seen from the filtering effect that Gaussian filtering also blurs the image edge in the process of removing noise, which is not conducive to the feature extraction of markers. Compared with Gaussian filtering, median filtering achieves effective filtering of images on the premise of preserving edge information. Therefore, median filtering is selected for filtering.

Tire concentric circular marker.
Circular markers images captured by monocular camera.

(a) Adding Gaussian noise, (b) adding pulse noise, (c) adding Gaussian noise three-dimensional graph, (d) adding impulse noise three-dimensional graph, (e) Gaussian filtering processing, and (f) median filtering processing.
Blob analysis segmentation template region
After image preprocessing, the Blob analysis algorithm is used to detect and segment the markers in the image to realize the identification of the marker area. The basic idea of Blob analysis is to filter the collected images to make the gray difference between the marker and the background image more obvious, and then extract the marker. 20 The operator of dyn_threshold in Halcon can perform dynamic threshold segmentation on the acquired image. In the operation, the “dark” mode is selected as the parameter, that is, the region where the gray value is lower than the offset gray value of the threshold image is selected for segmentation, and the expression is shown in equation (14). After processing the gray value images of the test area at different times from morning to night, it is determined that when the Offset value is 100, the segmentation effect is good.

The ring target is accurately segmented, but there are still some non-feature regions that interfere. Firstly, the segmented connected domain is opened, and the Halcon feature detection tool is used to combine with the ring feature of the marker. The processing results are shown in Figure 12(b).
(a) Image connected domain and (b) ring feature selection.
Since there may be multiple ring features in the image after feature selection, select_obj operator is called to index the selected object, and the rightmost ring mark is extracted. The reduce_domain operator is called to cut out the corresponding region in the original color image,21,22 so as to realize the segmentation process of identifying markers and regions.
Template matching algorithm
Template matching algorithm is to analyze the similarity of image gray and feature, and then find the method of similar regions in the image. Sobel operator has good detection effect, and has a smooth inhibitory effect on noise, so this paper selects Sobel operator to detect image edge. By obtaining the one-step degree of the image, the solution formulas of the edge images in the vertical and horizontal directions are shown in equation (15). Substituting the gradient value into equation (16), the gradient amplitude and direction of each pixel in the image can be obtained.


The edge detection processing image is shown in Figure 13. Since there are many edge features after edge detection, it is necessary to carry out target detection on the image by NMS algorithm, so as to retain the maximum edge of the local area and remove unnecessary edge information. At this time, the image may have discontinuous edge features. The lag threshold is used to connect the disconnected edge lines to obtain accurate and concise edge features.

Sobel operator edge detection chart.
After the template is created, the template is used to search the matching object in the source image. The shape-based template matching is used to characterize the similarity between the template and the matching area by similarity. The gradient of the template in the x and y directions is set as GiT(GxiT, GyiT), and the gradient of the matching image in the x and y directions is set as Gu,vS(Gxu,vS, Gyu,vS), where u and v represent the number of rows and columns of the matching image, and the normalized sum of the product of the gradient points of the template and the matching image represents the similarity, as shown in equation (17).
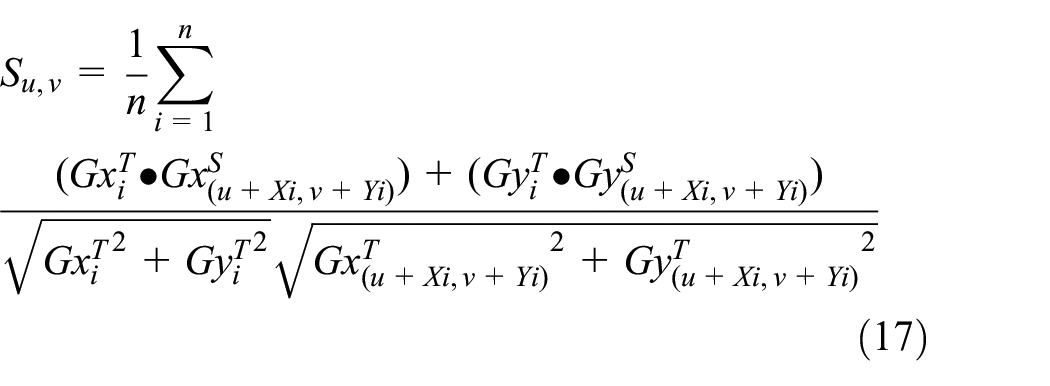
When Su,v = 1, there is a perfect matching between the template model and the search image. If Su,v = 0, there is no similar object in the search image.
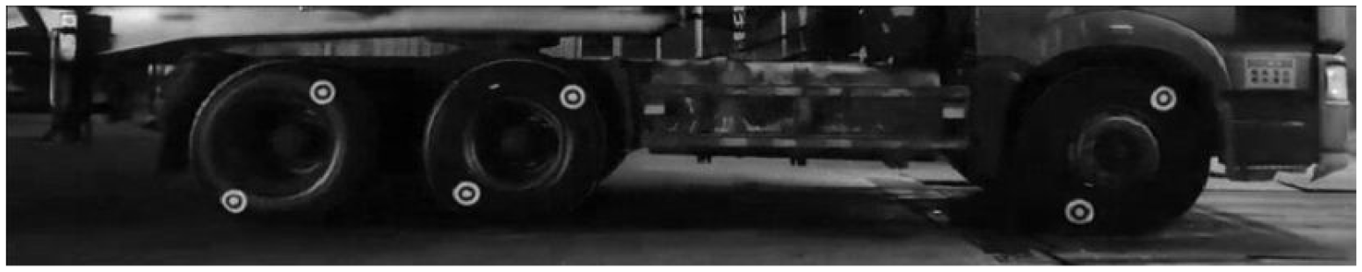
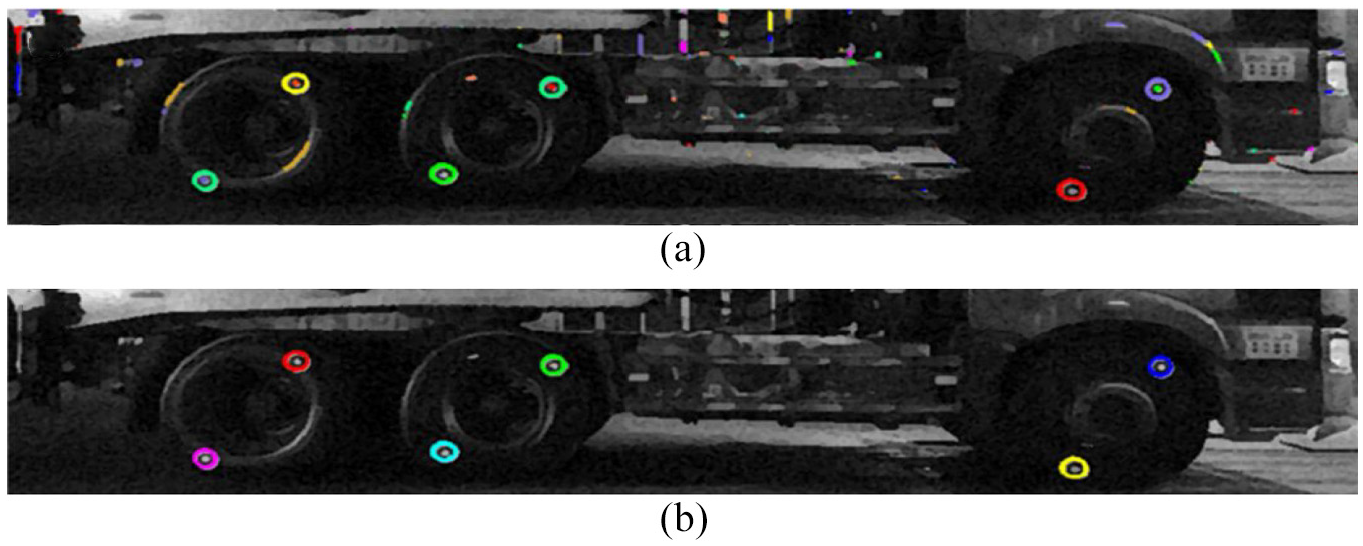
The position coordinates (Row, Column, Angle) obtained by template matching are transformed into rotation matrix R(θ) and translation matrix P. The sub-pixel contour of template image is transformed into the target area by affine transformation, and the matching effect is displayed. The affine transformation is used to transform the green sub-pixel contour of the concentric circle template to the matching area and the disp_cross operator is used to display the matching coordinate points. The effect image is shown in Figure 14.

Concentric circle marker recognition effect map..
Test and result analysis of BTS detection scheme
Verification test of slip rate solution scheme
In order to verify the actual effect of the slip rate solution scheme, in this section, the slip calibration device is used to verify the accuracy of slip rate obtained by monocular vision. 23 The device is shown in Figure 15. The slip rate verification device is composed of a disc rotation module and a platform translation module. The disc rotation module is driven by a stepper motor to rotate the disc around the rotating shaft. At the same time, the overall disc rotation module is placed on the mobile platform. The mobile platform is driven to do horizontal movement through the synchronous belt. The tire movement in the slip state can be simulated by adjusting the disc rotation speed and the platform movement speed.
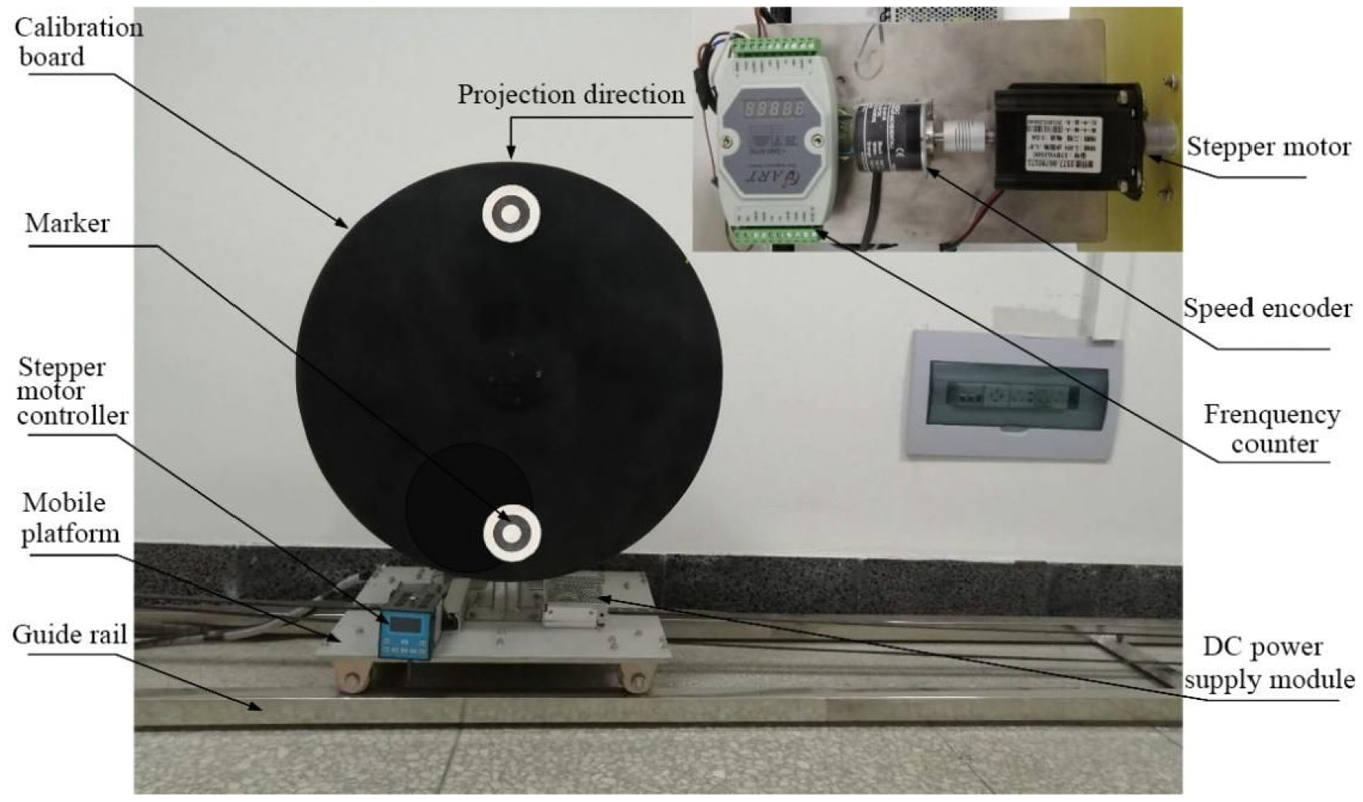
Structure diagram of slip rate verification device.
Due to the complexity of the simulation braking process, accelerated motion is used to simulate the reverse motion of the braking process, so that the disc and platform are accelerated from static to 10 km/h. The maximum moving distance of the mobile platform is 4 m. Combined with the velocity of the beginning and end of the movement, the acceleration of the mobile platform is 0.96 m/s2 calculated by the displacement velocity formula of the uniform acceleration movement, and the slip rate is 0. When the acceleration of the disk rotation is less than 0.96 m/s2, the product of the angular velocity of the disk and the radius of the disk is less than the horizontal velocity of the mobile platform, and the tire slip phenomenon is simulated. The acceleration of the mobile platform is set to 1 m/s2, and the acceleration of the disk is set to 0.9 m/s2. The slip rate value collected by the speed encoder and the slip rate value solved by the visual scheme are compared. The real-time slip rate is solved by visual scheme and slip rate verification device, and the curves of slip rate and error with time are obtained, as shown in Figure 16. The maximum error of the slip rate obtained by the test is 4.2%, which shows the rationality of the slip rate solution scheme. The scheme can be used for the brake timing detection of automobile trains.

Acceleration to 10 km/h slip rate versus time curve.
The composition of BTS visual inspection system
The detection system hardware includes: Eight AI-230U150C high-speed industrial cameras, frame rate of 30 fps, 1920 × 1200 pixels, field of view angle of 84.8° × 68° × 98.4°, with 8 mm focal length lens. Two IPC-810 industrial control computers, EPE-1816 motherboard compatible with Intel 6th and 7th generation processors, using EPE-6111P6 motherboard, including ISA, PCI, and PCIe card slot. One pair of E3JK-5DM1-5L photoelectric sensor. The detection software system is designed based on Windows 7 operating system, and all functions are implemented in VC++. The camera calibration part is implemented by Matlab R2019b, and the image processing part is implemented by Halcon algorithm package.
Real vehicle test
Selected Jiefang brand J6P 550 6 × 4 three-axis heavy tank tractor-trailer-train as test vehicle. The tire specifications were 12R22.5. Test site road adhesion coefficient is 0.75, the test process is as follows: Camera positioning, leveling, debugging of BTS detection system, and posting of concentric circle markers. Detection site layout is shown in Figure 17. The train enters the detection area at a constant speed of 10 km/h. When the train passes through the opposite photoelectric switch to block the light path, the system identifies the train entering, starts the camera to collect the image, and distinguishes the tire markers of different axles. When the high frequency signal is the same as the number of registered axles of the database vehicle, the camera frame number i0 is recorded, and the tire radius and the location radius of the marker are solved. The system determines the radius of each tire and the radius of the marker position, sends the braking command to the dot matrix screen, indicating the driver’s braking. Driver brakes and trigger pedal switch, computer record BTS detection initial time Tb. Calculation of BTS of the train by slip ratio.
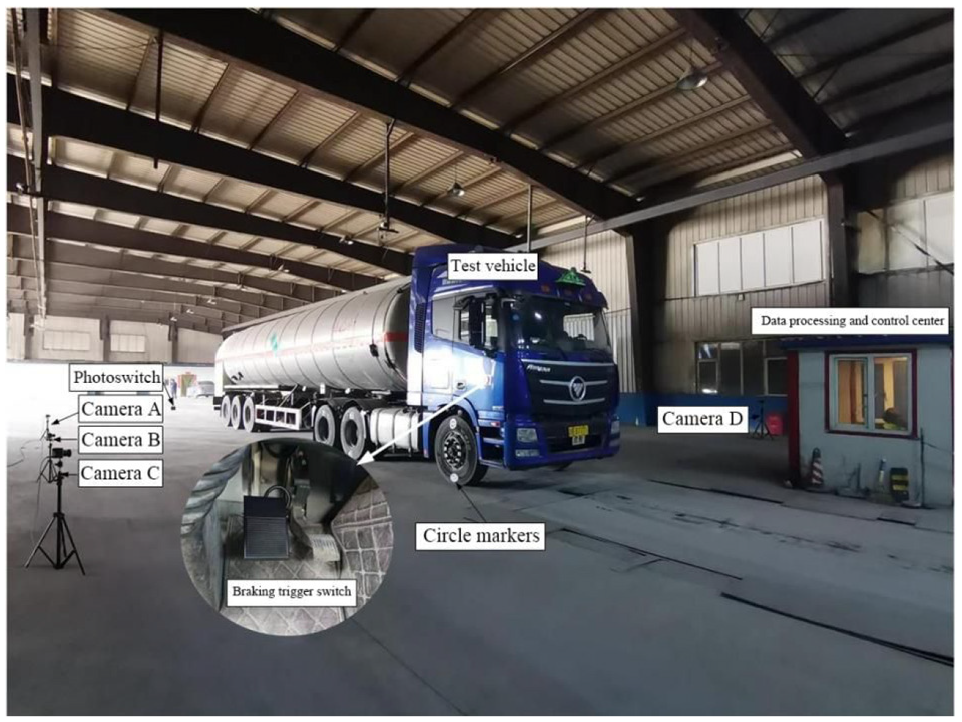
Hardware layout diagram of real vehicle test.
According to the above test process, Ti was recorded when the tire slip rate reached 20% on each axis of the test vehicle. The CFTOOL toolbox in Matlab2019b is used to obtain the slip rate-time curve by Gaussian fitting. As shown in Figure 18. The tire slip rate–time curves on the left and right sides of the vehicle are obtained from the marker coordinates collected by the camera, as shown in Figure 19.

Fitting curve of slip ratio of right side of first axle of test vehicle.

Fitting curve of left and right tire slip rate of test vehicle.
The time when the slip ratio of each tire reaches 20% can be read through the slip ratio curve. Five repeated tests are carried out on the test train. The time when the slip ratio of each tire reaches 20% under five tests is shown in Table 3.
Test data of vehicle BTS.

The average braking time of the axle was obtained by averaging the tire slip rates on both sides of the same axle, and the test results of the test train were analyzed. The BTS between test axles is 2-3-1-4-5-6. It can be seen that the braking time lag of the steering bridge is obvious. After analysis, it is found that the tractor-trailer-train often work in heavy load conditions, which makes the vertical force of the trailer ground larger. The tractor tires are often locked before the trailer’s, and the train loses the steering ability. The driver adjusts the braking force of the steering shaft to reduce this phenomenon.
Conclusion
In this paper, a solution scheme of tractor-trailer train slip rate based on cycloid formula is proposed. By collecting the lateral coordinates of tractor-trailer train tire markers and combining the tire rotation angle, the real-time tire slip rate is obtained to detect the BTS of the vehicle. The template matching algorithm was used to locate the markers, and the Blob analysis was used to obtain the location of the concentric circle markers, and the matching template was created. The tire markers were identified by the contour-based template matching algorithm. The slip rate verification test was established to verify the accuracy of slip rate solution. The real vehicle test of monocular vision tractor-trailer train BTS detection was completed. Compared with other results, this paper realizes the non-contact and dynamic intelligent vehicle BTS detection, and solves the defects of insufficient detection ability and low measurement accuracy of existing technologies.
Supplemental Material
sj-jpg-1-ade-10.1177_16878140211067045 – Supplemental material for Tractor-trailer-train braking time sequence detection based on monocular vision
Supplemental material, sj-jpg-1-ade-10.1177_16878140211067045 for Tractor-trailer-train braking time sequence detection based on monocular vision by Libin Zhang, Shiyuan Feng, Hongying Shan and Guanran Wang in Advances in Mechanical Engineering
Footnotes
Handling Editor: Chenhui Liang
Declaration of conflicting interests
The author(s) declared no potential conflicts of interest with respect to the research, authorship, and/or publication of this article.
Funding
The author(s) received no financial support for the research, authorship, and/or publication of this article.
Supplemental material
Supplemental material for this article is available online.
References
Supplementary Material
Please find the following supplemental material available below.
For Open Access articles published under a Creative Commons License, all supplemental material carries the same license as the article it is associated with.
For non-Open Access articles published, all supplemental material carries a non-exclusive license, and permission requests for re-use of supplemental material or any part of supplemental material shall be sent directly to the copyright owner as specified in the copyright notice associated with the article.