
Abstract
As vehicle speed increases, the aerodynamic drag reduction becomes increasingly significant. The aim of this paper is to find out the effects of the wheelhouse shapes on the aerodynamics of an Ahmed body with a 35 slant angle. In this paper, based on the detached-eddy simulation method, the effects of the three classic different wheelhouse on the aerodynamic performance and near wake of the Ahmed body are presented. The mesh resolution and methodology are validated against the published test results. The results show that the front wheelhouse has a significant impact on the aerodynamic performance of the Ahmed body, leading to different aerodynamic drag forces and flow fields. Enlarging the wheelhouse cavity volume could result in a gradual increase in aerodynamic drag coefficients, the ratio of the wheelhouse cavity volume increased by 2.9% and 9.8%, the drag coefficients increased by 2.5% and 4.5% respectively. The increase in aerodynamic drag was primarily caused by flow separation in the large cavity volume wheelhouse.
Keywords
Introduction
New regulations on vehicle emissions and fuel consumption are becoming stricter than previous ones, the governments and automobile companies attach great importance to the vehicle fuel economy. Reducing aerodynamic drag by 10% can reduce fuel consumption by approximately 2%–3%, according to Hucho et al. 1 As vehicle speed increases, the aerodynamic drag reduction becomes increasingly significant. The aerodynamic drag force is proportional to the square of the velocity of the car. 2 Moreover, Hucho and Sovran 3 concluded that aerodynamic drag produces 75%–80% of the total driving drag at 80 km/h driving speed. This indicates that reducing aerodynamic drag can effectively improve fuel economy. Therefore, a key factor in improve vehicle fuel efficiency is reducing aerodynamic drag.
To reveal the aerodynamic drag mechanism of a vehicle, Ahmed at al. 4 presented a simplified vehicle model for simulating the flow field of a real car and exploring the mechanism of aerodynamic drag, which providing a reference for automobile design. Some scholars have proposed several drag reduction control strategies and applied them to the Ahmed body for verification. For example, Wang et al. 5 presented an active flow control method using a new unsteady jet on the Ahmed body, and demonstrated that different actuation setups will result in a maximum drag reduction of 13.6%. Mohanmmadikalakoo et al. 6 proposed a passive flow control application on the Ahmed body by adding different linking tunnels at the rear of the bluff body, thereby shifting the flow from the high-pressure zone to the low-pressure zone, and they observed that the optimal configuration could lead to a drag reduction of up to 5%. Moghimi et al. 7 used the Ahmed body to investigate the influence of underbody diffuser flow, and pointed out that increasing the diffuser angle can break down the vortex to reduce aerodynamic drag when the diffuser angle below 8°; once the angle exceeds 8°, the wake flow separation discernibly appears, and leading to a rapid increase in aerodynamic drag. Siddiqui and Chaab 8 used a simple rectangular flap installed at the slant surface of the Ahmed body to find out the effect on the flow behavior and aerodynamic drag, and found that a maximum drag reduction of approximately 14% at the flap angle of 10°. Koppa Shivanna et al. 9 carried out the effect of afterbody shape modifications on flow structures and drag reduction in square back Ahmed body, and they found that tapering the cavity edges at an angle of 6 gave a significant drag reduction of 22.55% primarily due to a tremendous decrease in wake size.
Pfadenhauer et al. 10 reported that approximately 25% of aerodynamic drag was generated from wheels and tires. Thus, reducing the drag caused by tires, rims, and wheelhouses is an efficient solution to improve the aerodynamic characteristics of a vehicle. Wittmerie et al. 11 performed a series of experiments to investigate the effects of different tire patterns on aerodynamic drag of a generic car model; they observed that the different tread patterns could cause a 5% variance in the vehicle’s aerodynamic drag. Zhou et al. 12 used a wind tunnel test and numerical simulation to analyze the effects of tread patterns on tire aerodynamic drag and obtained a general understanding of the loaded tire airflow characteristics. Sebben 13 and Cavusoglu 14 had determined the effects of the wheel deflector on aerodynamic drag reduction in a generic car model, concluding that calibrating the deflector at an appropriate height could effectively reduce the drag. Gu et al. 15 investigated the influence of wheel spokes on vehicle aerodynamics and discovered that the number of open holes and the cover area of the rim has a significant impact on the aerodynamic drag. Yang et al. 16 studied the influence of the wheel width on vehicle aerodynamic drag, and they indicated that when the wheel width was decreased by 5%, the aerodynamic drag could be declined by 2%. Fabijanic 17 and Yu et al. 18 had studied the influence of wheel spoke cover parameters on the aerodynamic characteristics, and pointed out that the diameter of the wheel spoke cover considerably influenced the drag coefficient of the vehicle.
The aforementioned above findings and conclusions provide a reference for reducing the drag of the car. However, research has yet to be conducted on the shapes of the wheelhouse of a vehicle. In fact, the shapes of the wheelhouse mounted on the vehicles, as shown in Figure 1, which may not only change the flow field around the wheel but also considerably affect the vehicle’s aerodynamic characteristics. In this paper, an attempt will be carried out to analysis the influences of wheelhouse shapes on the vehicle aerodynamic characteristics, which can provide a reference for the design of the wheel and vehicle body with low aerodynamic drag in the future.

Three popular wheelhouse of the hatchback vehicle: (a) Audi Q5, (b) RAV 4, and (c) GLA200.
Numerical setup
Vehicle model and computational domain
To explore the influence of different wheelhouse shapes on the aerodynamic characteristics of a vehicle, three common wheelhouse shapes on the market were selected in this study, which are Audi Q5, Toyota RAV 4, and Benz GLA 200, as depicted in Figure 1. The current study was performed using the Ahmed body, which was a generic car model widely used in research on automobile aerodynamics. The Ahmed model has a short curved front section connected to a long straight middle section and an angled rear end, representing a generic model of lower-medium-sized hatchback vehicles. The suitability of various specific angles (0°–40°) of the model’s back end has been studied; when the slant angle is greater than 30°, the flow over the angled section is fully separated and changes in lift and drag are not significant. Moreover, the slant angle larger than 30° correspond to a low drag configuration and a negative lift. Accordingly, an Ahmed body model with a 35° rear slant angle was chosen in this current study; because the angle and length of the underbody diffuser has an clearly influences on the flow around body, and according the analysis results proposed by Huminic and Huminic, 19 a underbody diffuser with the diffuser angle 5° and the length 313.5 mm was selected in this study. The detail sizes of the Ahmed body are displayed in Figure 2. The length, the width, and the height of the car body are 1044, 389, and 288 mm, respectively.

Detail sizes of the Ahmed body and wheel.
When established the geometry model of the wheel houses, the grating images representing the three wheelhouse shapes were imported into the AutoCAD program, and the outlines of the wheelhouses were drawn as parameterized computer-aided design data using spline curves. According to the wheelbase and wheelhouse sizes employed in Huminic’s 19 work, the model parameters are as follows: the wheelbase is 638 mm and the diameter of the wheel was 150 mm. The depth of the wheelhouse was 70 mm, the width of the wheel was 50 mm, and the center of the wheel was 74 mm above the ground. The center of the rear wheel was 213 mm away from the rear end of the car body. Taken the diameter of the wheel as the reference, the grating images of the three wheelhouse shapes in the AutoCAD software is scaled to realize the reference diameter. After then, the spline curves of the three wheelhouses were drawn respectively. To explore the effects of the wheelhouse on the flow around the car body, a common five spokes wheel structure was adopted.
The three types of wheelhouse were named cases 1, 2, and 3. Uniform simplified open-rim wheels were installed for the three cases. The distance between the edge of the wheelhouse and the surface of the wheel are differed for each case, resulting in a certain difference in the wheelhouse cavity volume among the three cases (Figure 3). It can be seen that the shape arc of case 1 is formed using an equal radius R = 85 mm, and case 3 is formed using three different radius with both sides symmetry, which are 95, 108, and 140 mm respectively; case 2 is formed using several different radius without symmetry, they are 31, 45, 141, and 238 mm. The detailed radius dimensions of each wheelhouse are shown in Figure 3(a) to (c). The maximum distance between the wheelhouse and the wheel is 22.1 mm in case 3, and the minimum is 12.5 mm in case 2. Taking case 1 as an example, the detail sizes of the wheelhouse and wheel are shown in Figure 3(d). Based on the condition that the depth of the wheelhouse is not changed, the wheelhouse cavity volume increased sequentially from case 1 to case 3. On the basis of the volume of case 1, the ratio of the wheelhouse cavity volumes of the three cases was 1:1.029:1.098.

Detail sizes of the different wheelhouse: (a) case 1, (b) case 2, and (c) case 3, and (d) sizes of case 1.
Computational domain and boundary conditions
The computational domain was constructed by referring to a wind tunnel. The car model is placed in the center of the computation domain, as shown in Figure 4. The cross-section of the computational domain has a width of 7 W and a height of 3.7 H. In order to avoid the influences of the boundaries, the distance between the front face of the Ahmed body and the inlet of the computational domain was set to 1.5 L; the distance between the back face of the Ahmed body and the outlet of the computational domain was set to 5.5 L, which is considered to be appropriate for the development of turbulence. The blockage ratio, defined as the forward projection area divided by the computational domain entrance area, was 3.02%.

Computational domain and boundary conditions: (a) front view and (b) side view.
The boundary condition set-up in the current work was as follows. A uniform velocity profile U = 15 m/s was assigned at the inlet based on the great majority of the speed limit on urban road. Based on the inlet velocity and the car height, the Reynolds number is
Mesh generation
Polyhedral meshes have a relatively high level of precision and involve a relatively low number of mesh elements. Therefore, the polyhedral meshes were generated using STAR-CCM+ (version 15.02) software. In order to accurately capture the flow changes around the car body and improve the reliability of numerical calculations, a refinement box was set around the car. The surface mesh sizes of the vehicle body varied from 1 to 4 mm. The distance of the center of the first cell to the body surface is 0.05 mm, the expansion ratio was 1.3, and the total number of boundary layers was 15. These sizes gave an average of non-dimensional wall distance, y+, of approximately 3 in the whole computational domain.
Numerical method
First, all the cases were evaluated under steady-state conditions. The shear-stress transport (SST)
After the 15,000 iterations, the calculation results were applied to perform transient calculation process. The improved delayed DES (IDDES), which originates from the DES method, which utilizes a hybrid RANS–LES approach that resolves turbulence motion using LES only in the field of large or detached separation region, and models turbulence using RANS in almost the whole boundary.
22
The IDDES method was adopted in the present study. The similarity between the IDDES method and the DDES method is the uniform governing equations. The only difference is that


Where,
In transient calculation process, the semi-implicit method for pressure-linked equations-consistent algorithm was adopted for the coupling of the velocity and pressure fields. The discrete time scheme was approximated by a second-order upwind scheme. A 1e−3 s time step was adopted to run the transient numerical simulation. Five inner iteration steps were conducted in each time step. The total time step was 4 s. Therefore, the final number of transient iteration step was 20,000.
Numerical validation
To ensure the numerical results were not sensitive to the mesh resolution, three sets of coarse, medium, and fine grid resolutions were applied to the a 35° slant angle Ahmed body with no wheelhouse, and the whole car body was supported in the floor of the wind tunnel by four cylinders with a diameter of 30 mm and a height of 50 mm. In CFD, the grid convergence check is the most common approach to demonstrate the validity of mesh generate method. To check the mesh generated method and ensure the results are not sensitive to the grid resolution, a grid dependency testing was conducted on the coarse, medium, and fine cells with approximated 5.15, 5.87, and 6.05 million cells. The CPU times of the coarse, medium, and fine cells were 75, 86, and 93 h, respectively. The simulation results were compared with the experimental results. The contrast results of drag coefficient (Cd) and lift coefficient (Cl) are presented in Table 1. It can be seen that the Cd calculated in the current simulations were marginally higher than the experimental results, however, they decreased significantly as the number of cells increased. The maximum errors of Cd between the simulation results using the fine mesh and experimental results were about 3.2%, but the Cl between simulation and test has significant differences. The main reason for this is that the test result of the lift coefficient is more susceptible to the influence of the model installation, wind tunnel structure, and other factors. The measurement results of the wind tunnel often have substantial differences, resulting in the reliability of the lift coefficient measured by the test is not very good. In addition, the simulation results are also susceptible to the impacts of grids, turbulence models, etc., and the consistency of the experimental results is poor. Taken the Cd as the reference target, the fine mesh project was suitable for the study in the following.
Comparison of numerical simulation and experiment using Ahmed body without wheels.

Comparing the streamwise velocity profile deviation between model results and experimental results in a specific part can effectively validate the accuracy of numerical method. Accordingly, in this study, to ensure the reliability of the aforementioned numerical setup, the 35° Ahmed body with a 0° diffuser angle was used for verification. Figure 5 displays a comparison of the streamwise velocity profile obtained in the present numerical analysis with that obtained from the experiment conducted by Melie et al. 23 at U = 40 m/s. Although there are minor deviations between the numerical simulation and experimental results in the slanted face and wake region, it is reasonable because absolute coincidence is impossible. The main reasons for the differences are that the adopted meshing strategy may lead to some errors between simulation results and experiments due to the limitation of computing resources. Nevertheless, these errors were within an acceptable range.

Comparisons of streamwise velocity in symmetry plane (U = 40 m/s).
After the validation of the mesh methods, the Ahmed body with four wheels were discrete with the surface mesh sizes of the wheels varied from 0.6 to 2 mm. the distance of the center of the first cell to the wheel surface was 0.02 mm, the expansion ratio was 1.3, and the total number of boundary layers was 15. The final grid numbers using the fine project for cases 1, 2, and 3 were 7.83, 7.67, and 7.45 million elements, respectively. Figure 6 provides computational meshes and the boundary meshes for case 1. All numerical simulations of the three cases were conducted using the STAR-CCM+ (version 15.02). Due to the presence of the wheelhouse, the grid number of the Ahmed with the different wheels is larger than that of the Ahmed without, and the CPU times of them are about 100 h. The convergence history of the drag coefficient is displayed in Figure 7. After 30,000 iterative steps, the average drag of the last 5000 iterative steps is selected to computer the drag coefficients of the Ahmed body with wheelhouse.

The fine mesh of the case 1.

Convergence history of drag coefficient with iterative steps.
The drag coefficients and lift coefficients of the different Ahmed body models using the different wheelhouses are listed in Table 2. Table 2 indicates that enlarging the wheelhouse cavity volume will result in a gradual increase in aerodynamic drag coefficients, and reduce pressure difference between the top and the bottom of the car body. Besides, the wheelhouse shapes could have a considerable effect on the aerodynamic characteristics of a vehicle, and the analysis of specific influences involved is provided in the next section. In order to investigate the flow field around the Ahmed body and the wheelhouse, seven slices along the X-axis, Y-axis, and Z-axis are taken as characteristic planes, and the detail locations are shown in Figure 8.
Drag coefficients of Ahmed body with different wheelhouses.


Locations of different slices in the cases.
Results and discussions
Flow topology in wake region
The static pressure distributions on the Ahmed body are illustrated in Figure 9. It can be seen that the negative pressure zone around the front wheel discernibly increased with the wheelhouse cavity volume, and the negative pressure zone around the slanted face decreased as the wheelhouse cavity volume increased. However, the pressure around the rear wheel exhibited only small variations with the wheelhouse cavity volume. A significant pressure recovery was observed on the slanted face and rear vertical face, implying that the separated bubbles around this region were reduced. It can be inferred that the shape of the wheelhouse has a considerable effect on the wake flow, and the aerodynamic drag of the car body differed among the three wheelhouse shapes.

Static pressure distribution on the Ahmed body: (a) case 1, (b) case 2, and (c) case 3.
The flow topology in symmetry plane was composed of two pairs of counter-rotating vortices, as shown in Figure 10. A strong downwash from the slanted face interacted with updraft flowing through the diffuser, thereby generating a pair of counter-rotating vortices, N1 and N2, which were behind the vertical face of the rear body. The low-pressure vortex N1 was pushed far away from the vertical face of the rear body and moved backward because of the increase in downstream flow outward from the wheelhouses. Another pair of counter-rotating bubbles, N3 and N4, above the slanted face were also altered corresponding to the position change of N1 and N2 in the symmetry plane. The tail flow was enhanced with the retro-position of vortex N1 due to the enlargement of wheelhouse. Turbulent kinetic energy (TKE) represents the stability of the flow, and the TKE presented in the symmetry plane, illustrated in Figure 10, reveals that the TKE increased – hence, the energy dissipation was increased when the bigger wheelhouse cavity volume was designed on the car body.
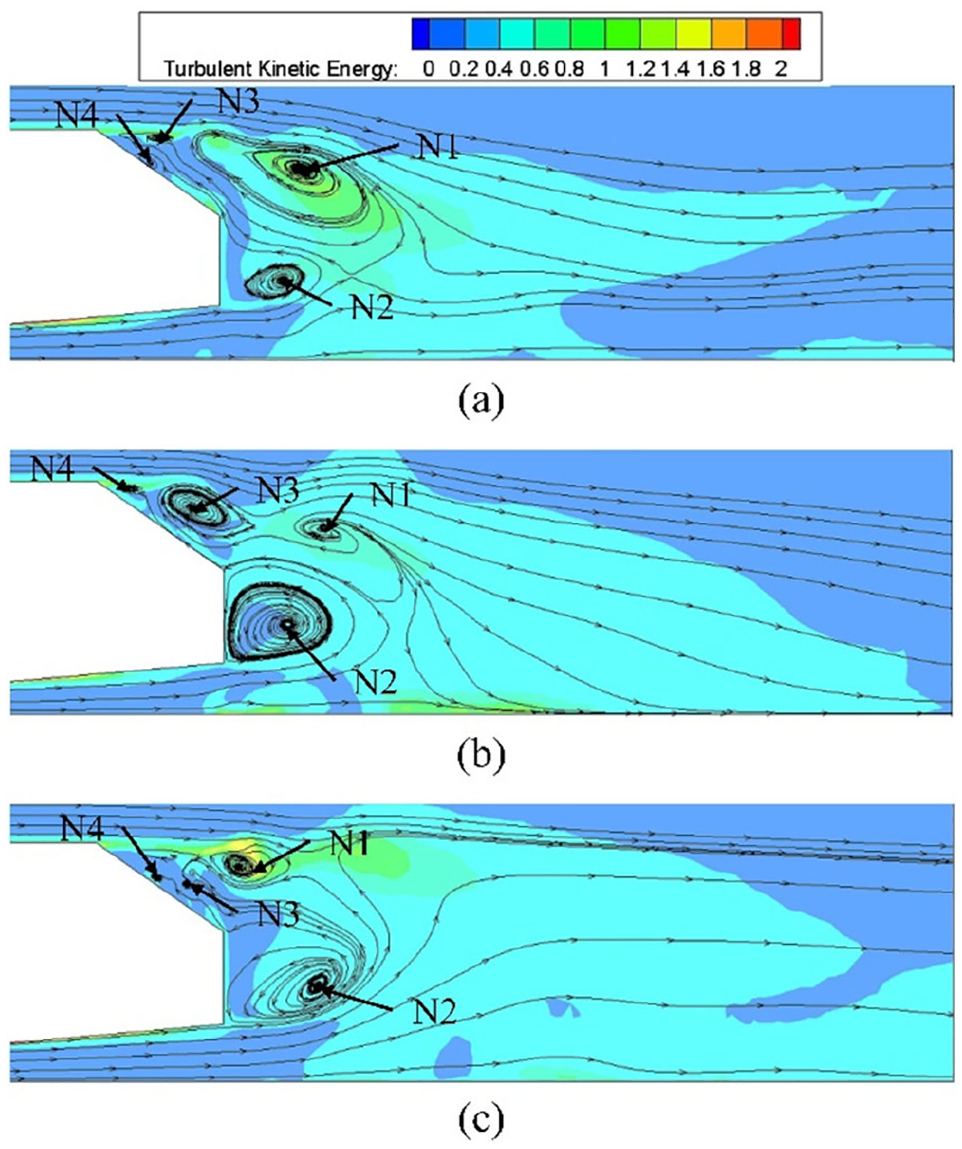
Contours of TKE with streamlines in symmetry plane X = 0 m: (a) case 1, (b) case 2, and (c) case 3.
As discernible from Figure 11, the TKE decreased with increasing distance from the car body. The TKE values nearby the ground of cases 2 and 3 were increased. Case 1 demonstrated the completely opposite effect, the TKE values was decrease. The reason for it may be the increment in the wheelhouse volume will lead to greater airflow flowing out of the wheelhouse, and it will also affect the airflow movements between the ground and the car body. The interaction between the airflow near the underbody and the downdraft from the slanted surface influenced the TKE of the wake. This was extremely evident in cases 2 and 3. The airflow from the inclined surface was mixed with the increased turbulent airflow out of the wheel cavity, causing significantly flow separation of the rear body near the ground. Thus, the TKE behind the car body was strengthened with the enlargement of wheelhouse cavity volume.

Contours of TKE of the wake region in three sections: (a) Y = 0.2 m, (b) Y = 0.28 m, and (c) Y = 0.36 m.
Increased TKE implies flow instability. The three-dimensional (3D) streamlines originate from the rear wheelhouses, spreading along the lateral sides of the vehicle body before being deflected upward due to the low pressure under the diffuser. The quantity of up-streamlines behind the slanted face corresponds to the volume of wheelhouse; in other words, the distribution of the wake flow increases is in accordance with the wheelhouse cavity volume, as indicated in Figure 12.

Instantaneous streamlines colored by values of velocity: (a) case 1, (b) case 2, and (c) case 3.
Flow structure around wheelhouses
It is reported that the front wheel contributes most to the aerodynamic drag of a car. 24 Obviously, the flow and topology in the front wheel area is substantially affected by the wheelhouse shape. Figure 13 shows the streamlines around the front left wheel. It can be seen that when the airflow along the car body surface enters the wheelhouse cavity, and the flow direction was deflected toward the outside of the wheel spokes because the obstruction of wheel cavity inner surface, after then, this airflow was mixed in the outside airflow and moved toward to the rear of the wheel. However, note that as the volume of the wheelhouse increased, the mixed airflow velocity will increase, and this leads to raise the velocity gradient in the flow direction, therefore, this can reduce the pressure around the wheelhouse and change the aerodynamic drag among the three different wheelhouses.

Instantaneous streamlines colored by values of velocity around the left front wheels: (a) case 1, (b) case 2, and (c) case 3.
The air flowing into the front of the lower part of the wheel spokes, which was exposed to the wind, was deflected upward along the wheelhouse. The interaction between the upstream and the outflow in the wheel cavity governed the static pressure distribution in the rear face of the front tire, as illustrated in Figure 14. In general, the cover part of the low-pressure region expanded as the wheel cavity volume increased, as depicted in Figure 14(a) to (c). This was observed in all cases, except for case 2, in which the maximum pressure near the top of the wheel was the smallest. This phenomenon can be explained by the function of the gap between the wheelhouse and the tire surface; specifically, a narrow gap of case 2 increase the flow velocity according to the Bernoulli’s equation. And the fast flow prevents the airflow affected by the inner wall of the wheel spoke from flowing to the side of the vehicle body and increases the pressure on the top of the tire accordingly.

Pressure distribution on the left front wheels: (a) case 1, (b) case 2, and (c) case 3.
In contrast to the pressure distribution on the front wheel, the distribution of the low-pressure region on the rear surface of the rear wheel was dominated by the wheelhouse cavity volume, and the influence of the clearance between the wheel and the wheel spoke on this distribution was relatively low. The differences in aerodynamic characteristics among the wheels mainly occurred on the outside of the wheel, as displayed in Figure 15(a) to (c). The detour formed by the air flowing through both sides of the front wheel evidently dispersed the airflow to the rear wheel, and the amount of air flowing upward the wheel into the rear wheel cover was reduced. By comprehensive comparisons of the Figures 14 and 15, it can be seen that the front wheel is mainly low pressure region, and the read wheel is mainly high pressure region. It can be seen from the pressure distribution that the influence of the wheelhouse cavity volume on the surface pressure feature of the rear wheel was more obvious.

Pressure distribution on the left rear wheels: (a) case 1, (b) case 2, and (c) case 3.
Flow field in gap between underbody and ground
To analyze the corresponding flow fields, the three different planes above the ground were considered as analysis objects. The wheelhouse shape was determined to have a considerable influence on the flow distribution around the wheel. Once the air reached the wheel, the airflow direction was altered along both sides of the wheel. Compared with case 1, increasing the wheelhouse cavity volume could reduce the flow velocity around the edges of the front wheel, as illustrated in Figure 16. This is benefit to reduce the flow separation around the front wheel. Moreover, the airflow speed increased as the air approached the wheelhouse. The reason for the development of the velocity distribution behind the front and back wheels is that increasing the flow space in the wheelhouse would increase the airflow inside the wheelhouse and reduce the airflow outside the wheel. The large number of air flow in the wheelhouse will aggravates flow instability, and it leads to flow energy loss and drag increase. The result that increasing the cavity volume of the wheelhouse will enlarge drag coefficient in this currently study is agree with that proposed by Regert and Lajos 25

Velocity distribution in the slices in the gap: (a) Z = 0.005 m, (b) Z = 0.022 m, and (c) Z = 0.039 m.
Evolution of vortices around wheelhouse
Three slices are selected to show the evolution of the total pressure distributions of all the cases in the underbody gap, which are the cross section through the front wheel axis, halfway between the axes and through the rear wheel axis, there slices are shown in Figure 8. Figure 17 shows the flow feature was observed in the same vertical slices of the three cases. In the vertical slice of the center of the front wheel, there is a low-pressure zone nearby the sides of the front wheel, however, the low-pressure zone decreased with the increasing of the wheelhouse cavity volume. In the vertical slice of the center of the car body, the difference of the total pressure distributions mainly focused in the gap between the car body and the ground, but it could not be ignored that increasing the wheelhouse cavity volume would result in enlarging the low-pressure zone around the car body. In the vertical slice of the center of the rear wheel, the difference of the total pressure distributions mainly focused not only in the gab but also nearby the both of the rear wheel. It is obviously that increasing the wheelhouse cavity volume will lead to enlarge the high-pressure zone around the sides of the rear wheel. The low total pressure values indicate the existence of vortices. These vortices primarily represented the separation of the boundary layer from the edges of the lower part of the wheels; they were strengthened by the flow passing through the sides of the wheels. Notably, the presence of vortices was inversely proportional to the wheel cavity volume because the quantity of separation bubbles attached to the edges increased with the inclination of the lateral flow deflected by the lower part of the wheel.
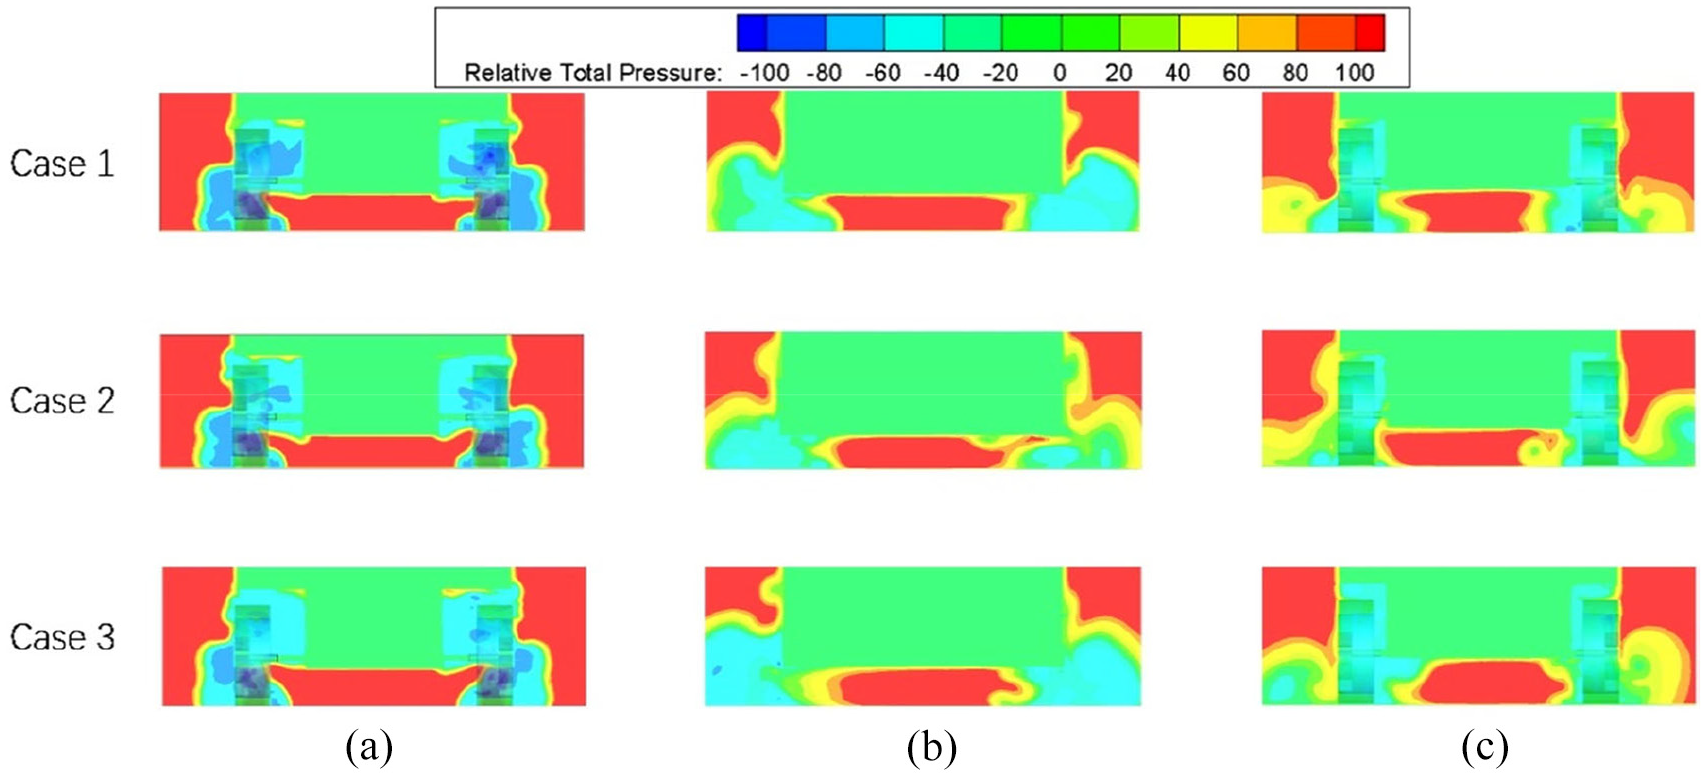
Total pressure contours in different slices: (a) Y = −0.851 m, (b) Y = −0.532 m, and (c) Y = −0.213 m.
It can be seen from Figure 18 that as the wheelhouse cavity volume enlarge, the difference of flow filed inside the gap between the wheelhouse and the wheel increase. In terms of the front wheel, the shapes of the wheelhouse have much influence on the pressure distribution of the gap, there is an obviously pressure gradient from the inlet to the outlet, while it is little effect on the pressure field of the front and rear of the wheel contact patch. Compared with the case 1, the discontinuous cross-sections of the wheelhouse, which is formed using different arc radius, will exacerbate flow instability, and the flow instability increase while the cavity volume increase. However, in Figure 19, the shapes of the wheelhouse have little effect on the streamline distribution of the rear wheel, and the pressure difference between the front and the rear of the wheel contact patch decreases as the wheelhouse cavity volume is increased.

Flow separation in left front wheelhouse cavities (X = 0.17 m): (a) case 1, (b) case 2, and (c) case 3.

Flow separation in left rear wheelhouse cavities (X = 0.17 m): (a) case 1, (b) case 2, and (c) case 3.
The Q criterion provided by Jeong and Hussain 26 was adopted to identify the 3D vortex structures around the front and rear wheels. The Q criterion, a quadratic invariant of the velocity gradient tensor, can be defined as follows :

Where,
When the airflow reached the front wheel, a considerable quantity of air changed direction and entered the wheelhouse. The considerable volume of air flowing along the leading edge of the front of the wheel spoke into the wheelhouse was deflected upward and generated some separate bubbles. The separate bubbles attached to the leading edge were strengthened by the upstream in the wheelhouse, thus these separate bubbles became vortices extending into wheelhouse, and induced the separation of the boundary layer around the wheel. A larger wheelhouse cavity volume as thus demonstrated to produce more vortices, as illustrated in Figure 20. This can be attributed to the strengthening of separate bubbles in the vortices by the increasing up-flow with the extension of the wheel cover.

Iso-surface of instantaneous Q criterion (205,000) colored by values of velocity in left front wheels: (a) case 1, (b) case 2, and (c) case 3.
The vortices structures around the rear wheel were distinct from that of the front wheel, as shown in Figure 21. Because the front wheel changed the airflow direction and velocity gradient that leading to reduce the flow mass entering the rear wheelhouses; thus, the fluid separation occurring in the rear wheelhouse cavity volume was not noticeable. With the expansion of the wheel cover, the tailing vortex generated at the exit of the wheel cover was elongated prominently. For the different wheelhouse shapes, the vortices that originated from the rear wheelhouse interfered with the vortices are generated from the underbody diffuser. Therefore, the final dimensions of the tailing vortex mainly depended on the wheelhouse cavity volume.

Iso-surface of instantaneous Q criterion (205,000) colored by values of velocity in the left rear wheelhouses: (a) case 1, (b) case 2, and (c) case 3.
Conclusion
In this paper, three different shapes of the wheelhouse were designed on the 35° Ahmed body. Numerical simulation method was adopted to study the influence of three different shapes of wheelhouse on the flow field and aerodynamic characteristics of Ahmed body. The flow fields around the wheelhouse, the gap between the body and the ground, and the rear of the vehicle were analyzed. The following conclusions are obtained:
Different shapes of wheelhouses have a significant effect on the pressure distributions around the car body and the wheels. Increasing the volume of the wheelhouse cavity will lead to the increase of the low pressure region of the car body nearby the front wheel. The flow entering the wheelhouse cavity forms the strong vortices which creates a low pressure region at the most surface of the front wheel, and the low pressure region increases with the increase of the cavity volume. However, the effect of the wheelhouse cavity volume on the surface pressure distribution of the rear car body and the rear wheel is not obvious compared with that of the front wheel, and the effect is mainly concentrated on the pressure distribution of the rear wheel.
The expansion of the volume of the wheelhouse also raises the airflow velocity inside of the gap between the car body and the ground, which weakens the separation vortex near the rear of the car to a certain extent. Meanwhile, the increase of airflow velocity can lead to the increase of airflow quantity attached to the diffuser to the car wake, and it will enhance the turbulent kinetic energy and aggravates the instability of the wake. Enlarging the wheelhouse cavity volume could result in a gradual increase in aerodynamic drag coefficients, the ratio of the wheelhouse cavity volume increased by 2.9% and 9.8%, the drag coefficients increased by 2.5% and 4.5% respectively.
Expanding the volume of the wheelhouse can make the separation bubbles more easily generated, and the separated flow around the front edge of the wheel is more tend to enter the wheelhouse volume, and after it mixes the airflow inside the wheelhouse volume, the increase of air flux can induce the separation of the wheel boundary layer, and aggravate the flow separation, vortex broken down, and make the flow around the wheelhouse more chaotic and instability. This is one of the main reasons for the increase in aerodynamic drag coefficient. Further investigation by focusing on the mechanism of flow instability or flow control methods of drag reduction will reveal more insight.
Footnotes
Handling Editor: Chenhui Liang
Declaration of conflicting interests
The author(s) declared no potential conflicts of interest with respect to the research, authorship, and/or publication of this article.
Funding
The author(s) disclosed receipt of the following financial support for the research, authorship, and/or publication of this article: This work was supported by the National Natural Science Foundation of China (No. 52072156, No. 51675240, and No. 51605198), Postdoctoral Foundation of China (2020M682269), and Jiangsu Provincial Six Talent Peaks (Grant No. JXQC-011). Postgraduate Research & Practice Innovation Program of Jiangsu Province (SJCX21_1686).