
Abstract
The on-board “speed-resistance-power” curves are profiled by a fitted jet thrust deduction factor relation, where the raw data are obtained from both bench thrust testing data and loop test results. Firstly, the thrust characteristics of a waterjet were tested by a thrust testing bench, while the pump performance such as capacity, head and shaft power of the waterjet was measured on a loop test rig. The useful fitted jet thrust deduction factor relation involves three related variables, that is to say, thrust coefficient, torque coefficient, and advance coefficient. Then, the best efficiency propulsion points are indicated by a collapsing technology and the subsequent results that the best efficiency propulsion points are actually existed. Cavitation margins are also noted by the two groups of data obtained by the loop data and the bench data, respectively. The discrepancy of the two margins shows the measuring error of the loop test means. In addition, the non-consistency features of the curves in the cavitation zone indicate the complex cavitation instabilities in the waterjet propulsion. At last, the bench tested thrust results are supplemented and therefore a useful map is completed.
Keywords
Introduction
Waterjets are preferable propulsion devices for their safety as the rotating impellers are enclosed in a housing to avoid injuring persons and animals swimming near the vessels. The enclosing for the impellers can also make them good suction performance and therefore achieves higher speed than traditional propellers. A waterjet system includes the typical hydraulic components of intake duct, impeller, stator, nozzle, steering bow, and reversing bucket as shown in Figure 1. The inflow characteristics have great effects on the impeller performance. Many efforts are carried out to investigate the non-uniformity in the intake duct, 1 and Duerr and von Ellenrieder 2 discussed the factors that influence the non-uniformity flow in the intake duct. The impeller is the key component of waterjet propulsion and our previous works engaged in the impeller performance.3,4 We also studied the flow patterns in nozzle and find that the role of the nozzle is to keep the waterjet working under best efficiency point. 5 Some users insist that thrust disappears sometimes during turning operation, and it is estimated that the steering bow contributes to the malfunction. But related documents are rarely concerned with steering bow behavior. 6 Our research on the flow in reversing bucket found that moderate gas in the flow can augment the reversing force. 7

Waterjet profile.
As most of the waterjet systems are flush mounted in the vessel hulls, the interaction effects of them are unanswered and critical questions to both the naval architects and the waterjet manufacturers. Eslamdoost et al. 8 proposed a pressure jump method for modeling waterjet/hull interaction that may be used in combination with both potential flow/boundary layer methods and more advanced viscous flow methods. Takai et al. 9 investigated the capability of a URANS flow solver for the simulation of waterjet/hull interaction in which the impeller is modeled as an actuator disk. Both of the efforts simplified the impeller geometry as they declared that the impeller modeling requires too much more computational cost as it is not needed for their works. Nevertheless, a system-wide perspective urges that only reasonable combination of vessel/engine/waterjet can result in good vessel behavior, which means that detailed information of waterjet performance is essential. MacPherson 10 proposed a parametric model of waterjet performance based on the fact that the curves of thrust/power coefficient against power coefficient exhibit extreme values, which would assist the selection of waterjets in matching the maximum efficiency to the resistance curves. But this parametric model is of use for non-cavitating phenomenon only. Altosole et al. 11 proposed two simple procedures to calculate the waterjet thrust as function of ship speed and engine power based on a strong simplification and depended upon many empirical coefficients. Further, none of the methods concern the inflow non-uniformity which can present obvious fluctuating loads on the impellers. 12
In this paper, the thrust characteristics of a waterjet were tested by a thrust testing bench. The waterjet was also tested on a loop test rig to measure its pump performance such as capacity, head, shaft power, and so on. The waterjet for both the tests appended a square-taper duct to improve the non-uniformity flow in the intake duct. With the measured data, the on-board “speed-resistance-power” curves, as well as the recommend zone and the cavitating limits, are profiled.
Thrust test
Figure 2 is the equipment that was used to measure the thrust against rotating speed. The waterjet propulsion was driven by a diesel. Both the waterjet propulsion and the engine are supported by a pair of slide bars, which are two smooth guide rails mounted on the fixed bench and the waterjet propulsion shall be moving along the bars while the system was been pushing by the waterjet reaction. A tension meter was used to measure the thrust, and a tachometer is to record the shaft rotating speed. The shaft power was evaluated by torque multiplying rotating speed, in which the torque was measured by a torque meter. The precision of testing instruments is listed in Table 1.

Test bed for thrust measurement.
Precision of testing instruments.

The impeller of the waterjet is an axial one as shown in Figure 3 and its main parameters are listed in Table 2. Though the efficiency of an axial flow impeller is lower than that of a conventional mixed flow one, some advantages of axial flow types discussed by Bulten 13 promoted their use in waterjet propulsions. Further information of the impeller will be displayed in the following corresponding contents.

Impeller profiles: (a) impeller with four blades and (b) structure parameters.
Impeller parameters.

Figure 4 shows the tested data of shaft torque and the thrust against shaft speed. The calculated power density P/D2 and the thrust-power ratio are also listed in the figure. It is noted that both the power and the torque are not rising any longer when the rotating speed increases beyond nearly 3500 r min−1, which is due to the development of cavitation and will be discussed later. The power density is approaching 4 MW m−2 which is a critical value for waterjet propulsion. Though obvious divergence is manifested under low rotating speed due to low power values, the thrust-power ratio displays a flat tendency and the average value is about 1.9.

Thrust and torque tested and calculated parameters.
Loop test
The waterjet propulsion was tested on a test rig as illustrated in Figure 5. The rotating speed of the shaft is reduced to 1450 r min−1 due to the tank capacity limit. The flow rate is measured by a flow meter. Both the pressure upstream and downstream the waterjet are recorded by pressure sensors. The precision of the testing instruments is also listed in Table 1. The tested data was scaled to 3000 r min−1 by affinity law as the solid lines shown in Figure 6, and parenthetically the dashed lines are the performance of a conventional pump with the same rated performance parameters scaled by the non-dimensional indicates of Ni and Pan. 14 It is found that the current design has a flatter power curve and a wider high-efficiency zone than the conventional one.

Test rig for axial flow pumps.

Performance curves tested on loop rig: (a) H-Q curves, (b) η-Q curves, and (c) P-Q curves.
The hollow circle in Figure 6(c) indicates the related power, that is, about 121.2 kW at 3000 r min−1, which declares that the waterjet operated under the condition Q = 0.346 m3 s−1, H = 25.5 m, a little deviation from the best efficiency point.
Speed-thrust-power curves determination
Theoretically, the thrust of the waterjet propulsion is equal to the vessel resistance during the craft vessel cruising. However, due to vessel movement and the interaction between vessel and waterjet propulsion, the thrust T tested by the test bed shown in Figure 2 is higher than the vessel resistance R. The useful part of T that is equal to R is defined as TR here. It is a tricky task to determine the difference between T and TR. Here the non-dimensional jet curves methods proposed by Altosole et al. 11 are used to calculate the TR. Three useful coefficients are defined below.
Thrust coefficient KT

Torque coefficient α or KM
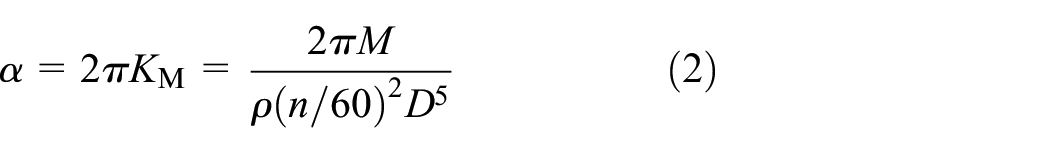
and the advance coefficient J

Figure 7(a) is the KT-J curves. 11 The discrete points in Figure 7(b) are the α values deduced from Figure 4, it is noted that the values drop down quickly under higher rotating speed due to cavitation, while the dashed line is fitted by the values that are not affected by cavitation.

Two group of data for speed-thrust-power curves: (a) jet thrust coefficients and (b) torque coefficients versus rotating speed.
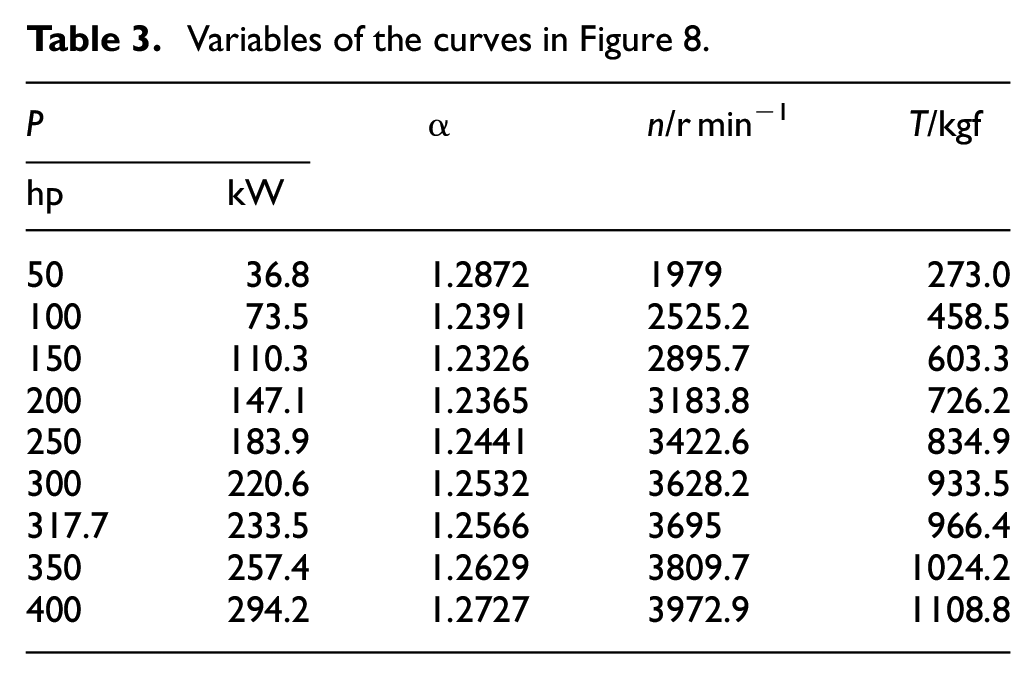
According to equations (1) through (3) and Figure 7, the thrust TR are calculated and the result map is shown in Figure 8. The corresponding variables of the nine curves are calculated and listed in Table 3, in which cavitation is not concerned.

Map of speed-thrust-power curves.
Variables of the curves in Figure 8.
High jet efficiency line
Figure 8 is a system-wide map that is useful to guide the operation of waterjet propulsion for vessels. However, an important issue that ought to be identified is the propulsion efficiency. That is to say, the best efficiency propulsion points (BEPPs) are not indicated yet. For a high performance vehicle equipped with waterjet propulsion, the system efficiency ηS is

The thrust curves in Figure 8 can be collapsed to calculate the system efficiency above against power coefficient CP based on ship speed cV and waterjet nozzle area An,

As shown in Figure 9, it is interesting that the ηS−CP curves have maximum values that are overlapped into Figure 8 with a bold red line to show the optimum operation zone. Figure 9 also indicates that the efficiency is nearly along the same line independent upon the power.
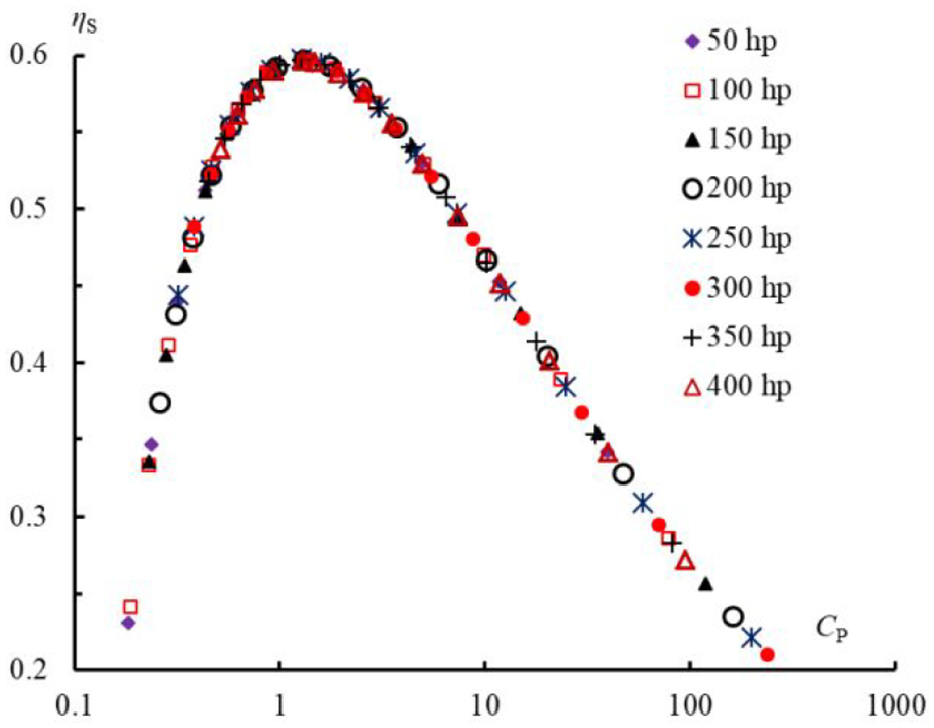
η S–CP curves to show the best efficiency propulsion points (BEPPs).
Cavitation marge
Figure 10 shows the fitted thrust characteristics by the tested results shown in Figure 4, in which the solid line and the dashed line is the tested results while the red dotted line is the extension of the solid one. Due to cavitation, the thrust starts to deviate from the curve of non-cavitation conditions at the shaft speed of 3355 r min−1 and drop down at the shaft speed of 3695 r min−1. Therefore the zone from 3355 to 3695 r min−1 is the region that permitted operation under cavitation conditions. The thrust degradation is normalized and also shown in Figure 10, in which the abscissa is the cavitation number for the device shown by Figure 2 and


Thrust degradation due to cavitation: (a) measured thrust and (b) normalized thrust degradation.
where ρ is the fluid density, ut is the impeller tip speed, pV is the saturated vapor pressure, p1 is the pressure upstream the impeller and is calculated by Bernoulli’s equation. It is noted that the two circles are σ = 0.0422 (n = 3355 r min−1) and σ = 0.0259 (n = 3695 r min−1), respectively, which means that the region between σ = 0.0422 and σ = 0.0259 is the zone that the waterjet propulsion are permitted running under cavitation conditions, while the zone that σ < 0.0259 is the zone that the waterjet propulsion are prohibited running.
Due to the cruising speed of the vessel, the inlet cavitation number of the waterjet propulsion is rewritten as

and it is subsequently noted that with the increasing of the cruising speed of the vessel the waterjet propulsion will get better suction conditions. Combined Figure 10 and equation (7), the speed-thrust-power map curves including the cavitation zone (top left region) are completed. The obvious non-consistency of the curves to the left of the limit σ = 0.0259 (•) displays the complex cavitation instabilities in axial impellers and the bad maneuverability under lower cruising speed so that the waterjet propulsion are strongly commend to be operated far away from this area. 15
Parenthetically, the cavitation limitation line can also be determined by the test loop data. At the shaft speed of n = 3355 r min−1, the performance parameters of the impeller are scaled by that of n = 3000 r min−1 mentioned above and listed in Table 4. As the net positive suction head available (NPSHA) is measured during the experiment, the suction specific speed of the impeller is then determined and also listed in the table. Under the critical point of n = 3355 r min−1, the related variables yield 16

Operation conditions at 3355 r min−1.
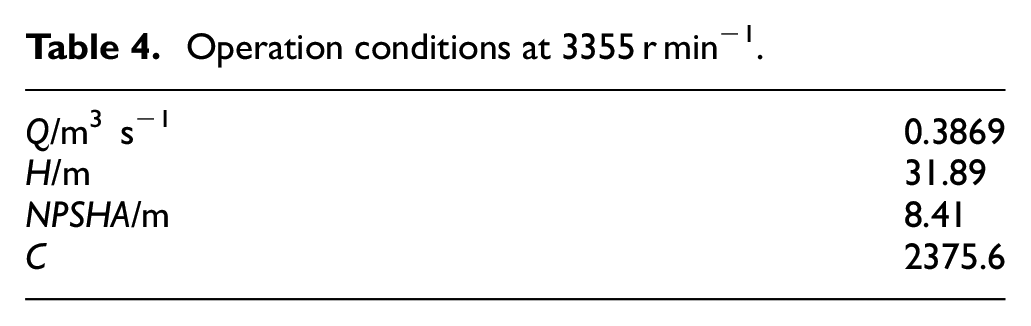
where KC is constant which is related with the impeller and calculated here KC = 1.56. Assuming the center line of the waterjet propulsion is in the free surface during the ship cruising, therefore the NPSHA is

And the critical ship speeds are evaluated by

and illustrated by the dashed line in Figure 8. It is noted that the testing error of the loop data attribute to the discrepancy of the two critical curves, as some extent cavitation has been developed for the loop test that therefore better suction performance is manifesting.
The bench tested thrust results discretely listed in Table 3 are also shown in Figure 8 by the purple diamonds. Therefore, the map can be useful to both the manufacture and the ship owners.
Conclusions
In this paper, the speed-thrust-power curves map of waterjet propulsion was sketched from data by both bench testing and loop testing. It is noted that the non-dimensional torque is the crucial issue that connecting the thrust and the vessel cruising speed.
Three issues of the map are useful to be discussed, the best efficiency propulsion points, the critical cavitation lines and the bad-maneuverability zone. Obviously, the waterjet is recommended to be operated near the best efficiency propulsion points and far away from the cavitation zone as possible. The discrepancy between the two critical cavitation limit lines indicated that there exists error of the traditional measurement of loop test approaches for cavitation. The non-consistency of the curves to the left of the cavitation limit intimates the cavitation instabilities in axial impellers and the bad maneuverability under lower cruising speed. Further, the cavitation zone indicated that the low net positive suction head available was attributed to the bad maneuverability under lower cruising speed.
It is also note that the impeller of the waterjet is somewhat different from the conventional one as the waterjet impeller has an arc-like leading edge and a wide range high efficiency zone.
Footnotes
Appendix
Handling Editor: James Baldwin
Declaration of conflicting interests
The author(s) declared no potential conflicts of interest with respect to the research, authorship, and/or publication of this article.
Funding
The author(s) disclosed receipt of the following financial support for the research, authorship, and/or publication of this article: The research presented has been sponsored by National Natural Science Foundation of China (Grant No. 51879120).