
Abstract
A high altitude test facility was developed for the experimental studies on nozzles for various levels of vacuum. The current study is focused on the performance of the nozzle under various altitude condition and to characterized the high altitude test facility. A supersonic nozzle designed for Mach 2.5 is used for the study. Compressed air is taped from the high pressure plenum having a pressure of 20 bar and is regulated and expanded through the nozzle. The inlet pressures for the study is varied from 4.5 to 10 bar. The nozzle is within the enclosure which is evacuated to 0.7–0.02 bar. Schlieren is used to view the flow condition at the end of the nozzle. A nozzle for 2.5 Mach is designed and tested in HAT facility. The nozzle design is validated with the CFD for various NPR. The high altitude test facility is characterized for various NPR and is found to be optimum flow at 14 NPR for 33 s at an inlet pressure of 4.5.
Introduction
A nozzle is a device that accelerates the flow according to the flow properties at the inlet of the nozzle. Nozzles are used in different industries for various applications like to accelerate the flow for atomization of liquid phase fuel for combustion. Aircraft engines and Rocket engines use nozzles to increase the exit velocity. It is important to optimize the nozzle design to minimize the pressure drop due to increased velocity at Nozzle throat and exit. In many aerospace applications rocket engines are not only used in vacuum space but also inside the atmosphere during the launch procedure. In most cases convergent-divergent nozzles, so called C-D or de Laval nozzles, are used for turning the working fluid’s thermal energy, it has inside the combustion chamber, into kinetic energy in a way that the fluid reaches supersonic speed. Hence the thrust, needed for accelerating the spacecraft, can be provided. The behavior of the various types of C-D nozzles in the presence of an atmospheric pressure in specified heights above ground including both flow conditions inside the nozzle and the free jet behind the nozzle’s exit cross section has been investigated multiple times. An exhaustive overview of the main experimental studies with underexpanded jets. 1 The focus often was on optimization of nozzle geometry with direct design methods like the method of characteristics.2–7 Attempts of nozzle contour optimization were carried out multiple times by means of design methods by analysis including multi-physics CFD simulations together with numerical optimization tools, so called multidisciplinary optimization, but only with respect to the flow inside the nozzle.8–12 with respect to simple fabrication, a conical C-D nozzle is chosen. Experimental studies and large eddy simulations for the case of conical nozzles with different design Mach numbers were carried out for under, over, and perfectly expanded free jets, leading to double and double-diamond structures containing Mach waves originating from both the nozzle throat and its lip.13–15 it is recommended to not adjust the altitude chamber pressure below 300 mbar for flow separation studies. 16 A lower diverging angle and no elongated throat gave the best critical pressure ratio and a low pressure drop.3,17 The results from the present study therefore emphasize the fact that data from cold gas tests should be interpreted with caution. Especially when comparing results from sea-level conditions with those carried out inside the high-altitude chamber. 18 Scaled back pressure fluctuations can only be achieved with surrounding chamber systems it is mandatory to decouple the transition process and the described nozzles impulse decay. 19 The most sensitive parameter that influences the stagnation pressure needed for diffuser starting is the second-throat diameter. Between the throat and exit diameters of the nozzle, there exists a second-throat diameter value that corresponds to the lowest stagnation pressure for starting.
In the present work a C-D nozzle for Mach 2.5 is being studied for operating in an ambient pressure equal nominal pressure ratio of 5–27. After centerline quantity distributions are being determined by means of one dimensional, isentropic theory, CFD investigations are carried out. Subsequently an experimental examination is carried out in the High Altitude Test facility (HAT). In the experimental setup as the vacuum chamber is having a fixed volume the experiments are carried out at various pressure ratios to determine the optimum pressure ratio for a period of operation.
Known quantities
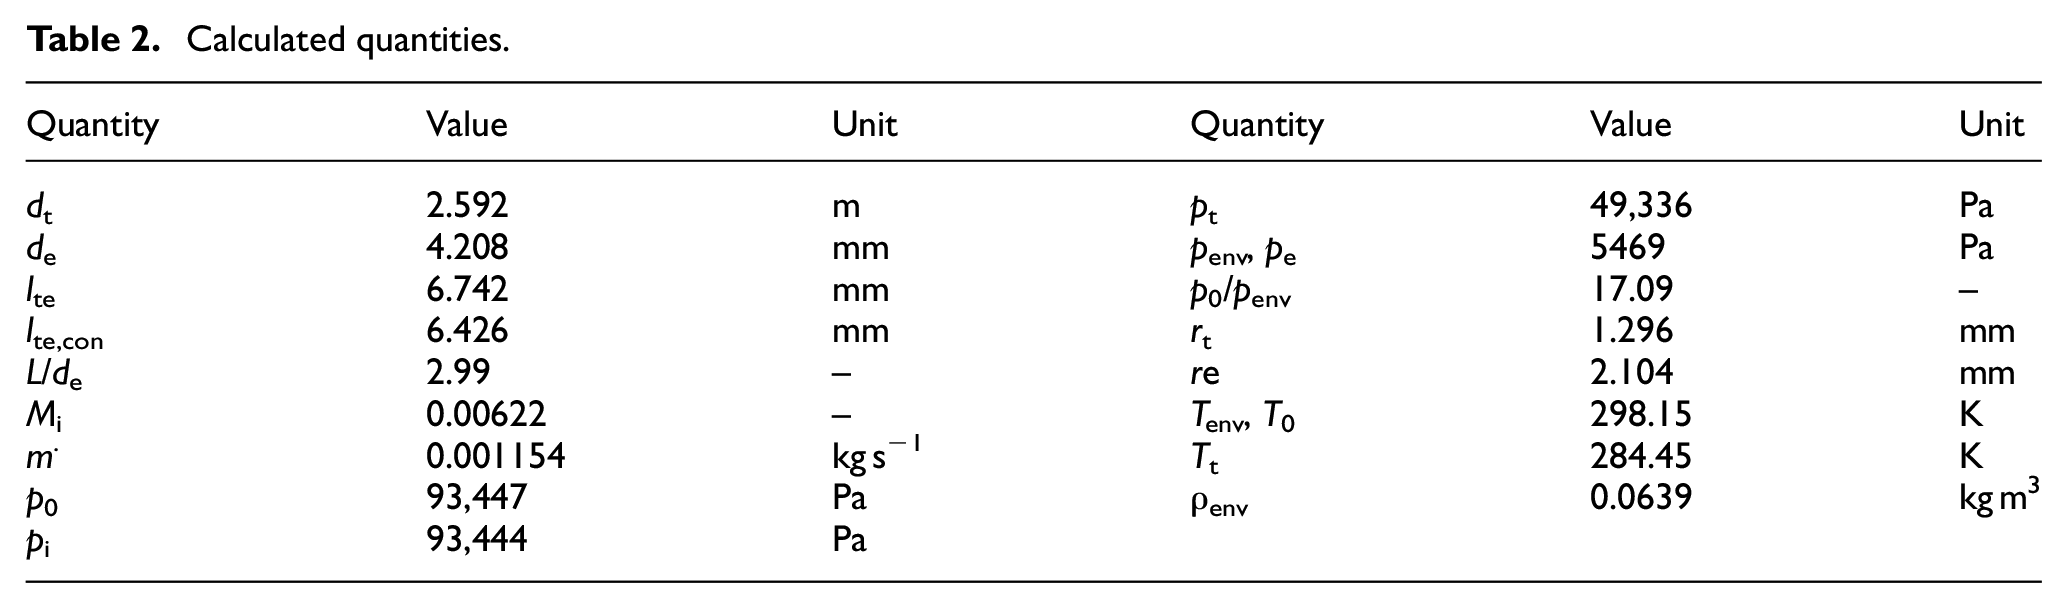
The nozzle is designed for the optimum operation at an environment pressure equal to the atmospheric height H. The standard conditions of the air are given by standard pressure ps and standard temperature Ts. The design exit Mach number of the supersonic nozzle is Me,d is chosen. The half angle of the conical divergent nozzle part is chosen to a relatively small value because the divergent nozzle part would be very tiny otherwise. The inlet radius, ri, is determined by the size of the inlet pipe to the vacuum tank. V.vp is the volumetric flow, the vacuum pump can provide. The ratio of the throat contour curvature radius to the cross-section throat radius is set to a value of Rc,t/rt with respect to its positive influence on the flow coefficient. 1 The resulting values of this section are concluded in Table 1. Table 2 shows the calculated quantities for design optimization of nozzle.
Known condition quantities.

Calculated quantities.
With the analytic formulation of the wall contour and the basic formulae of gas dynamics one is able to calculate the distributions of flow quantities inside the nozzle for the assumption of an isentropic, one dimensional behavior. The variation of area ratio, pressure ratio, density ratio, temperature ratio, and Mach number along the nozzle axis is shown in Figure 1.
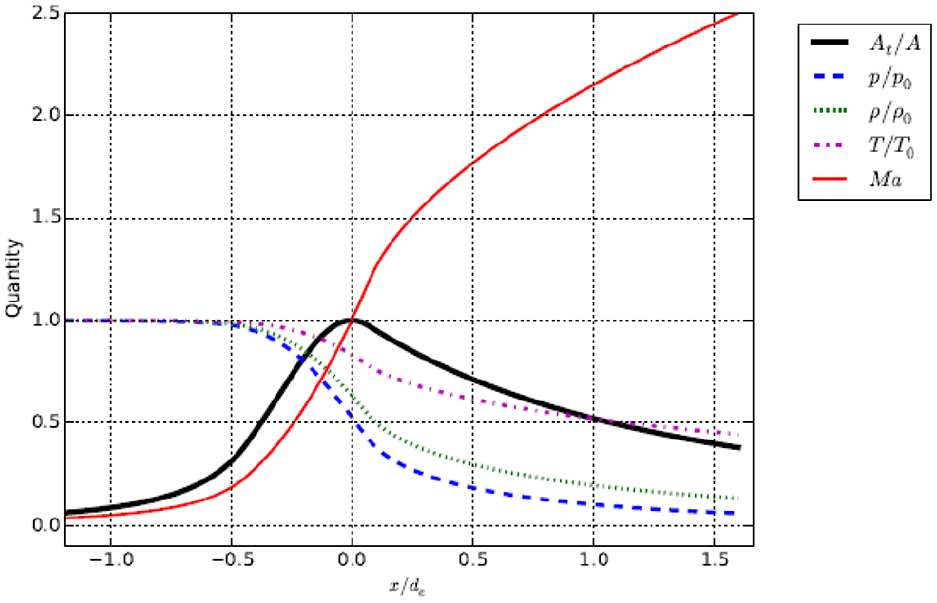
Characteristic quantity ratios and Mach number inside nozzle, 1D isentropic.
Experimental set-up
The HAT is located in the Propulsion and High Enthalpy Laboratory of the Karunya University. A schematic of the whole setup is shown in Figure 2. The high altitude test facility consists of a high pressure compressor. The compressors are two stage compressor used to pressurize high pressure plenum. The high pressure plenum is 8 m long and 1 m in diameter. The central part of the HAT is the vacuum tank. It is being evacuated by the vacuum pump to provide the required pressure. Inside this tank the nozzle and free jet region are located. It is equipped with two oppositely located windows in order to offer a path for the light beams of the Schlieren system. The nozzle is connected to the inlet pipe and thereby to the valve, outside of the vacuum tank. Its purpose is to control the required inlet pressure.

Experimental setup including HAT and Schlieren system.
The high altitude test facility (HAT) is set up, together with the pressure measurement system and the Schlieren system. 14 In order to visualize the flow including the characteristic shock diamond formation in the free jet region behind the nozzle, the Schlieren system is being used. A schematic of its basic structure is contained in Figure 8. The light originates from the light source, equipped with a slot, and enters a concave mirror. It is reflected in a way, that the beams are parallel and pass the test section perpendicular to the flow direction. On the opposite of the vacuum tank a similar, concave mirror bundles the light. Exactly at the focal point a sharp edge is located. Behind that the light falls onto the screen where the resulting images are made visual. Changes in the density in the free jet region lead to deflection of the parallel light beams. The corresponding beams will either be stopped if they reach the sharp edge or pass it at greater distance than normally. Therefore the region of large density gradients will appear relatively dark in the image while neighboring spots appear brighter. In this way the shock diamond formation is made visible. The resulting image is being taken from the screen with a CANON 700D digital camera. The Schlieren images turned out to have a really low contrast at the specified design conditions because of the low density. Hence, the photographs are taken from conditions with higher pressure levels but the same pressure ratio as determined in the design process.
Numerical investigation
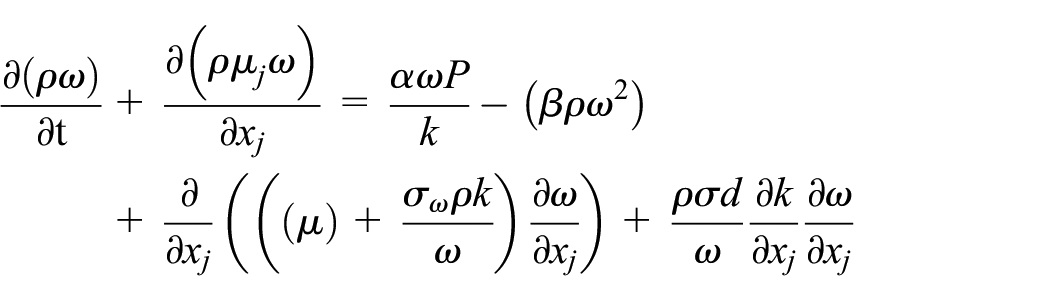
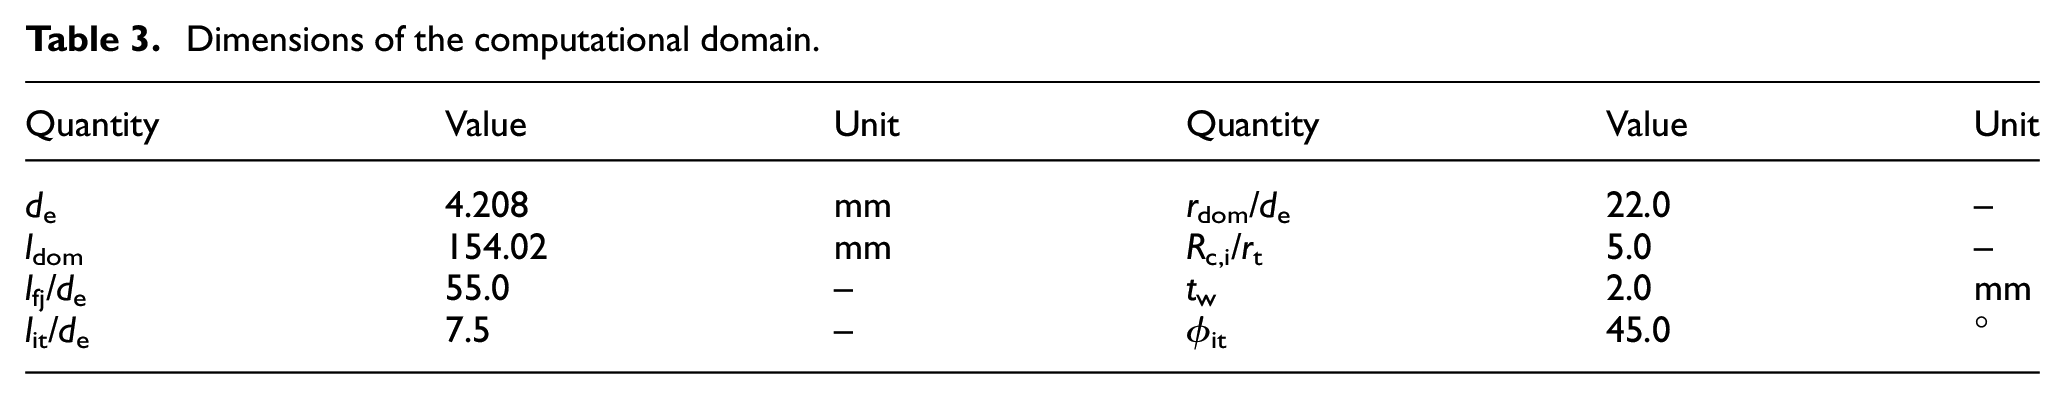
The numerical investigation is carried out, using ANSYS Gambit 2.4.6 for meshing and ANSYS Fluent 16.2 for solving and post processing. Computational domain the problem of a single supersonic, round nozzle is assumed to be two-dimensional, axi-symmetric without any swirl and steady-state. The behavior is equal to the result of a 3D approach with all the mentioned models because the axi-symmetric treatment takes the three dimensional effect into account. Therefore the 2D domain is bounded by the rotational axis on the bottom side. The inlet is determined to be a pressure inlet, the nozzle walls are adiabatic, no-slip walls. All the remaining domain boundaries are treated as pressure outlets. The coordinate system’s origin is located at the throat position of the rotational axis. The domain reaches ldom and rdom in stream wise and radial directions, respectively. The overall dimension of both inlet and convergent nozzle parts is named lit, the divergent one is lte long. The free jet region behind the exit plane has the dimension lfj in stream wise direction. The inlet pipe and the conical convergent nozzle section are connected by the inlet curvature radius Rc,i; the convergent part’s half angle. The nozzle’s wall thickness is tw. A schematic view of the domain including coordinate system and dimensions is shown in Figure 3, the values are presented in Table 3. For spatial discretization a structured mesh with exclusively quad cells was created. Region of the finest mesh is the portion of the main flow region, reaching from the throat to a distance of 7.5 de behind the exit of the nozzle. The wall boundary layer is resolved with a wall next cell size of approximately y+ = 1. Therefore the 2D mesh consists of approximately 270,000 cells. The mesh used for the investigation is shown in Figure 4. Models and Numerical Setup Air, treated as ideal gas, is chosen as fluid for the present investigation. To deal with turbulent effects, the standard K − ω-turbulence model by Wilcox 12 is used together with compressibility effects and shear flow corrections. To give consideration to the solution, evolving with time and flushing out fluid portions with unphysical characteristics, this case is treated as pseudo transient with a time scale factor of 0.5. The density-based solver together with the AUSM formulation for fluxes was chosen. Discretization and gradient schemes are second order for both flow and turbulence quantities and least square, cell based, respectively. Higher order term relaxation is turned on for flow variables with a factor of 0.25; explicit relaxation factors are 0.75 for K and ε and 1.0 for νt. The problem is very sensitive to sudden changes in the pressure of the boundary conditions. This would be the case, if one would initialize the fluid domain, taking the environmental quantities, and starting to iterate with full inlet pressure. To avoid such an unphysical behavior, the inlet pressure was raised from environmental to target inlet conditions with a stepped ramp. K − ω model is used so that boundary layer and flow separation can be predicted very easily for different nozzle pressure ratios. Better prediction of adverse pressure gradient is the reason for using K − ω model for visualizing the flow in Ansys. However, it is used for low Reynolds number flow prediction, better results for flow models inside the nozzle. SST and BSL would be more specific than standard Wilcox model.

Computational domain with coordinate system and boundary conditions.
Dimensions of the computational domain.
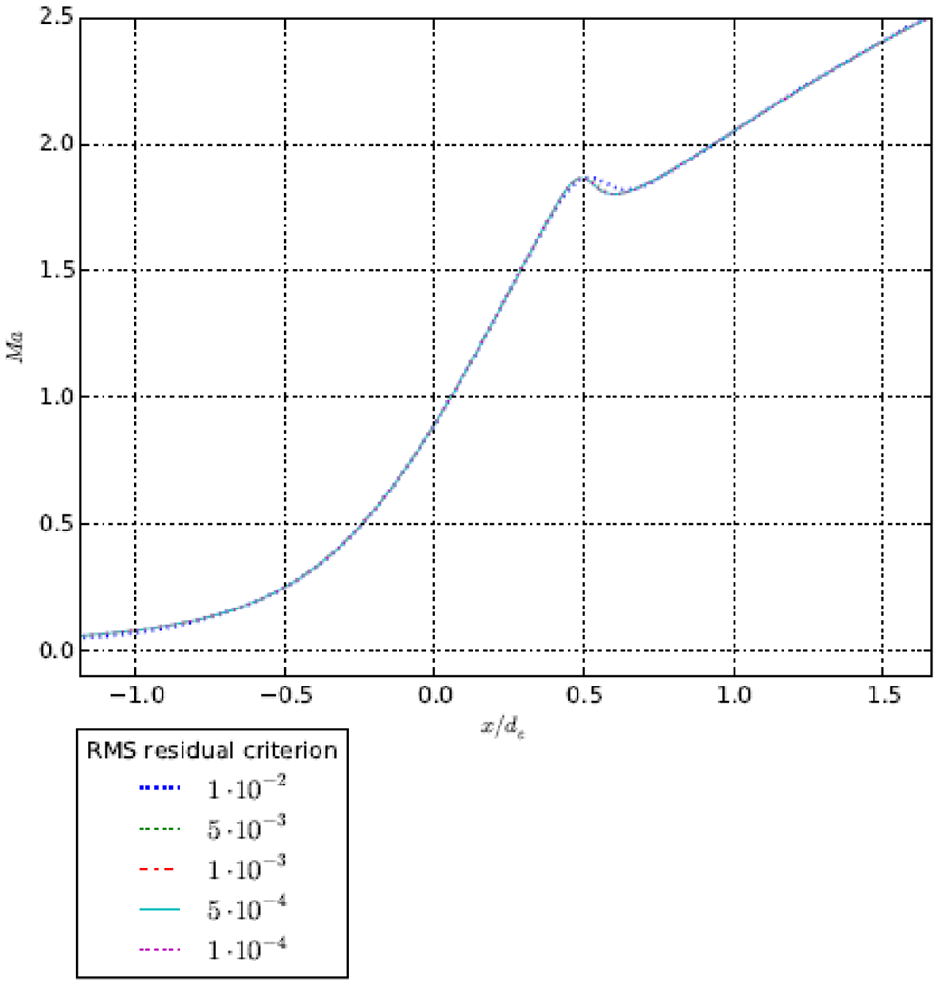
Centerline Mach number distributions in the nozzle region for iteration study.
Advantage of using K − ω model is that boundary layer and flow separation can be predicted very easily for different nozzle pressure ratios. Better prediction of adverse pressure gradient is the reason for using K − ω model for visualizing the flow in Ansys. However, it is used for low Reynolds number flow prediction, better results for flow models inside the nozzle. SST and BSL would be more specific than standard Wilcox model.
In order to proof independence of progress of iteration, the Mach number distributions at the symmetry axis are compared to each other for five different residual level criteria reaching from 1 × 10⁻² to 1 × 10⁻⁴. Scaled, RMS residuals are being used. The comparison of the results is shown in Figures 5 and 6 for the nozzle and the free jet region, respectively. A deeper convergence level only leads to minor changes in the Mach number distribution in the nozzle region. Only the dent at x/dd gets more significant with further iterations. This feature will be explained in section 6. Looking on the centerline Mach number distribution downstream of the nozzle one will notice far more significant changes with deeper Convergence level. With further iterations the peak values get higher and the shock cell structure persists further downstream. In the region far downstream of the nozzle the Mach number increases the most with deeper convergence level. Results with applied residual criteria 5 × 10⁻⁴ and 1 × 10⁻⁴ show almost no differences. Further iteration is assumed to give negligible changes. Therefore the convergence level of 1 × 10⁻⁴ is applied for following investigations.

Centerline Mach number distributions in the free jet region for iteration study.
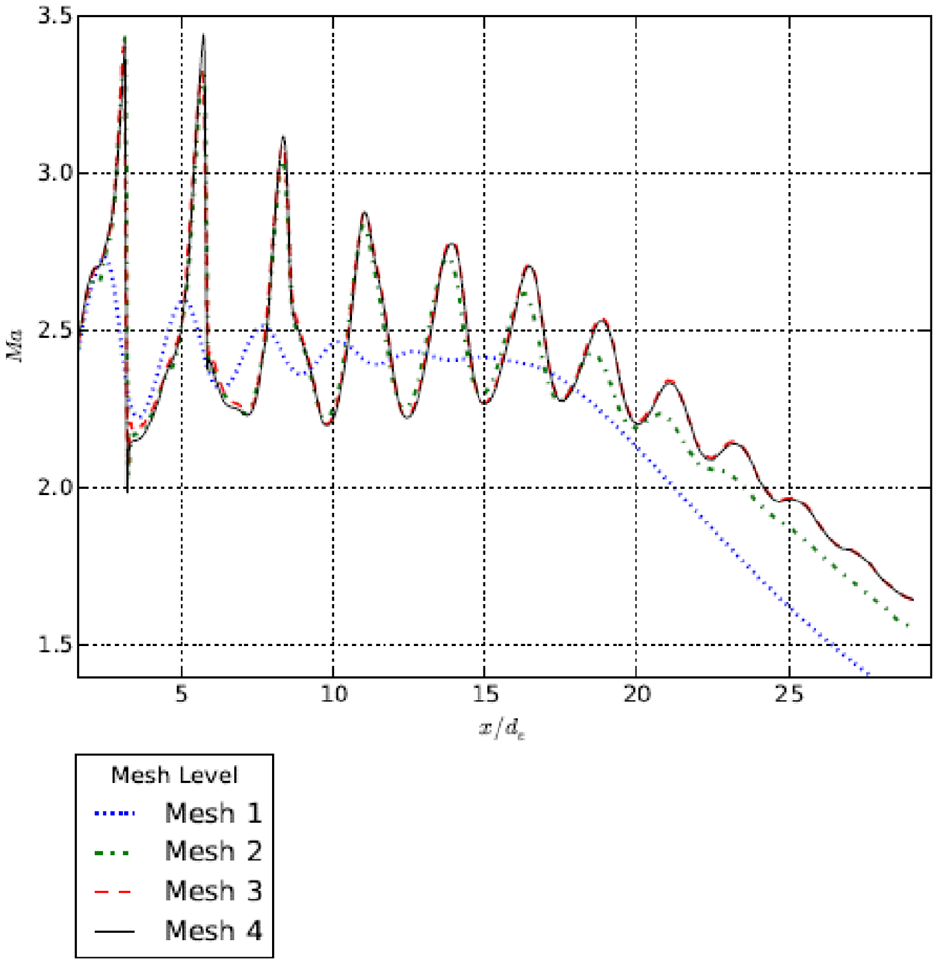
Centerline Mach number distributions in the free jet region for discretization study.
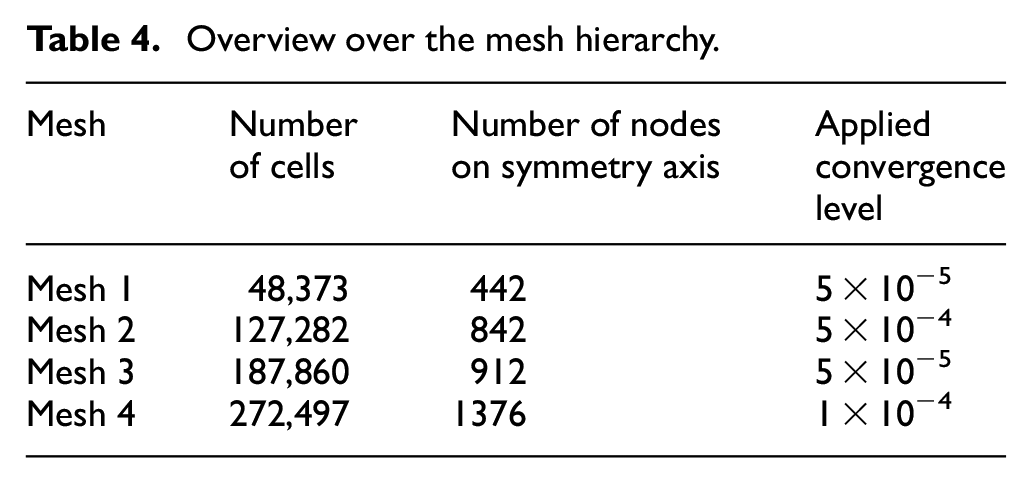
Discretization error. After the sufficient convergence depth has been determined, the impact of the discretization level on the results shall be proven to be negligible. Therefore a hierarchy of four different meshes for the same geometric dimensions has been created. Mesh 4 is the one described above and has been used for the convergence study. An overview over the mesh hierarchy is given in Table 4. Due to the changes in the results be much more significant in the free jet region only.
Overview over the mesh hierarchy.
These data will be taken into account for the present discretization study. The centerline Mach number distributions obtained with all four meshes of the hierarchy are shown in Figure 6. Between the results, obtained with Meshes 1 and 2, significant changes in the peak Mach number values can be stated and the mean Mach number at the region far downstream also decreases with mesh refinement. Applying the finer Mesh 3 only minor changes are observed in the region of stronger shocks directly behind the nozzle but the Mach number is furthermore increasing in the shock less, downstream region. Comparing results from Meshes 3 and 4, no significant changes of the Mach number distribution can be stated. Hence the solution is expected to change not any more with further mesh refinement but is assumed to be independent of the discretization. Therefore Mesh 4 is being used for the numerical investigation turns out that the determined Mach number at the exit of the nozzle, Me, has a relative difference of −1.28% to the design value, Me,d. Therefore the CFD results are in very good agreement with the analytical values.
Results and discussion
Under expansion
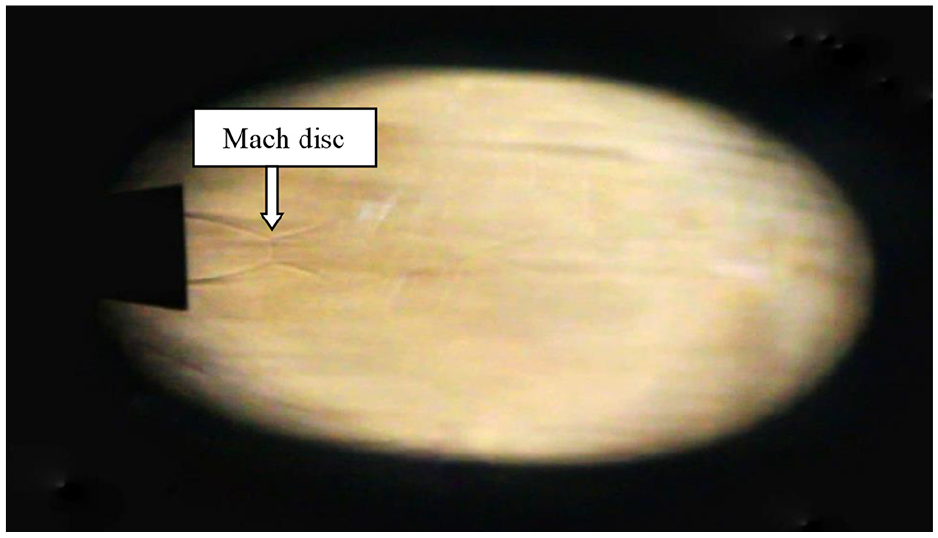
In Under-expansion condition exit pressure of the nozzle is higher than the Chamber pressure which leads to the plume formation at the exit of the nozzle. Prandtl – Meyer expansion waves after reflection from the free boundary converges into oblique shock leading to normal shock formation. The slip line separates the sub-sonic region behind the Mach disc and the super-sonic region after oblique shock. Oblique shock after hitting free boundary becomes Prandtl – Meyer expansion waves. Unlike characteristics are observed at the wave or shock hitting free boundary. Pa is noted to be the chamber pressure for the condition simulated inside the chamber. Here, altitude conditions of 13 km is simulated and observed. Nozzle designed for 10 km altitude can be observed with Under-expanded shock condition at the Exit.
From Figure 8. we can clearly see the plume very next to the exit. Mach disc can be seen Pi– 450,000 Pa and typical schematic diagram of Under-expansion wave is seen in Figure 7.
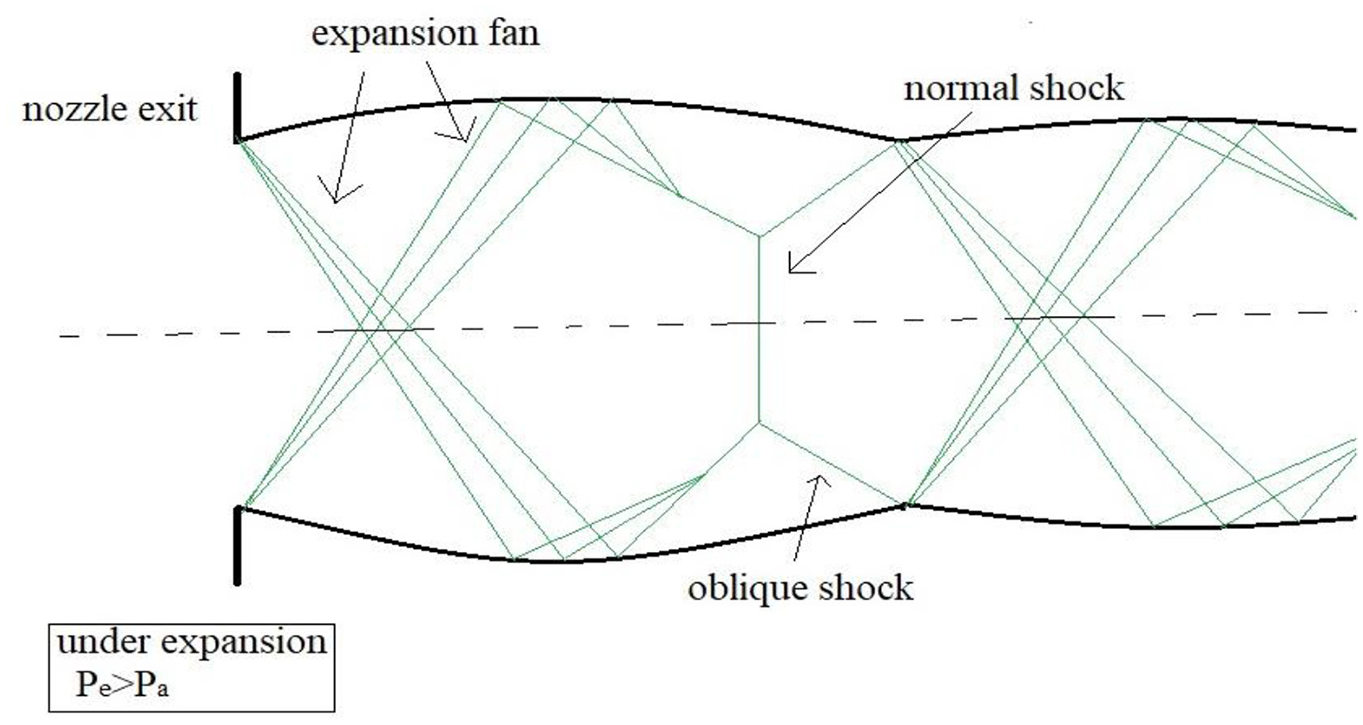
Under expansion pattern of shocks.

Under expanded shock observed in schlieren technique.
Over-expansion
Over expansion wave is observed as shown in Figure 9. The chamber pressure further increases. Pe is higher than Pa. Oblique shock is seen at the exit of the nozzle. Diamond formation is seen. Mach disk that creates the subsonic region is observed. A graphical representational of the values makes a clear visual analysis of the data 1. The valves are opened manually and hence a slow increase in chamber pressure can be seen in pressure in Figures 10 and 14 and mass flow rate in Figure 12. This has also resulted in a increase on NPR initially and then decreased as shown in Figure 13.

Over expansion pattern of shocks.

Variation of chamber pressure with respect to time.
Over expanded shock observed in schlieren technique.

Mass flow rate versus time.

NPR versus Time.
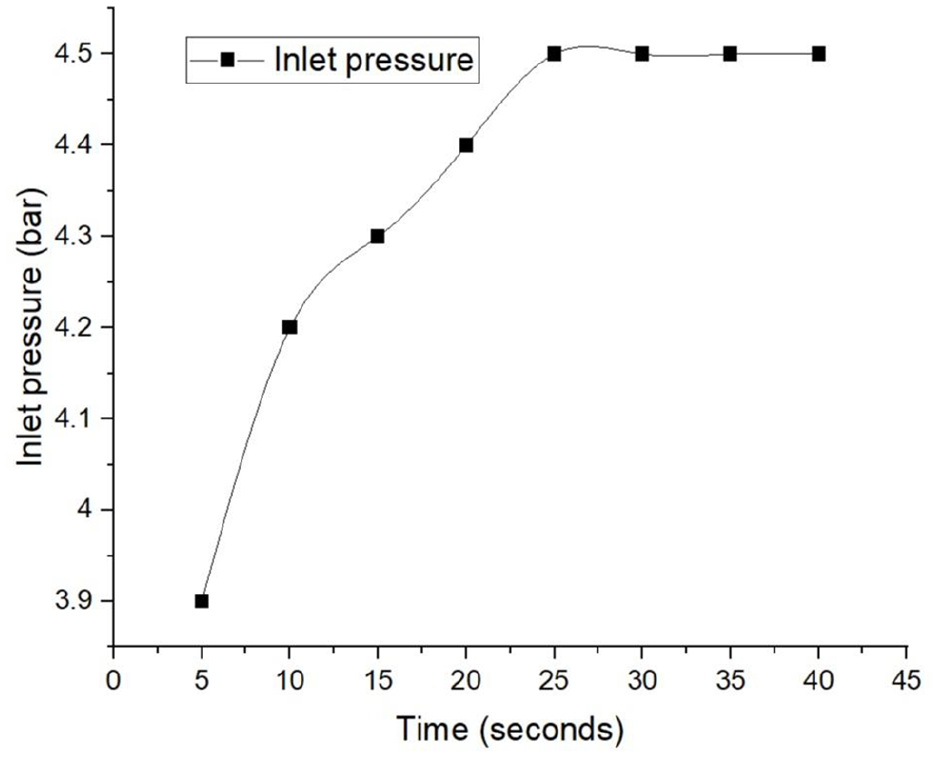
Inlet pressure versus time.
The above graph shows the increase in pressure in the vacuum chamber. The inlet mass flow rate to the chamber is higher than the suction rate of the vacuum pump. This increases the chamber pressure Pa. All three under expansion, over expansion, and optimum flow is observed.
Nominal pressure ratio of the nozzle varies accordingly. Maintaining a Constant inlet pressure (Pi) is done after 25 s of time. This leads to increase in chamber pressure with varying inlet pressure. After constant inlet pressure Nominal pressure ratio tends to decrease and optimum NPR of 17.03 is observed. NPR further decreases as pressure of the chamber increases.
The above graph shows the time taken to maintain constant inlet pressure to be maintained to the chamber. Inlet pressure (Pi) is maintained to be 4.5 bar.
Nozzle region
In Figure 15 the flow quantities inside the nozzle from CFD and isentropic investigations are shown for direct comparison. The CFD data are obtained from the centerline distributions. It turns out that the three dimensional nozzle meets the design conditions very well with a relative deviation in the exit Mach number Me of −1.28% compared to the design value Me,d. In the region up to the convergent nozzle part close to the inlet the air is accelerating faster than predicted by the isentropy theory. The reason for this behavior is the evolving pipe flow. The pressure inlet is determined to have a constant pressure distribution over the whole cross section following in a constant inlet velocity which is not an exactly assumption in terms of physical conditions because of the long inlet pipe that will be located upstream in the experiment, leading to a fully developed pipe flow. In the short inlet portion inside the computational domain the pipe flow starts to develop, leading to an increased center velocity. This behavior changes in the conical convergent section at x/de ≈ −0.5, where the effect of the cross section reduction becomes more important than the boundary layer effect described before. The steep wall in thin section leads to a negative pressure gradient component in the wall normal direction causing the boundary layer to be extremely thin here. The acceleration of the fluid happens in the wall near region first and is spreading out to the center region which needs time while the flow moves on. Therefore the center line velocity is lower than it should be theoretically. In the throat region with throat contour curvature radius Rc,t the velocity increases more rapidly than before because the speed of sound has to be reached in the smallest effective cross section by definition. It is located a little bit downstream of the nozzle’s geometrical throat position. The reason is the shifted acceleration mentioned before and the fact that the boundary layer starts growing again more rapid because the wall is less steep. The thick boundary layer produces a smaller effective cross section area. From here the flow continues to accelerate because the influence region of the beginning of the conical divergent wall part is shifted downstream towards the center line. The connection between the throat curvature radius and the conical divergent nozzle portion represents a discontinuity in the second derivative of the wall curvature function. From this point a Mach wave expands that hits the center line just at x/de ≈ 0.5. It functions as weak, oblique shock, decelerating the flow to a lower supersonic Mach number. This causes the dents in all of the quantity distributions, seen in Figure 10. Afterwards the acceleration is going on due to further increase of the cross section until the exit Mach number is reached. The viscous effects in form of the boundary layer displacement thickness seems to have a minor effect on the main nozzle parameters as the design exit Mach number is met quite exactly. All the described observations can be confirmed by analysis of the pressure, temperature, and density ratio distributions at the centerline. They behave in relation to the Mach number distribution as expected.
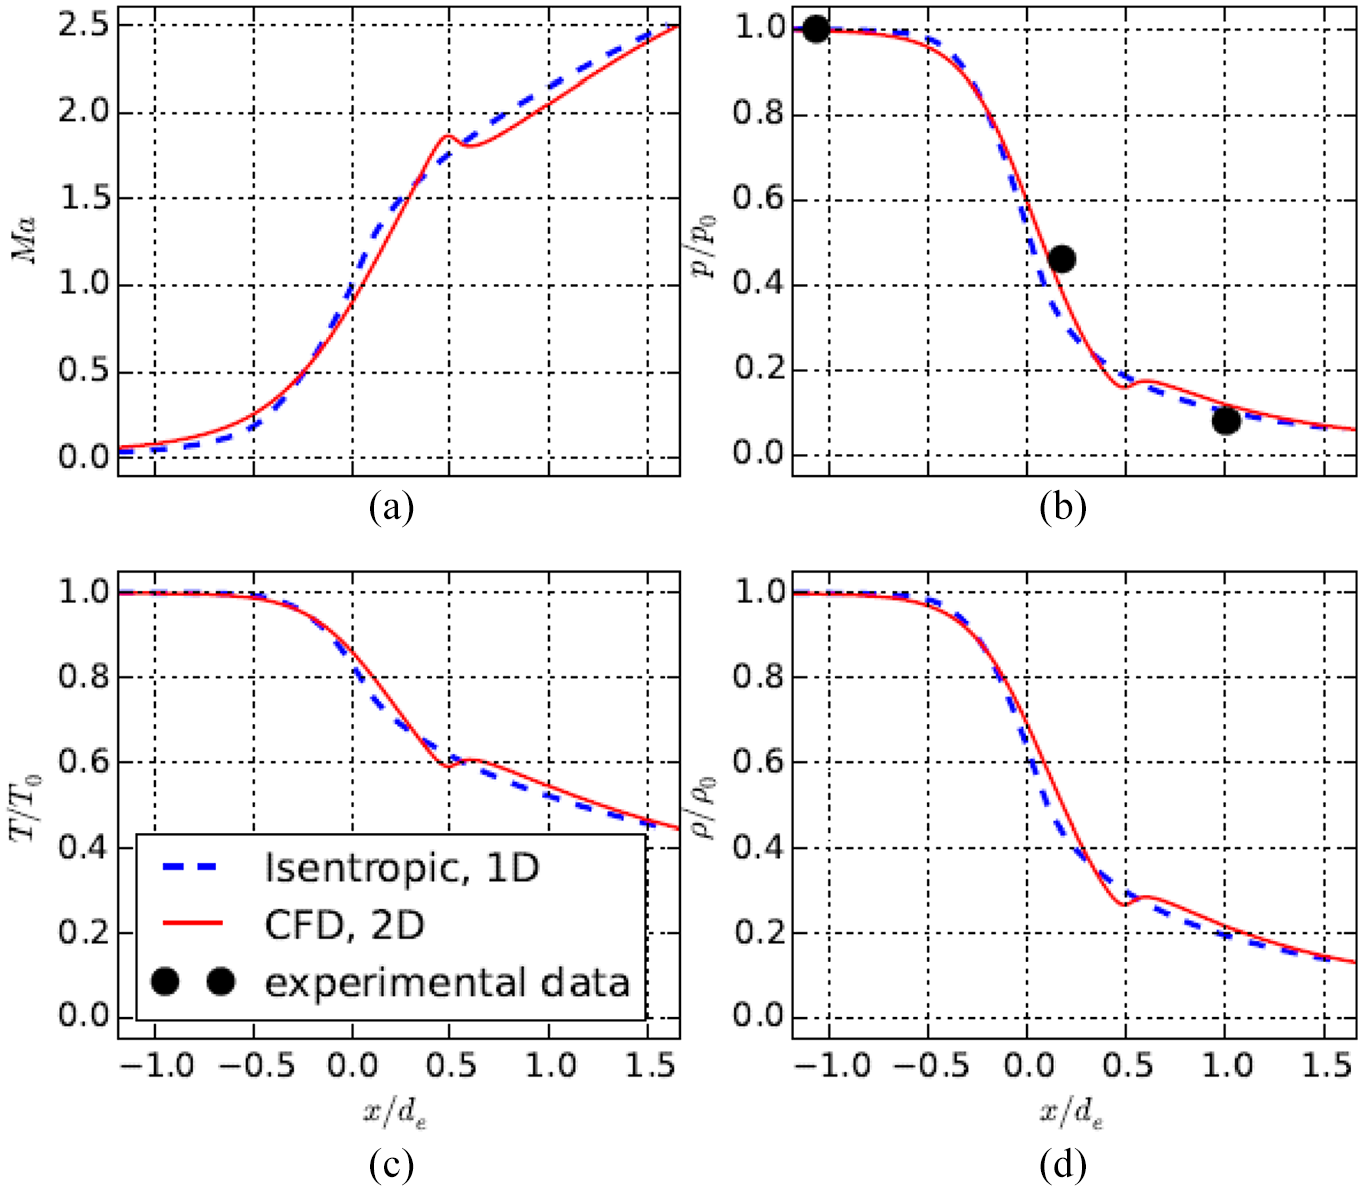
Center line distributions inside the nozzle, obtained with CFD and isentropic relationship: (a) Mach number, (b) pressure ratio, (c) temperature ratio, and (d) density ratio.
The pressure data from the experimental investigations show good agreement with the theoretical and CFD results. Hence, the nozzle seems to work the way it was designed for. The pressure data inside the nozzle is independent from the nozzle pressure ratio (NPR) under the condition that the NPR is high enough not to create a normal shock in the divergent nozzle part. Such a behavior could not be observed at any time during the investigations, since the static pressure at the nozzle exit does never exceed the pressure at the nozzle throat. This behavior would be compulsory if a normal shock is present.
Free Jet Region the center line distributions of the relevant quantities are shown in Figure 12. It can be seen clearly that the Mach number drops in periodical distances from the nozzle exit to lower supersonic values. This indicates the presence of weak, oblique shocks, slowing down the flow before it accelerates again to almost the same value it had before the drop. The maximum Mach number of the center line distribution is at the same time the absolute maximum Mach number occurring in the whole domain with a value of Mmax = 3.42. With the stream wise distance from the exit increasing, the velocity drops happen less steep but more continuously instead while the distance between them decreases. The Mach number differences caused by shock get smaller and the Mach number in general decreases. This are features of the shock cell structure that is typical for the supersonic free jet from a conical nozzle caused by the radial velocity component of at the exit plane. So it appears not only for over or under expanded jets but also in the design operation point. 13 The decreasing shock cell length is due to the entrainment of environmental air, which the jet’s core region loses momentum to while mixing. The Mach waved is being reflected both at the center line and on the core region border. As the jet gets thinner, the Mach waves are reflected earlier leading to a shortening of the shock cells. Right behind the nozzle exit at x/de ≈ 2.5 a dent in the Mach number distribution similar to the one in the divergent nozzle part is being recognized. The reason for this behavior is also a Mach wave but because of the short distance to the exit plane the wave’s origin has to be located inside the nozzle. Hence the Mach wave, described in the last section, is being reflected at the center line and the nozzle wall inside the divergent nozzle part. The phenomenon was already observed before 13 and so called throat shock. The difference in the referenced paper is that the shock was stronger in comparison to the one in the present work because of the use of a sharp throat corner instead of a contour radius. This throat shock will interact with the shock originating from the exit plane, called lip shock, creating a double diamond structure that still sustains far behind the exit even it will be weaker in this case. It was not possible to capture this feature in this study due to the mesh being still to coarse in the region of interest. Therefore the throat shock can barely be spotted in contour plots directly behind the throat and not any more after its reflection. But it still has a slight influence on the centerline Mach number distribution.
Results from both CFD and Schlieren images are shown in Figure 16 for direct comparison. Though the pressure values show that design pressure ratio is met, the photograph shows shock cells that are larger than predicted by the CFD investigation. The first half shock cell reaches from the nozzle exit to the tip of the first cell without shock in the free jet region. Its length predicted by CFD is 1.837 de while the Schlieren graph shows a first cell length of L = 2.816 de. It is assumed that this happens due to the pressure measurements being unreliable. The average length of the first two full shock cells in the CFD results is 2.679 de. The length of the first complete shock cell in the Schlieren graph is determined to L = 3.61 de.
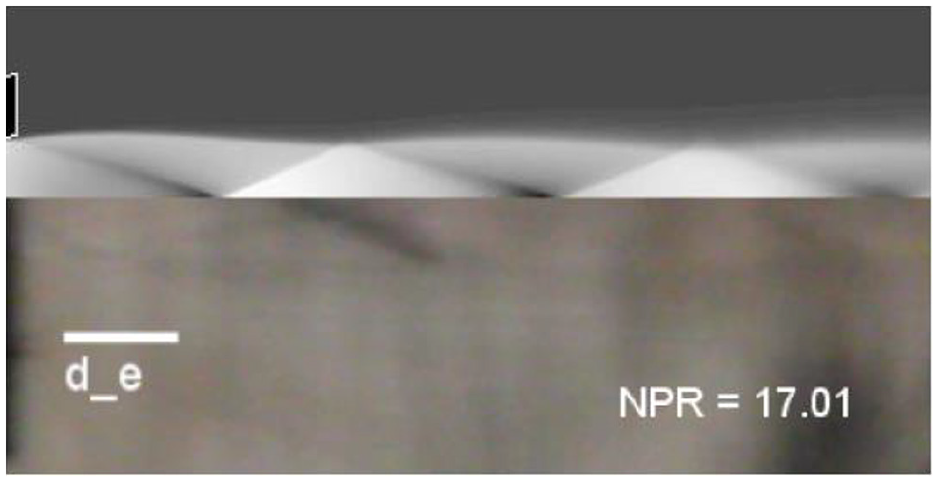
Comparison of CFD results (top) and Schlieren image (bottom) at a pressure ratio of perfect expansion according to the pressure measurements.
Hence the CFD results are much closer to the theoretical value of 2.99 de from section 3 than the ones obtained with experimental investigations. That predicted cell length is shorter than the theoretical value has already been stated in. 13
A fitting shock cell length could be found for a NPR of 10.14. The image is shown in Figure 17. In this photograph it can clearly be seen, that a second shock is leaving the exit of the nozzle building a double diamond shock formation. Since the shock is being reflected at the boundary of the free jet its origin must be located inside the nozzle. For determining the shock cell length only, the first, so called lip shock, is taken into account. If the other shock really expands from the nozzle throat as predicted by the CFD simulation and explained earlier in this section or if another disturbance in the nozzle contour is cannot be answered with the obtained data. Figure 16 shows a strongly over expanded free jet. The NPR is 5.10. The average length of the first three full shock cells is determined to be 1.77 de. The Schlieren image of an under expanded free jet is shown in Figure 17. Its shock cell length is 4.358 de.

Comparison of CFD results (top) and Schlieren image (bottom) for fitting shock cell length.
Conclusion
The studies are carried out to determine the characteristics of the nozzle for various NPR in the high altitude test facility. The nozzle is designed for Mach 2.5 and characterized for area ratio, pressure ratio, and temperature ratio. The simulation is carried out using CFD package ANSYS Fluent 16.2 and is also validated with the isentropic relationship. The mesh independent study is also carried out and it is found that the mesh cell of 272,497 is considered for further investigations. Solutions of all important quantity distributions both inside the nozzle and in the free jet region were obtained. The nozzle flow fits very well to the analytical results. Pressure measurements inside the nozzle and Schlieren images of the free jet region were obtained with the pressure scanner and the Schlieren system, respectively. The high altitude test facility is characterized for various NPR and is found to be optimum flow at 14 NPR for 33 s at an inlet pressure of 4.5. The operating duration for 25–10 NPR window is obtained with maximum inlet pressure of 4 bars in 15 s. All the three conditions are noted in the nozzle flow optimum, underexpanded and overexpanded flow at various NPR. The comparison of the Schlieren images with the computational results confirm that at NPR = 17.09 the jet is still under expansion. A fitting shock cell length could be found for a NPR of 14.66 also images of under and over expanded free jets have been obtained with NPRs 19.15 and 5.10, respectively.
Footnotes
Handling Editor: James Baldwin
Declaration of conflicting interests
The author(s) declared no potential conflicts of interest with respect to the research, authorship, and/or publication of this article.
Funding
The author(s) received no financial support for the research, authorship, and/or publication of this article.