
Abstract
In the present study, based on the previous impact resistance test study results regarding stainless steel reinforced concrete beams, six steel fiber stainless-steel reinforced concrete (SFSRC) beams were subjected to drop-hammer impact tests using an advanced ultra-high heavy multi-function drop hammer impact test system. The goal was to further investigate the mechanical properties of SFSRC beams under impact load conditions. The influencing effects of the steel fiber content and impact velocity levels on the impact resistance mechanical properties of SFSRC beams were analyzed. A digital image correlation method (DIC) was used to analyze the full-field strain and displacement values of the specimens. The results revealed that the steel fibers had significantly enhanced the overall energy dissipation and crack resistance capacities of the specimens, and also improved the brittleness of the stainless steel reinforced concrete beams. In addition, the addition of steel fibers effectively inhibited the local damages of the beam-hammer contact areas. In this study’s experiments, the impact resistance of the beams was observed to be the highest when the fiber content was 2.0%. The internal force formula of the local response stage of the beams showed that the shearing effects had significant impacts on the overall failure modes of the specimens. It was found that with the increases in impact velocity, the failure mode of the SFSRC beams transitioned from bending failure to shear failure, and then to a punching shear failure mode. The DIC results indicated that the addition of steel fiber improved the bonding performances between the concrete matrixes, along with inhibiting the crack development rates through the bond force between the fiber and the concrete.
Introduction
Reinforced concrete structures are known to be vulnerable to corrosion when applied in marine engineering environments. In addition, they may be frequently impacted by falling goods and ship docking processes during their service lives, resulting in the partial or overall collapsing of buildings due to loss of load bearing balance.1,2 However, it has been found that the addition of steel fiber can enhance the overall toughness of the components, 3 and good toughness is conducive to the absorption of impact energy. Therefore, on the basis of solving the problem of steel corrosion, it is very important to study the impact resistance mechanical properties of SFSRC structures.
In recent years, researchers in China and internationally have conducted many investigations regarding the dynamic responses of RC beams under impact load conditions. Bin and Xiang 4 examined the influencing effects of different impact velocities and weights on the dynamic mechanical properties of RC beams through drop-hammer impact tests, and emphatically analyzed the crack development processes and changes in failure modes during the tests and discussed the eigenvalues of impact resistance bearing capacities. Zhao et al.5,6 studied the local response stages of RC beams based on drop-hammer impact tests and numerical simulations, and then proposed an empirical formula of internal force calculation of beams under impact loads, along with an evaluation method based on section damage factors. Zhao et al. 7 determined through the drop-hammer tests that the impact energy consumption was more evident for the local damages of beams with decreased drop-hammer velocity and increased impact velocity. In the aforementioned study, an empirical formula for the maximum deflection of beams in the middle of a span after impact was proposed. Due to the superior performance of stainless-steel bars in strength and corrosion resistance, some researchers have carried out experimental studies of stainless-steel concrete beams based on the research of RC beams. Zhang et al. 8 carried out pseudo static tests on stainless-steel reinforced concrete beams. The results of the aforementioned tests were then compared with those of RC beams. It was found that the yield displacements, ultimate displacements, and displacement ductility coefficients of the stainless-steel beams were significantly increased. In addition, the ductility performances were improved, and the degradations of strength and stiffness were observed to be relatively gentle. In another related study, Zhou et al.9,10 carried out drop-hammer impact tests of equal strength and equal section stainless-steel longitudinal bars instead of RC beams, and found that the stainless-steel beams were superior to RC beams in terms of impact stiffness and deformation resistance. However, it was also pointed out that the brittleness of the stainless-steel beams was obvious when the impact energy was high, and ordinary concrete tended to fail prematurely due to insufficient bearing capacity before the stainless-steel bars could play their role. Therefore, it is necessary to improve the impact bearing capacity of stainless-steel concrete structures.
However, as a new type of multiphase composite material, steel fiber reinforced concrete has displayed good mechanical properties in regard to tensile property, bending performance,11,12 ductility, and impact resistance.13–16 Furthermore, and has been proven to enhance the overall durability of specimens by inhibiting cracking processes and the development of cracks. 17 Li et al. 18 conducted an experimental study on the impact mechanical properties of steel fiber reinforced concrete beams. The experimental results revealed that the addition of steel fiber could potentially enhance the overall toughness of a specimen and increase the area of a specimen participating in the energy dissipation area under the conditions of impact loads. As a result, the impact bearing capacity of the specimen could be improved. Lee et al. 19 conducted experimental research and numerical simulations regarding steel fiber reinforced concrete beams under different impact velocities. The results indicated that the addition of steel fiber could improve the impact bearing capacity and energy absorption capacity of beams, as well as reduce the peak values and residual displacements of specimens. Jin et al. 20 conducted drop-hammer impact tests on 12 specimens of steel fiber simply supported beams, and the results showed that the addition of steel fiber and stirrups could improve the crack resistance, ductility, energy dissipation capacity, and deformation recovery ability of the specimens. Yoo et al. 21 conducted drop-hammer impact tests on layered steel fiber reinforced high strength concrete beams. The results confirmed that the bending strength and ductility of the specimens had been significantly improved using higher volume fractions of steel fiber. The impact test results were subsequently compared with the analysis results obtained using a single-degree-of-freedom system which considered the nonlinear material properties of steel fiber reinforced concrete. Dou et al. 22 carried out impact loading tests on six specimens with different steel fiber content levels and stirrup ratios. The results indicated that increases in stirrup ratios could reduce the probability of steel yield and even the failure of steel bars. Moreover, the increases in the stirrup ratios had also caused the development of cracks to decrease. However, the steel fiber content levels had little effect on the strength of the beams, but major impacts on the stiffness of the beams. In summary, it was considered from the aforementioned results that the incorporation of steel fiber could potentially reduce the cracking of beams and cause the crack occurrence areas to be relatively concentrated. In conclusion, there have been many research studies conducted regarding the impact resistance of RC beams, stainless-steel reinforced concrete beams, and steel fiber reinforced concrete beams. However, relatively few investigations have been completed regarding the impact resistance mechanical properties of steel fiber stainless-steel reinforced concrete structures at this time.
In the current study, based on the existing research findings,9,10 an ultra-high drop hammer impact testing system was adopted in order to carry out drop-hammer impact tests on six SFSRC beams. The study examined the influencing effects of steel fiber content and impact velocity levels on the impact resistance mechanical properties of SFSRC beams. In addition, taking the engineering applications of the Hong Kong-Zhuhai-Macao Bridge as the background, this study provided theoretical support for the impact resistance designs of future reinforced concrete structures in marine engineering environments.
Experimental testing overview
Specimen design
In this study’s experimental testing processes, four types of steel fiber reinforced concrete beams (hereinafter referred to as beams) were designed. Using the same reinforcement method (Figure 1), the specimens were numbered as SFS0, SFS1, SFS2, and SFS3, and their fiber volume content levels were 0%, 1.0%, 2.0%, and 3.0%, respectively. Among the specimens, there were three beams of the SFS2 type. Each beam had a designed total length of 2300 mm; clear span of 2000 mm; section size of
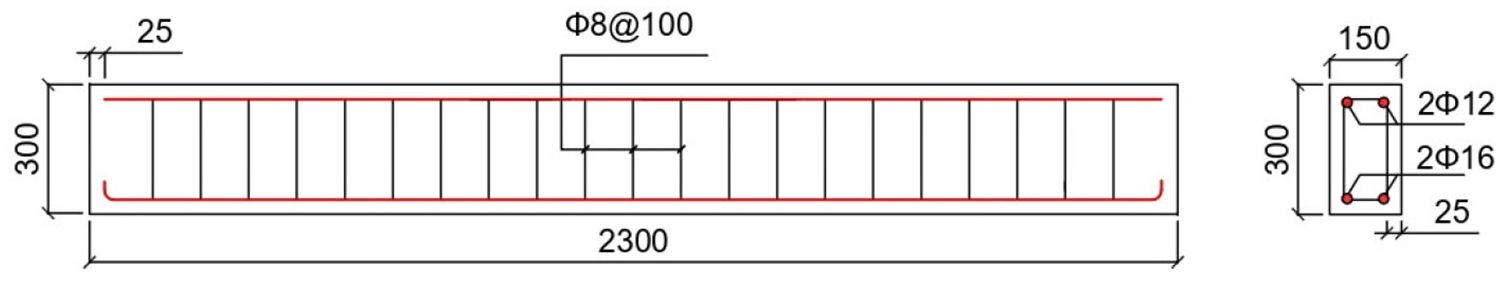
Beam reinforcement diagram (mm).
Reinforcement material properties.


Stress-strain curve of stainless steel bar.
The steel fiber type used in this study’s experimental tests was a cold drawn steel wire end hook type, as shown in Figure 3. The properties of the fiber material are shown in Table 2. Three standard cubes with sizes measuring 150 mm × 150 mm × 150 mm were reserved for each type of specimen, and the mix proportions are shown in Table 3. The cement type was P.O42.5 ordinary Portland cement. The fine aggregate adopted natural river sand with a fineness modulus of 2.8 and a density of 2640 kg/m3. The coarse aggregate adopted a continuous grading with particle sizes of 5–25 mm and a density of 2730 kg/m3. The test cubes and specimens were cured under the same conditions. After 28 days, cube compression tests were carried out according to CECS 13:89 Test Method for Steel Fiber Reinforced Concrete, 23 as detailed in Figure 4. The material property test data of the steel fiber reinforced concrete are shown in Table 4. It can be seen from the table that the addition of steel fiber can enhance the strength of concrete, and the higher the steel fiber content, the greater the increase in the compressive strength of concrete, which is similar to the results of the literature. 20

Steel fiber diagram.
Properties of the steel fiber material.

Mix proportions of the steel fiber reinforced concrete (kg/m3).


Cube compression tests.
Experimental designs.

Designs of the testing device and testing processes
In this study, a domestic ultra-high heavy multi-function drop hammer impact test system was utilized to carry out single concentrated loading experiments on six test beams in the middle of the span. The hammer head was a cylinder with a diameter of 200 mm. The testing device is detailed in Figure 5. The supporting mode of both ends of the beam was a simple support mode. In order to prevent the two ends of the beam from jumping up and separating from the support during the impact processes, a pressing plate was set at the roof of the beam above the support, and a certain degree of tension was applied through a pull rod in order to securely fasten the beam and the support. During the testing procedures, the fixture was relaxed in order to release the drop-hammer at specified heights, and then the samples were impacted by an approximately free-falling body along a guide rail. The experimental design is illustrated in Table 4.

Drop-hammer impact testing device.
Collection of the test data
This study’s experiments began the data acquisition process using a laser trigger, as shown in Figure 6. The time history of impact force was obtained by the force sensor built into the impact testing system. A KTC-200 pull-rod type displacement meter was arranged in the middle of the beam span in order to measure the displacement time history of the middle span. In addition, a resistance strain gauge was used to measure the strain time history of the reinforcement. The distribution of the measuring points is shown in Figure 7. A total of four accelerometers (A1–A4) were arranged on the beam side to measure the acceleration time history during the impact processes, as shown in Figure 8. The data acquisition system was a NIPXIe-1085 model produced by the National Instruments Co., Ltd. The data were collected by a NIPXIe-1085 dynamic acquisition instrument and a KD5005 charge amplifier to Lab VIEW Signal Express graphic interaction software for post-processing, with a data collection frequency of 10 MHz. The whole process images of the experiments were recorded using a high-speed camera, with a sampling frequency of 6000 fps. After each impact, the crack widths of the beams were measured and recorded by a ZHC-U81 concrete ultrasonic detector.

Laser trigger device.

Diagram of the steel bar strain measurement points.

Schematic diagram of accelerometers.
Analysis of the test results
Failure mode analyses
Figure 9 shows the crack diagrams of each specimen after impact by the drop-hammer, and the numbers in the figure represent the crack widths (mm). It can be seen from the figure that there were obvious bending cracks in the middle span areas of the six beams under the impact loads. Due to the differences in fiber content and impact velocity levels, the overall failure modes of the specimens were quite different.

Crack diagrams of each specimen.
The results of the comparative analysis of the four beams (SFS0, SFS1, SFS2-1, and SFS3) showed that the crack distribution areas and the maximum crack widths of the damaged specimens had gradually decreased with the increases in the steel fiber content. Furthermore, many insufficiently developed subtle cracks were observed at the bottom of the beam, most of which are limited to the range of a half beam height. In addition, the number of continuous long cracks had been significantly reduced, which indicated that the addition of steel fiber had improved the overall toughness of the beams, as well as enhancing the energy consumption and crack resistance of the beams, thereby inhibiting the formation and development of cracks. It was observed that, after impact, four symmetrically distributed diagonal cracks had formed on the surface of the SFS0 specimen, with an included angle of approximately 45° in the beam length direction. Also, the two vertical cracks in the middle span had basically run through the beam section, and the ultimate failure mode was bending shear failure. The vertical cracks of the SFS1, SFS2-1, and SFS3 specimens mainly developed in the middle span areas, with the number of diagonal cracks gradually decreasing, but not significantly. The failure mode was determined to be mainly bending failure. As a result, the specimen showed good ductility. In addition, as shown in Figure 10, the concrete in the compression zone near the impact point of the SFS0 specimen in this study’s experimental tests was seriously crushed and peeled, and the steel bars were exposed. Following the impacting of the remaining beams, there were no large damages observed in the concrete within the impact areas, and the concrete still had a high bearing capacity. This indicated that the addition of steel fiber had effectively inhibited local damages in the beam-hammer contact areas and improved the impact resistance of the specimens.
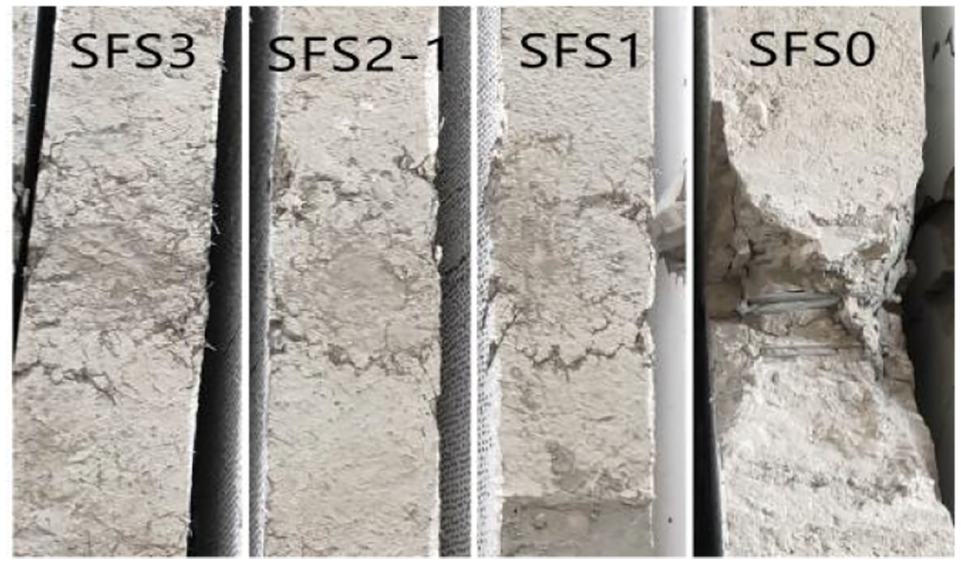
Local damage diagrams of the specimens.
The comparative analysis results of three beams (SFS2-1, SFS2-2, and SFS2-3) showed that, with the increases in impact velocity, the crack distributions of the SFS2-2 and SFS2-3 beams were sparse, and the total number of cracks had gradually decreased. For example, when the impact velocity was 6.14 m/s, the crack distribution area of the SFS2-2 specimen was observed to increase when compared with that of the SFS2-1 specimen. There were two symmetrically distributed diagonal cracks at the left and right ends of the shear span, with an included angle of approximately 60° in the beam length direction. These two cracks were the main damage cracks of that specimen and had a maximum width of 6.3 mm. The specimen appeared to have experienced shear failure. When compared with the SFS2-2 specimen, it was found that when the impact velocity was 7.64 m/s, the cracks of the SFS2-3 specimen were mainly concentrated in the middle span area. The 45° diagonal cracks below the impact point were fully developed and extended from the bottom of the beam to the vicinity of the impacted point. A vertical crack in the middle of the beam was the main failure crack, with a maximum width of 9.4 mm. This crack basically passed through the beam section, and punching shear failure had occurred in the middle span area of the specimen.
Dynamic response processes
Taking the SFS3 specimen as an example, the impact force time history and mid-span displacement time history of the specimen under impact load conditions are shown in Figure 11. Then, combined with the high-speed photography records (Figure 12), the dynamic response processes of the specimens were analyzed. It was concluded from the analysis results that the dynamic response processes of the beam could be divided into four stages.
Action stage of main peak of impact force (OA stage; 0–1.7 ms): At the moment of collision between the beam and the drop-hammer, the impact force reached a peak value in approximately 1 ms. During that period, the impact kinetic energy of the drop-hammer was transformed into the beam body. Subsequently, the beam gained velocity and started to accelerate downward. Meanwhile, the drop-hammer gradually decelerated due to the negative impact force, resulting in a trend of relative separation. Therefore, it was observed that the impact force had gradually decreased during the process time of 1–1.7 ms, but the beam and drop-hammer remained relatively static when the velocities of the beam and drop-hammer were equal at 1.7 ms and the impact force approached zero. During the entire OA stage, there was essentially no time for the beam to develop deformations and the mid-span displacements of the beam were almost constant. It was found that slight cracks had only appeared in local mid-span areas.
Action stage of the secondary peak of the impact force (AB stage; 1.7–5.3 ms): After 1.7 ms, the beam and the drop-hammer moved downward at the same speed, and the middle span displacements began to increase. However, due to the damping effects of the beam itself, the velocity of the beam decayed during the downward process, which caused a difference in velocity to form between them, resulting in a secondary impact. As a result, the impact force reached the peak in approximately 3.5 ms, and then decreased rapidly forming a secondary peak. During the AB stage, there were three new cracks observed in the local area of the beam’s mid-span, and the original cracks extended further toward the top of the beam.
Overall deformation stage (BC stage; 5.3–22.5 ms): After 5.3 ms, the beam and the drop-hammer decelerated together, and the impact force displayed an oscillating trend. The mid-span displacements rapidly increased, reaching a peak value at 22.5 ms. During the BC stage, the original microcracks in the local area of the beam’s mid-span were fully developed, and a number of small discontinuous short cracks had occurred in the shear span.
Rebound stage (CD stage, 22.5–35.3 ms): After 22.5 ms, the beam began to rebound upward and gradually separated from the drop-hammer. The impact force gradually decreased and finally reached zero, and the mid-span displacements decreased and finally tended toward a fixed value. During the rebound stage, there were almost no new cracks in the beam, and the original cracks had become closed to some extent.

Time history diagram of the impact force and mid-span displacements of the SFS3 specimen.

Crack development time history of the SFS3 specimen.
In conclusion, the impact force reached the main peak value in a short time during the impact processes, and microcracks (mainly vertical cracks and 45° diagonal shearing cracks) first appeared in the local areas of the beam’s mid-span. Then, as the stress waves propagated to the supports at both ends of the beam, the mid-span displacements gradually increased. The original cracks in the local areas of the mid-span gradually further developed, and diagonal microcracks successively appeared in the shear span section. In addition, when the mid-span displacements reached the peak values, the widths of the cracks also reached their maximum. It was observed that residual deformations had occurred in the beam after rebound, and the crack widths had decreased to some extent.
Influencing effects of the fiber content and impact velocity levels on the impact responses of the specimens
In order to show the dynamic response processes of the beams with different fiber content and impact velocity values, the time histories of the impact force, mid-span displacements, and steel strain of the six specimens were plotted, as shown in Figures 13 and 14. In this study, the time history of the steel bar strain was represented by the strain data of the No. 3 steel bar.

Dynamic response time history of the specimens with different fiber content levels: (a) time history of the impact force, (b) time history of the mid-span displacements, (c) time history of the No. 3 steel bar strain, and (d) peak fitting diagram for the fiber content parameters.

Dynamic response time history of the specimens with different impact velocities: (a) time history of the impact force, (b) time history of the mid-span displacements, (c) time history of the No. 3 steel bar strain, and (d) peak fitting diagram for the fiber content parameters.
It can be seen from Figures 13(a) and 14(a) that the development trends of the impact force time history curves of each specimen under the impact load conditions were basically the same. The impact force increased linearly at the beginning stage, and then decreased sharply after reaching the maximum point, forming a main wave peak with a duration of approximately 1.5 ms. There was also a secondary peak after the main peak, and then the impact force developed until it finally approached zero. When comparing Figure 13(a) with Figure 14(a), it was found that the fiber content and impact velocity levels had little correlation with the durations of the main peak values of the impact force and the total duration of the impact force. For example, with the increases in the steel fiber content levels, the main peak values of the impact force gradually increased, but the increase range was small. Then, with the increases in the impact velocity, the impact force was observed to be sharper during the action stages of the main peak values, with the main peak values of the impact force found to be significantly increased.
It can also be seen in Figures 13(b) and 14(b) that the mid-span displacements of each specimen had rapidly increased during the beginning stage, and then rapidly decreased after reaching the peak value, forming a sinusoidal peak. The steel fiber content levels were found to have little effect on the peak arrival time. However, with the increases in impact velocity, the peak arrival times were observed to gradually increase. Then, the mid-span displacements decreased to fixed values forming residual displacements, with the entire process taking approximately 40 ms. Kishi et al.
24
proposed that in the impact resistance designs of structures, the peak displacement (D), and residual displacement (
Specimen displacement data sheet.

It can be seen in Figures 13(c) and 14(c) that the development trends of strain time history curves of the No. 3 steel bar of each specimen under impact load conditions were similar. When the drop-hammer came in contact with the beam, the strain of the steel bar increased sharply. Then, after reaching the peak value, vibrations developed and approached the plateau value. At approximately 20–30 ms, the strain level of the steel bar rapidly decreased, which was consistent with the period when the mid-span displacements began to decrease. It was found that when comparing Figure 13(c) with Figure 14(c), the different fiber content and impact velocity levels had significant effects on the peak strain of the No. 3 steel bar.
Figure 13(d) details the fitting diagram of the fiber content with impact force, mid-span displacements, and strain peak value of the No. 3 steel bar. It can be seen in the figure that the main peak value of the impact force of the SFS1 specimen had increased by 12.56%. Also, the mid-span displacement peak value was decreased by 12.75%, and the steel bar strain peak value was determined to be 10.76%, when compared with the SFS0 specimen. These results indicated that the addition of steel fiber had improved the overall stiffness of the specimen and increased its anti-deformation ability. It was observed that when compared with the SFS1 specimen, the main peak value of the impact force of the SFS2-1 specimen was further increased by 9.16%. In addition, the peak value of mid-span displacements, along with that of the steel bar strain, were decreased by 4.89% and 11.55%, respectively, indicating that the fiber content levels had been increased from 1.0% to 2.0%, and the overall impact resistance of the specimen had been enhanced. The main peak value of the impact force of the SFS3 specimen was increased by 5.16% when compared with the SFS2-1 specimen, and the peak value of mid-span displacements and the peak value of the steel bar strain were also found to have been increased by 33% and 6.56%, respectively, which suggested that the fiber content levels had increased from 2.0% to 3.0%, and the overall impact resistance of the specimen had been weakened. This study’s comprehensive analysis of the test results showed that the impact resistance of the specimen was the most efficient when the steel fiber content was 2.0%.
Figure 14(d) details this study’s fitting diagram of the impact velocity with impact force, mid-span displacements, and strain peak value of the No. 3 steel bar. It can be seen from the diagram that when the impact velocity increased from 4.36 to 6.14 m/s, the main impact force peak value, mid-span displacement peak value, and steel strain peak value of the SFS2-2 specimen had increased by 40.39%, 50.5%, and 20.7%, respectively, when compared with those of the SFS2-1 specimen. Then, when the impact velocity increased from 6.14 to 7.64 m/s, the main impact force peak value, mid-span displacement peak value, and steel strain peak value of the SFS2-3 specimen had increased by 41.15%, 37.04%, and 17.14%, respectively, when compared with those of the SFS2-2 specimen. Therefore, it was evident that the main peak value of the impact force was basically linear with the impact velocity, and the greater the impact velocity was, the more serious the shear failure of the specimen would be. At the same time, the corresponding peak values of the strain and mid-span displacements of the bottom reinforcement were also observed to have gradually increased.
Inertia action and beam damage analysis results
In the present study, it was found that when the drop-hammer came in contact with the beam, the resulting impact force had caused the beam to experience a downward acceleration. The acceleration of the beam produced an inertial force which was equal to the product of the integral of mass in volume and acceleration, 25 as shown in Figure 15. This was calculated using Formula (1) 26 as follows:

Where
Distribution diagram of the inertial force. 5
Figure 16 shows the acceleration time history of the measuring points during the impact response process of the SFS3 specimen. In the figure, the downward acceleration is positive. It can be seen in the figure that after the beam-hammer contact, acceleration of the A1 measuring point in the mid-span first appeared and its value was the largest. Then, with the propagation of the stress waves, the subsequent measuring points successively appeared from the mid-span toward the directions of the supports, and the acceleration values were increasingly smaller the closer to the supports became. After approximately 0.53 ms, the acceleration was transferred to the supports at both ends of the beam, which indicated that the inertial force along the length of the beam had experienced a certain conduction process. This was considered to be the action stage of the main peak of the impact force (0–1.7 ms), and there were no beam deformations during that stage. Based on the data detailed in Figure 16, the acceleration change history of the beam body at different times was plotted, as shown in Figure 17. It can be seen in the figure, the inertial force of the beam body was approximately linearly distributed along the length direction of the beam. Prior to the stress waves being transmitted to the supports, the beam was mainly affected by the impact force and inertial force. Its stress distribution diagram is simplified in Figure 18(a). Then, when the support reaction responses occurred, the beam was affected by the impact force, inertial force, and support reaction force. The stress distribution diagram is simplified in Figure 18(b). In the figure, F represents the impact force; R represents the support reaction force; and

Acceleration time history of the SFS3 specimen.

Acceleration history distribution.

Beam stress distribution: (a) Stress distribution of the beam prior to the stress waves being transmitted to the supports, and (b) Stress distribution of the beam after the stress waves being transmitted to the supports.
It was observed in this study that before the stress waves were transmitted to the supports, the beam was in a local response stage. Pham and Hao
27
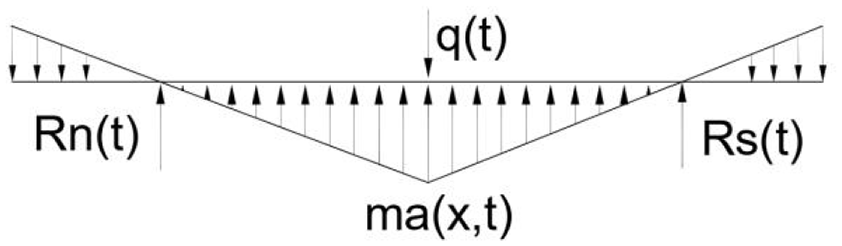
proposed that during the local response stage, approximately two thirds of the impact force is converted into inertial force. In this research investigation, the inertial force of the SFS3 beam was calculated according to equation (1), and the same conclusion was obtained by comparing with the impact force values. Therefore, by setting the total length of the beam to be l, and before the supporting force had responded, it was assumed that the inertial forces at any moment were distributed in the range of

Dynamic response diagram of the beam during the local stage.

Stress analysis diagram of the beam prior to the stress waves being transmitted to the end supports.
The inertial force


In addition, according to equations (2) and (3), the internal force diagram of the beam at different times in Figure 18(a) could be plotted, as detailed in Figure 21.

Internal force diagram of the beam during the local response stage.
As can be seen in Figure 21, during the local response stage prior to the stress waves being transmitted to the end supports, the inertial force and impact force were mainly distributed within the mid-span area of the beam. The bending moment and shear force of the cross section in the mid-span were the largest. Therefore, under the combined action of the impact and inertial forces, failure had first occurred below the impact point of the beam. The failure was mainly in the form of vertical cracks and 45° shearing diagonal cracks. These were considered to be the main damages to the beam after the impact. These were unique shearing effects experienced by the beam under the condition of impact load, which had significant impacts on the overall failure mode of the beam. When the stress waves were subsequently transmitted to the supports, the supports had generated reactions at both ends of the beam. As detailed in Figure 18(b), the inertial force had gradually acted upon the shear span. Then, under the combined actions of the support reactions, impact force, and inertia force, diagonal cracks had easily appeared in the shear span of the beam.
The damaged areas of the beam were divided into the mid-span local area (1) and the shear span area (2), as illustrated in Figure 22. The research data detailed in Section 2.1 showed that with the increases in impact velocity, the failure mode of the SFSRC beam had transitioned from bending failure to shear failure, and then to a punching shear failure mode. It was found in this study that when combined with the entire impact process of the beam, the corresponding impact force and inertia force had mainly increased due to the greater impact velocity. It was observed that prior to the stress waves being transmitted to the end supports, the beam had not been strong enough to resist the shearing effects during the early stage of the impact due to its self-bearing capacity. As a result, the beam had instantly cracked in the mid-span local area (1) and damages had formed. Finally, the specimen experienced punching shear failure in mid-span local area (1) (SFS2-3). When the impact velocity was relatively low, the impact force and inertia force were also relatively small. It was also found that with the propagation of the stress waves, the beam experienced damages in area (1), and at the same time, the beam was also subjected to larger shear force in the shear span area (2) due to the reaction responses of the end supports, resulting in diagonal cracks occurring in the beam. Furthermore, the specimen was subjected to shear or bending shear failures in the aforementioned areas (1, 2) (SFS2-2). It was found that when the impact velocity levels were even lower, the beam had only become damaged in area (1) during the early stage of impact. It was found that the mid-span local area (1) finally developed into main damage occurrence area on the beam, and the specimen had mainly underwent bending failure in area (1) (SFS2-1).
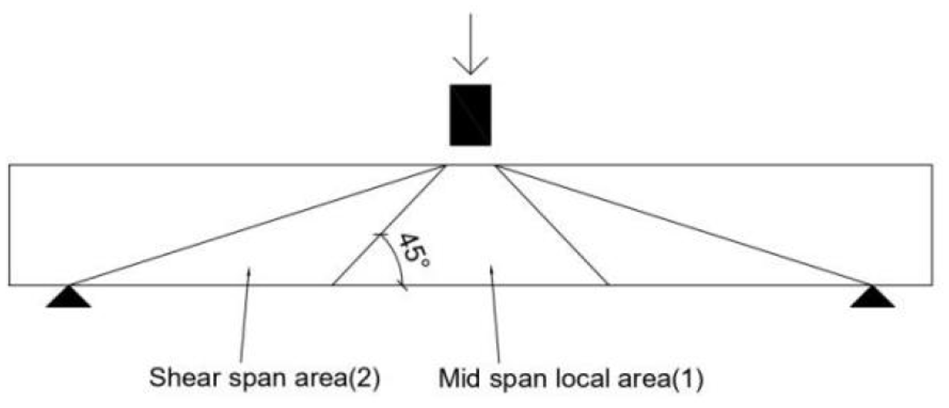
Schematic diagram of the crack damage area.
In addition, it was noted that the SFS0 specimen had experienced serious bending shear failure when the impact velocity was 4.37 m/s. Meanwhile, the SFS2 specimen only had encountered shear failure at 6.14 m/s when the fiber content was 2.0%. These results indicated that the addition of steel fiber had resulted in certain resistance to the shearing effects during the early stage of impact and increased the impact velocity required for the specimen to undergo punching shear failure.
Strain and displacement analysis results of the specimens based on a DIC method
In recent years, with the development of digital speckle and high-speed camera technology, the advantages of DIC (Digital Image Correlation) methods, such as non-contact, high-frequency responses, and real-time recording, have gradually been recognized when analyzing the overall strain and displacements of specimens.28–30 As shown in Figure 23, speckle was sprayed on the entire surface of the specimen in order to analyze the strain and displacement fields. The displacement field was mainly used in this study to monitor the propagation time history of the maximum cracks. The maximum crack locations of each specimen are shown in Figure 9.

Schematic diagram for the analysis results obtained using a DIC method.
Strain field analysis results
In order to clarify the evolution process of full field strain of the specimens under the conditions of different fiber content and impact velocity levels, three specimens (SFS1, SFS2-1, and SFS2-3) were analyzed in detail.
Figure 24 shows the evolution processes of the strain fields in the first 15 ms for the specimens. It can be seen from the figure that the steel fiber content increased from 1.0% to 2.0%, and the tensile damage areas of the specimens significantly decreased along the beam height direction. According to the final overall strain fields of the specimens shown in Figure 25, the peak tensile strain of the concrete of the SFS2-1 specimen decreased by 31.2% when compared with that of the SFS1 specimen. Meanwhile, the peak compressive strain of the concrete was basically the same, which indicated that, under the action of impact load, the increases in the steel fiber content levels had mainly enhanced the overall tensile strength of the specimen. At the same time, the development of cracks had been inhibited from the bottom of the beam to the top of the beam, and the impact velocity was increased from 4.45 to 7.12 m/s. It can be seen in Figure 24 that the main damaged areas of the specimen were concentrated within the mid-span. In addition, as shown in Figure 25, the peak tensile strain and peak compressive strain of the concrete of the SFS2-3 specimen were increased by 85.3% and 140%, respectively, when compared with those of the SFS2-1 specimen. Those results suggested that the greater the impact velocity, the more serious the tensile and compressive damages of the concrete.

Evolution history of the strain fields of the specimens.

Final overall strain fields of the specimens.
Development time histories of the maximum cracks
In static load designs, the maximum crack widths are regarded as the control indexes of structural design. In order to analyze the development law of the main failure cracks of the specimens under the impact load conditions, this study selected the SFS2-1 specimen as an example. Subsequently, the development time history of the maximum crack of the SFS2-1 specimen was analyzed. As can be seen in Figure 26, it was found that if the measured crack width is set as
OM stage: During this stage, the
MN stage: During this stage, the
NP stage: During the NP stage, the
PQ stage: During the PQ stage, the

Schematic diagram of crack monitoring process.

Development history of the maximum crack of the SFS2-1 beam.
In the present investigation, in order to further compare the influencing effects of the same impact velocity and different fiber content levels on the maximum cracks on the surfaces of the specimens, the evolution time history of the maximum cracks on the surfaces of each specimen were plotted, as shown in Figure 28.

Maximum crack development time histories of the specimens with different fiber content levels.
According to the above analysis and the data detailed in Figure 28, the working mechanism of the SFSRC beams under impact load conditions was as follows: The incorporation of steel fiber mainly improved the bond performance between the concrete matrixes, and inhibited the crack development rates through the bond force generated by the pull-out between the fiber and concrete. As a result, the impact resistance abilities of the specimens had been increased. It should be noted that, according to the data shown in Figures 27 and 28, the straight slopes between segments in the curves were basically the same, which indicated that once there was increased slippage between steel fibers and the concrete, resulting in the crack expansion actions becoming inhibited and weakened. It was believed that this was related to the end hook type steel fiber used in this study’s experiments. When the ends of the steel fibers were pulled out, the friction between the fiber and concrete layers had rapidly attenuated. Therefore, it was considered in this study that increasing the friction between the steel fiber and concrete was the key to improving the impact resistance.
Conclusions
In this study, six SFSRC beams were subjected to drop-hammer impact tests using an ultra-high heavy drop-hammer impact test system. The influencing effects of different steel fiber content and impact velocity levels on the impact mechanical properties of the SFSRC beams were mainly examined. Then, combined with a digital image correlation method, the full field strain and deformations of the specimens were analyzed and the following conclusions were drawn:
It was determined in this study that under the impact load conditions, the addition of steel fiber had improved the bond performances between the concrete matrixes and the overall tensile strength of the specimen, which enhanced the overall energy dissipation and crack resistance levels of the specimens, and effectively restrained the local damage degrees in the beam-hammer contact areas, thereby increasing the impact resistance of the specimens.
It was found that when the impact velocity was the same, the peak impact force of the specimens with fiber content levels of 1.0%, 2.0%, and 3.0% had increased by 12.56%, 21.72%, and 26.88%, respectively. In addition, the mid-span peak displacements were decreased by 12.75%, 17.64%, and 12.31%, respectively, and the peak strain levels of the steel bars were decreased by 10.76%, 22.31%, and 15.75%, respectively, when compared with the specimens with 0% fiber content. In summary, it was found that the overall effects were better when the steel fiber content was 2.0%.
The results of this study’s experiments revealed that, with the increases in impact velocity, the main damaged areas of the specimens were concentrated in the mid-span regions. Besides, the failure mode of the SFSRC beam had transitioned from a bending failure to a shear failure, and then to a punching shear failure mode. The addition of steel fiber was found to have certain resistance to the shearing effects during the early stage of impact and increased the impact velocity required for the specimen to undergo punching shear failure.
Footnotes
Handling Editor: James Baldwin
Declaration of conflicting interests
The author(s) declared no potential conflicts of interest with respect to the research, authorship, and/or publication of this article.
Funding
The author(s) disclosed receipt of the following financial support for the research, authorship, and/or publication of this article: The research findings described in this paper was sponsored by the Major Project (Natural Science) of Department of Education of Guangdong Province (2014KZDXM064), the Science and Technology Innovation Project of Department of Education of Guangdong Province (2013KJCX0188), and the Civil Engineering Technology Research Center of Guangdong Province.
Data availability
We solemnly state that all our test data are true and reliable. The test data are included within the article and can be made freely available.