
Abstract
The Calacatta-Carrara marble is widely used due to its excellent physico-chemical characteristics and attractive aspect. However, the sensitivity of this materiel, when performing delicate manufacturing operations, presents for the engineers a hard challenge to overcome. This issue is mainly encountered with complex shapes of parts, for which it is difficult to preserve surface integrity and avoid geometric defects. The paper aims at finding out optimal drilling parameters of cutting in the Calacatta-Carrara white marble material, in order to minimize the holes cylindricity (HC) and surface roughness (HR) using six controlled operating factors, namely, the rotation speed (N), the feed speed (F), the drill bit diameter (BD), the drill bit height (BH), the number of pecking cycles (P), and the drilling depth (DD). The experimental design uses a
Keywords
Introduction
Rock cutting is a complex process since, among others reasons, a single rock property does not completely define the permeability of different types of rock; moreover, the damage behavior models of the processed rocks cannot be reliably encapsulated using conventional elastic-plastic models. Therefore, extensive research1–3 has addressed the issues of rock processing theory, the machines/materials characterization, and the tools geometry. Marble stone is one of the most delicate materials when performing extraction operation as its structure is easily affected. This is due to intrinsic geological continuities that may be of influence on the quality of marble blocs leading to micro and macro fractures, joints, cavities, mudstones, and contact zones. 4 One of the most requested exigencies in a machining process is surface roughness. This parameter can be considered as a mean of process performance evaluation and hence affect directly production cost. In order to control and act on surface quality, it is necessary to have an accurate measuring system and an exhaustive apprehension of the cause/effect relation within the production process. In machining, and regardless external influences on material, roughness is directly affected by surface texture, tool geometry and cutting conditions as rotation speed, feed speed, and cutting depth.
Researchers have analyzed production processes and specific cutting parameters in connection with the machinability of marble and other natural rocks conducted on CNC machines and which may have significant effects on surface roughness.5–7
Another geometric parameter, which is as important as surface roughness and which must be controlled when it comes to machining and assembling complex pieces, is circularity. In fact, when drilling on marble or on other similar rocks, high precision and lower circularity error (roundness error) must be sought. Generally, measuring geometrical defects enables us to control circularity error. Numerous studies on fracture and mechanical behavior of rocks have been conducted8,9; however the investigation of machining parameters and their effect on geometrical defects has not yet been fully examined in literature. For that reason, this issue has been attacked in this current work. In order to predict machining parameters leading to perfect surface quality, it is necessary to develop empirical models based on experimental data.
Artificial Neural Network (ANN) technique is considered as one of the most performant and intelligent tools utilized to resolve diverse problems in terms of recognition, prediction, optimization, and control. ANNs are interconnected calculation networks which have the capacity of responding to input factors and the ability of learning how to adapt to environment. First of all, and in order to reach good predictions, a network have to be well trained. Numerous algorithms are available to train ANN. One of the most polyvalent and robust technique is the retro-propagation algorithm as it offers the most efficient training procedure for Multilayer Neural Networks (MLP). 10
In the recent years, we have noticed widespread interest for this technique to predict machining parameters. Among the elaborated studies, we find the work of 11 who has developed a new parameter selection method based on ANN. The suggested method is used to predict surface roughness in turning operations.
Many researchers succeeded to assess various machining process outputs from diverse input parameters using ANN.12,13 The use of this technique has been recently introduced in the field of rocks engineering.2,14
Other prediction techniques, essentially Multiple Regression Model (MR), have been utilized by researchers. Gupta et al. 15 utilized erosion water jet to cut in marble by varying the nozzle transverse speed and the abrasive flow rate parameters. The ANOVA-OA Taguchi analysis shows that the nozzle transverse speed is the most important factor impacting the top Kerf width and the Kerf taper angle. Gunaydin et al. 16 worked out the correlation between the marble sawability and fragility using regression analysis technique. The study findings elucidate correlation between the sawability of carbonate rocks and its fragility, which is half of the compressive tensile strength,17,18 have carried out empirical studies to establish rock’s cutting performances. Input/output relation model has been developed using both ANN and MR.
Rock materials are subject to aspect deterioration while machining. Therefore, the application of numerical modeling and simulation technologies was of great interest to explore fracture mechanisms. Several studies have been conducted using conventional simulations such as finite element method (FEM),19–21 discrete element method (DEM), and hybrid finite-discrete element method (FDEM). 22
On another hand, the analysis of parameters sensitivity, within a conception process, is run using Monte Carlo method which is a probabilistic method widely used in engineering.23,24
Lohithaksha et al., 25 thanks to the GRA, optimized the cutting parameters during the end milling operation. Cutting speed, feed rate, and depth of cut have been optimized taking into account multiple performance characteristics, namely surface roughness and stock removal rate. The study by Senthilkumar et al. 26 was based on a combination of gray relational analysis and the fuzzy logic technique. Mukhopadhyay et al. 27 used fuzzy logic coupled with the gray method to reduce uncertainties and to obtain an optimal response with higher quality.
The rate of drilling is influenced by rock physico-mechanical properties (Density, Compressive Strength, Flexural Strength, Water Absorption, …), geometrical parameters, such as tool length and tool diameter, and machining parameters, such as cutting speed, feed rate, and depth of cut which are precisely controllable. The process parameters which affect less or more the quality of cutting in drilling with a CNC machine are shown in Figure 1.
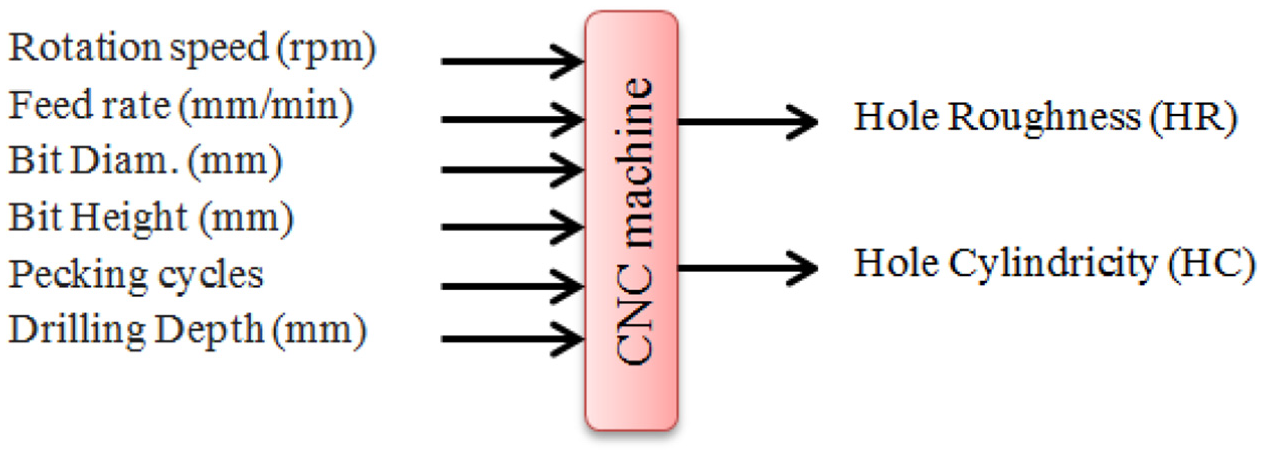
Input/output parameters.
More works have been developed to fully understand the influence of the important process parameters on surface roughness and geometric defects. Indeed, some techniques have been proposed for improving the drilling quality, such as in the work of Abbassi et al. 28 in which we have proposed a new approach based on the artificial neural network technique which allowed the prediction of process parameters in the machining of white Calacatta–Carrara marble. A series of experiments have been developed using an experiment plan which was conducted using a 5-axes CNC vertical machining center (OMAG) to obtain the data utilized for the training and testing of the artificial neural network with reasonable accuracy, under varying machining conditions.
In this current work, which is a continuation of the previously cited study, we examine the effects of the machining parameters, on the surface roughness (HR), and cylindricity (HC) of the pieces of Calacatta-Carrara white marble. To achieve our goal, a combination of several methods, analytical, statistical, numerical, and experimental, was implemented. The experimental design uses, as in the previous work, a 2_VI^((6-1)) fractional factorial plan, which is replicated once for the need of this study. The methodology of the experimental design helped us to structure a suitable experimental approach, to validate our own hypotheses, and to better understand and solve the manufacturability problems. The linear regression method allowed us to establish a mathematical model of the machining parameters. For each of the models, statistical tests were applied to choose the most significant parameters. Subsequently an analysis of variance (ANOVA) was used to examine the validity of the models. The gray relational analysis (GRA) technique was used to determine the optimal setting of the factors, that is, those giving minimum tolerances of cylindricity and roughness. For the sake of completeness, the multi-regression (MR) model and the neural network model (RNA) were compared in terms of better predictive ability.
Henceforth, the quality characteristics of cylindricity and roughness are referred to as HC and HR, respectively. Also, the statistical and the sensitivity analyses were performed using Minitab® and Crystal Ball® software. The ANN was implemented using the Matlab Toolbox®.
Experimental design and data processing
For the experiment, the perforation/drilling process
29
of the Calacatta-Carrara white marble is executed using 5-axes CNC working center (OMAG-Mill5). The 2 × 32 holes were processed using four (300L × 300W × 30H) plates. Given that the experiment was conducted according to a fractional factorial plan,

Experimental methodology.
Each work piece was measured four times. For the experimentation strategy, a replicated 2_VI^((6-1))fractional factorial plan was carried out. The layout of the randomized runs is shown in Table 1.
Four blocks

The drilling and the inspection processes have been conducted in two distinct random strategies to better assess the noise and random errors. Also, in order to assure superior sensitivity and reproducibility of the process performances, a pre-experimentation was performed offline to monitor the extreme limits of factors.
Table 2 enlists the factors levels, which are maintained for the experiment. Basically, the experiment has been conducted in a sequential way, that is, first a linear model was run and tests of curvature and lack of fit were sought. In case the tests proved affirmative, the original design was augmented by center and axial points as it was recommended in numerous bibliographies. 31
Two levels factors codings.

Multiple-regression model for the performance characteristics
Statistical analyses
Presently, the objective is to assess the quantitative impact of the control factors N, F, BD, BH, P, and DD, on the holes cylindricity (HC). The four in one plot of the residuals versus fitted values given in Figure 3(a) indicates an outward opening funnel shape denoting that the constant variation assumption has been broken. A natural log-transformation of the response (HC) is then applied. The Figure 3(b) showing the four in one plot of the residuals versus the fitted values of the transformed response, points out agreement with the normality of the residuals and the variance stability assumptions.
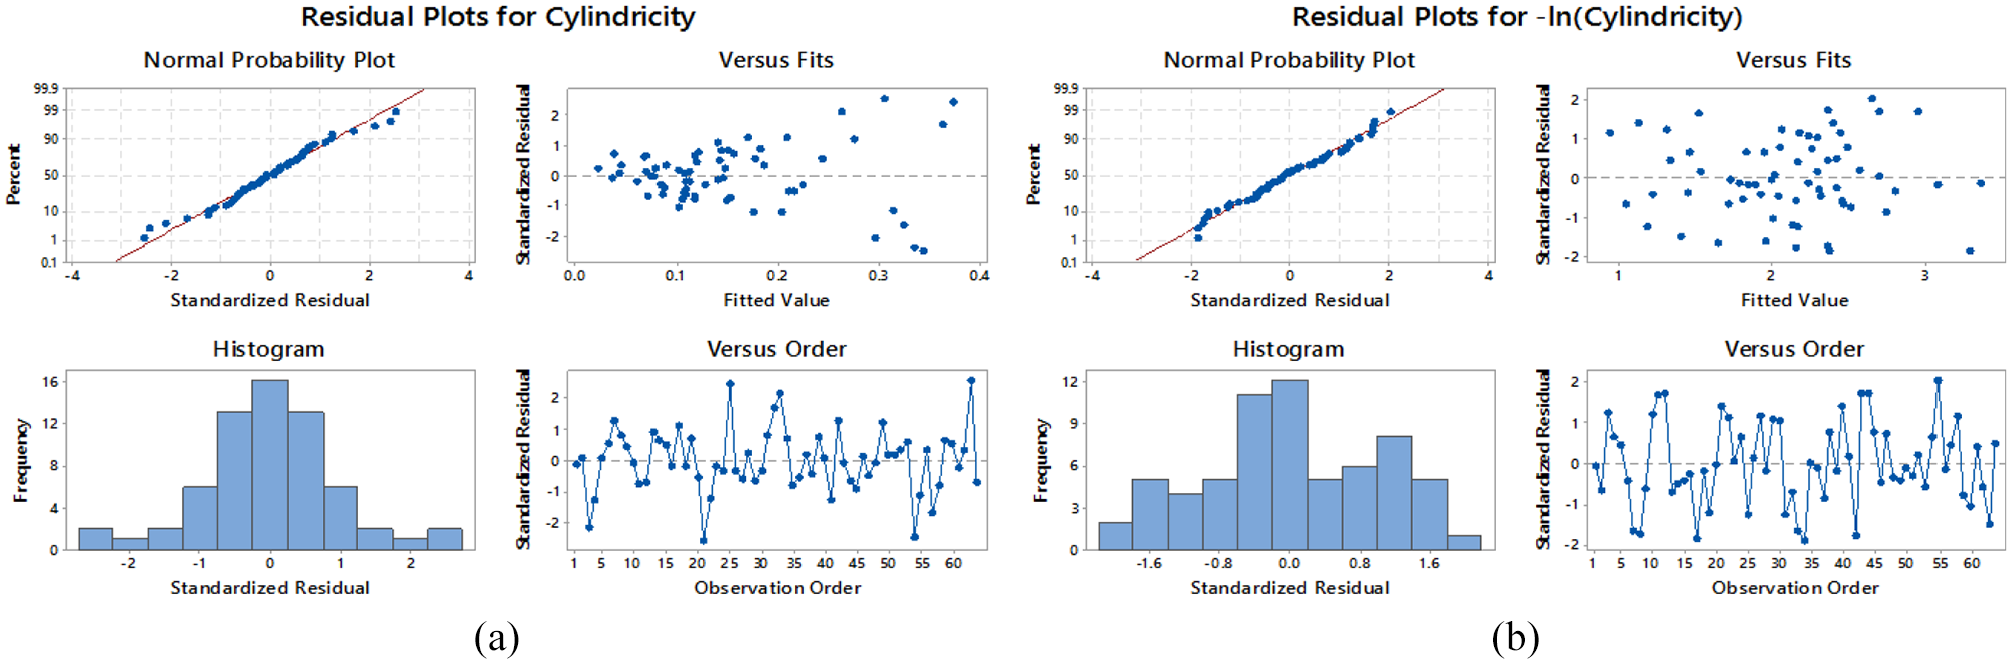
Four in one plots of the residuals for the HC response: (a) 2^(6-1) model and (b) natural log transformed model.
At 5% level, the ANOVA table shown in Table 3 stresses the prevalence of the interactions F× DD, F×P, BD × DD, BD × BH, DD × BH, and N×F×BD. The drilling depth (DD), however, is marginally significant (p-value 0.067). Neither a lack of fit nor a curvature abnormality is found significant. A stepwise regression has yielded a nonhierarchical model for the transfer function (HC) having the following performance indices, S = 0.538, R-sq. = 54.83%,R-sq.(adj.) = 40.72%, and R-sq.(pred.) = 19.70%. The multi-regression model for the cylindricity response (HC) in coded units is given below (logged response);

ANOVA Table of the HC response, hierarchy maintained.

As for the roughness response, the visual checking of the four in one plot in Figure 4 suggests the residuals fulfill the ANOVA assumptions of ε ~ NID (0, σ2). The ANOVA shown in Table 4, opts for the nonhierarchical model accounting for N, F, DD, BH, P, N × BH, F × DD, BD × DD, DD × BH, and BH × P. The tests of significance are confirmatory at 5% level.

Four in one plots of the residuals for the HR response: (a) 2^(6-1) model and (b) reduced model.
ANOVA Table for the reduced model, hierarchy maintained.
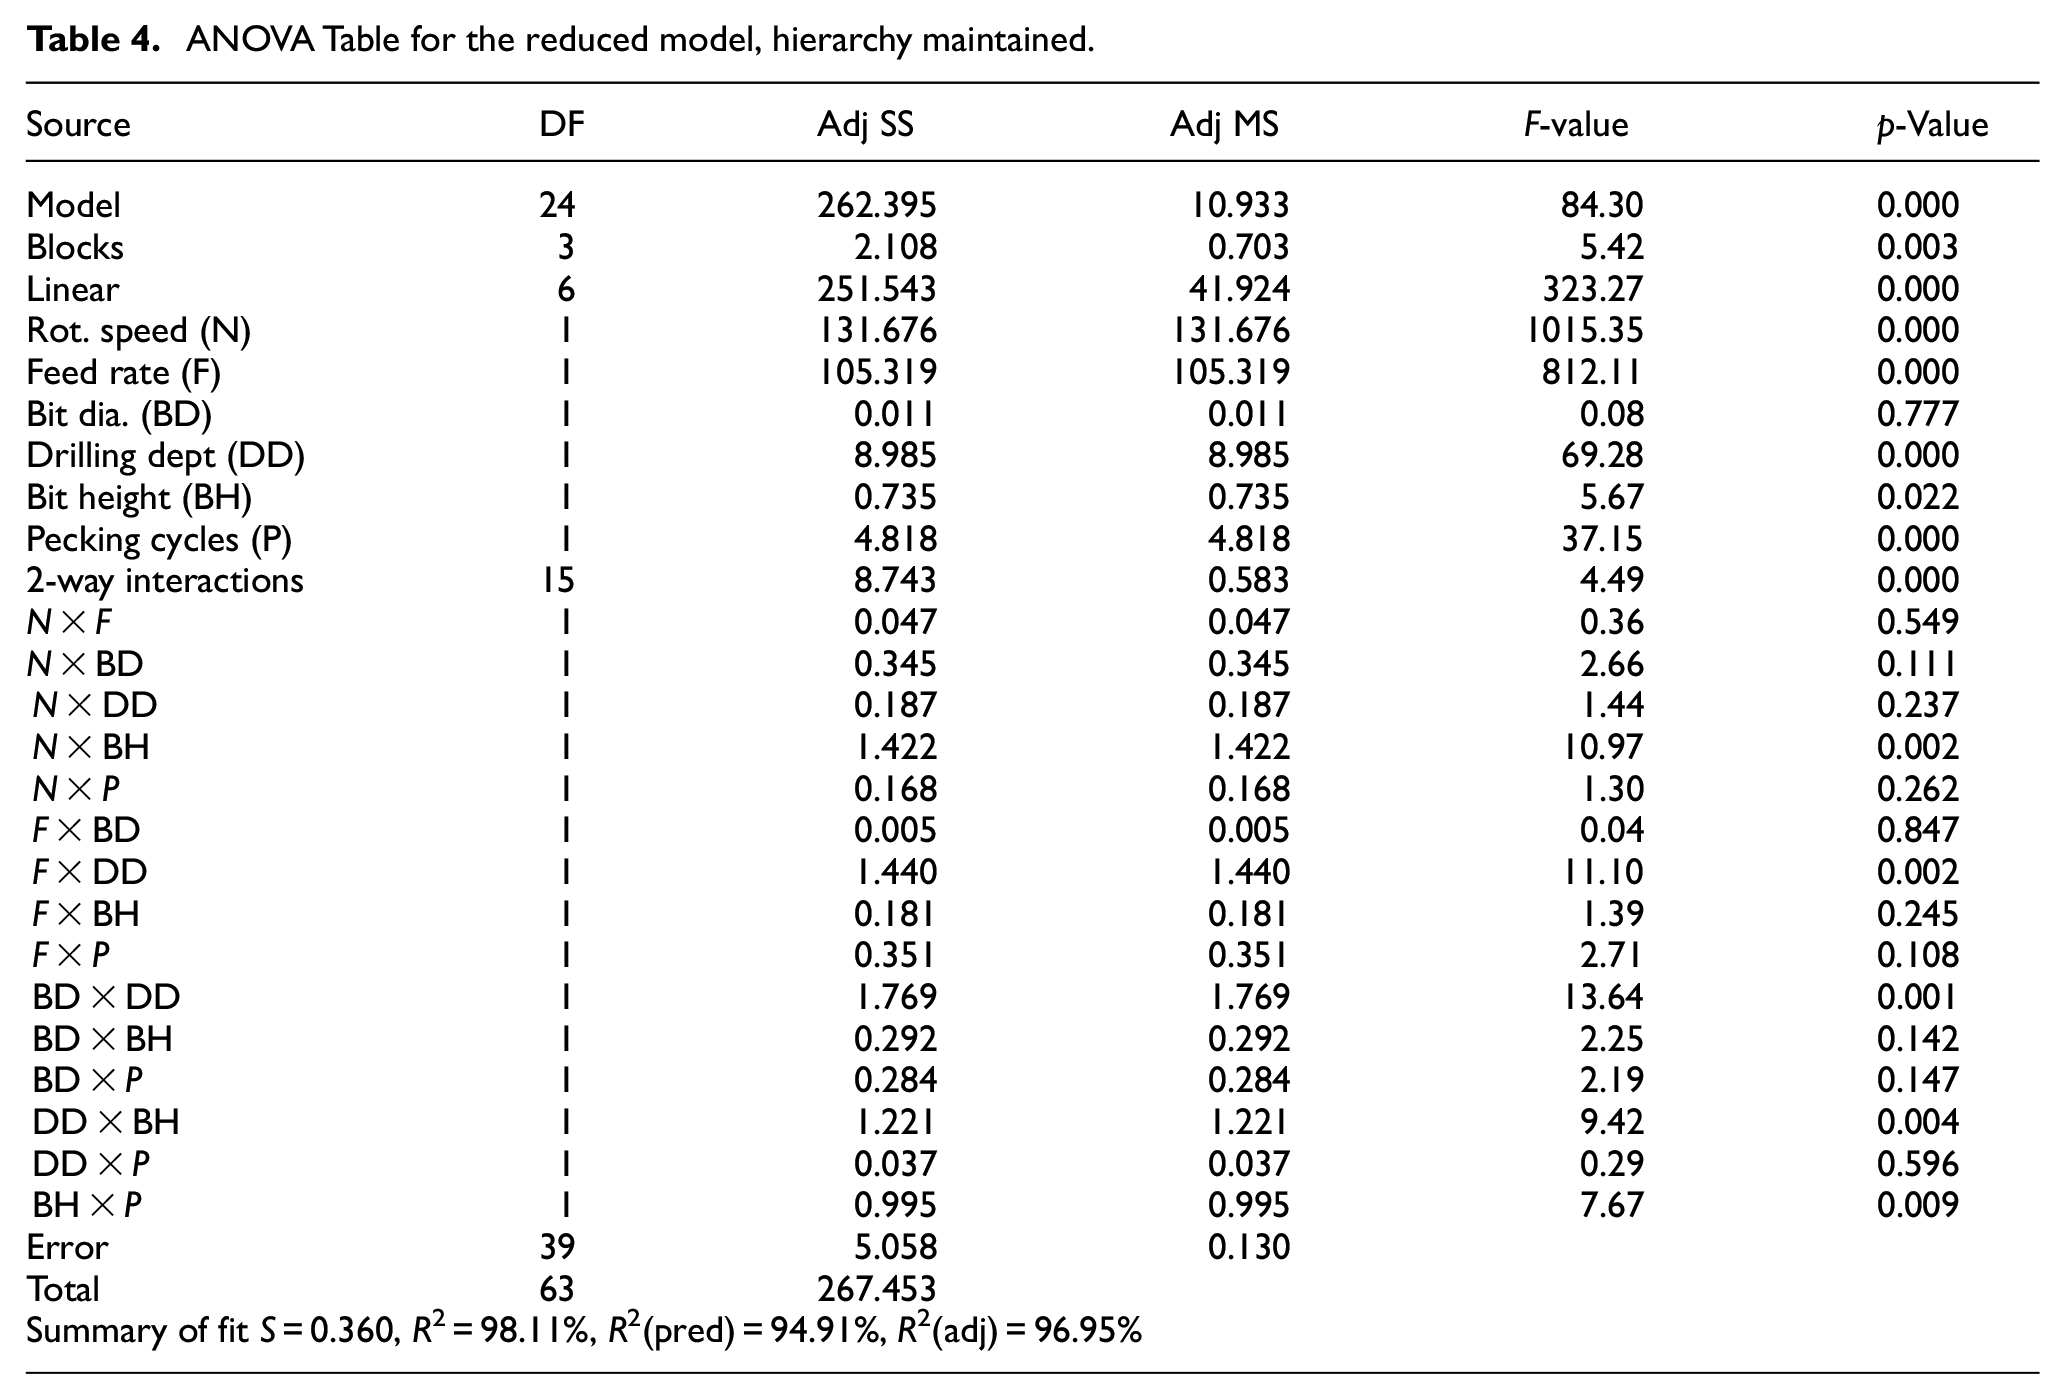
The model performances are S = 0.360, R-sq. = 98.11%, R-sq.(adj.) = 96.95%, and R-sq.(pred.) = 94.91%.The investigation of the effects of the interaction terms suggests a rather simpler model (S = 0.51, R-sq.=94.56%, R-sq.(adj.)=93.88%, and R-sq. (pred.)= 92.90%). Its coded closed-form equation is given below;

Optimization and sensitivity analysis
The Gray method is used to determine the optimal setting of N, F, BD, BH, P, and DD, which minimizes both performance characteristics (HC and HR). The Gray method, changes over the optimization of a multiple performance characteristics problem into a single response optimization problem, that is, the maximization of the Gray relational grade.32,33 Because a
Gray relational coefficients and grades for the performance characteristics, HC and HR (z = 0.5).
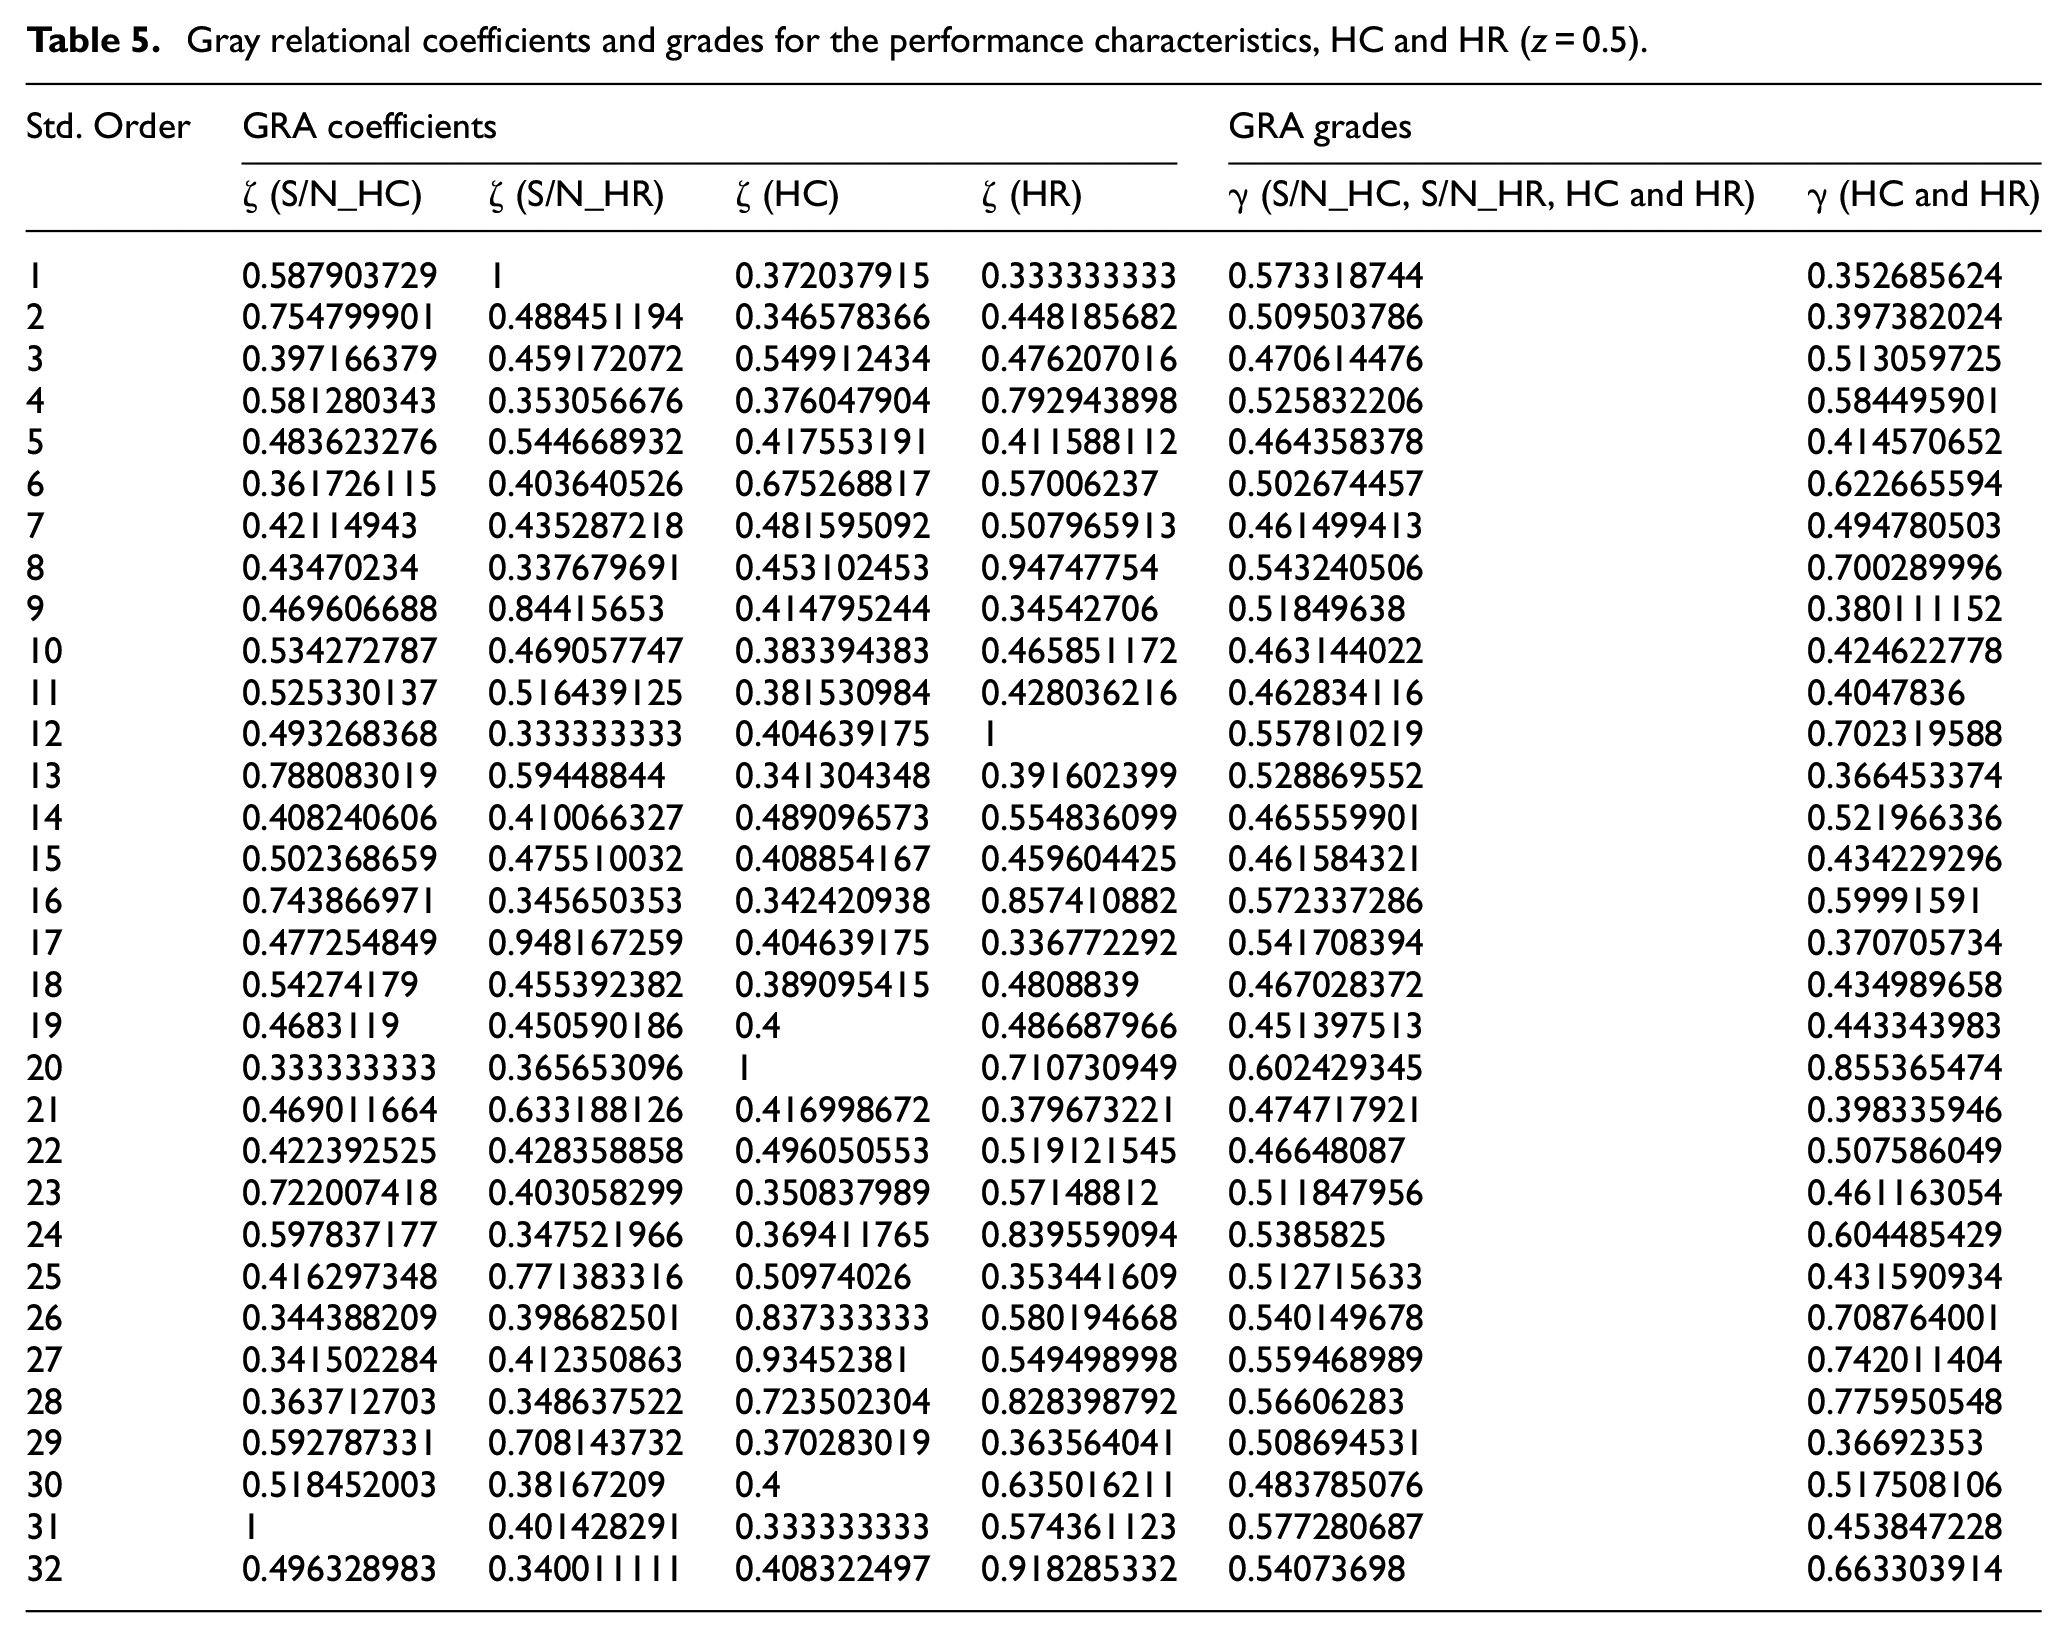
Given the experiment, i, (1 ≤ i ≤ 32), the S/Ni ratios were calculated using replicates of corresponding cylindricity and roughness values. 34 Moreover, because all process inputs were assigned equal preference, the identification coefficient (ζ) was set to 0.5.
Averaging the effects of the six process variables on the Gray grades at the −1, +1 levels should give optimum solution. Table 6 shows the overall mean of the Gray grades accounting for the S/N ratios of the quality characteristics and when these are disregarded. As a result, a minimum cylindricity (HC) and roughness (HR) performances was achieved when N was set high (N = 4800 rpm), F high (F = 350 mm mn−1), BD low (BD = 15 mm), BH low (BH = 45 mm), P high (P = 3 cycles), and DD low (DD = 10 mm).
Overall mean of the Gray relational grade accounting for and regardless of the S/N ratios.

The performance characteristics, (HC) and (HR)-being expressed in equations (1) and (2), were now checked for robustness. The uncertainly analysis was performed using Monte Carlo simulation. Two types of probability distribution of the independent variables, N, F, BD, BH, P, and DD, were considered: uniform (max = −min = 1) and normal (µ = 0, std. 0.3). And, 3000 MC simulations were run using equations (1) and (2) assuming 95% CI. A Latin hypercube sampling was chosen using 500 samples. When the predictors were uniformly distributed, the frequency histogram of the cylindricity performance (HC) was best fit using a lognormal distribution (loc. 0.03; mean 0.12 and std. 1.76; A.D p-value 0.000); however, when a normal distribution of the inputs was assumed, the (HC) was best fit using a logistic distribution (mean 0.12; scale 0.001; A.D p-value 0.000). The roughness response (HR) was represented by a beta distribution (Min. 3.51; Max. 10.38; alpha 3.69; A.D p-value 0.000) assuming uniform inputs and a logistic distribution (mean 0.12; scale 0.001; A.D p-value 0.01) while the inputs were normal. The cylindricity response (HC) was mostly sensitive to factors P, DD, and N, in order, and in a direct relationship. This is explained by the contribution to the variance and the rank correlation performances as shown in Table 7. Though, only factors N and F, in order, are influential with regard to the robustness of the roughness performance (HR). Their contribution is in direct relationship (see Table 7). These results hold true despite the probabilistic distribution of the inputs (i.e. either uniform or normal).
Sensitivity analysis of the multiple-regression models of HC and HR.
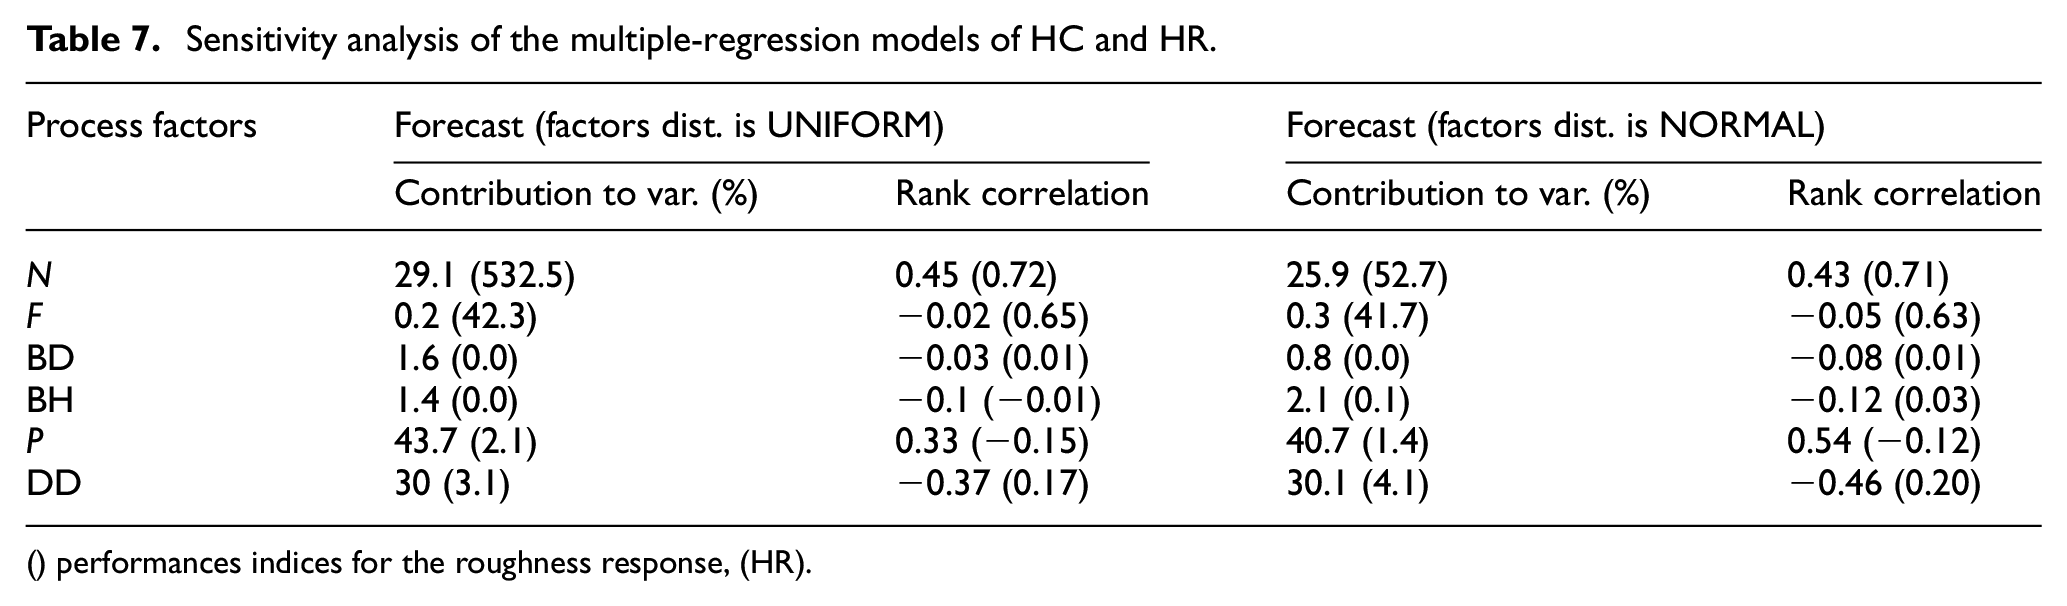
() performances indices for the roughness response, (HR).
ANN model for the cylindricity and roughness performances
Because the multiple-regression models (1) and (2) showed fair capability to manage non linearity as expressed by the data set, especially, in case of the cylindricity performance characteristic (HC), an ANN paradigm35–37 was investigated to assess the fit and the predictability of such an alternative. The ANN model was developed as a “Generalized Feed Forward Multi-Layer Perception network” (GFF-MLP) with back propagation. The input layer was associated with factors N, F, BD, BH, P, and DD and it was assigned six PEs; 10 PEs were assigned to the hidden layer based on the Kolmogorov theorem.38,39 The output layer was attributed two PEs accounting for the (HC) and (HR) responses. The input and output layers were triggered using sigmoid and linear activation functions, respectively. The network training was performed according to the Levenberg-Marquardt algorithm 40 based on 44 random samples being selected from the 2^(6-1) runs. The remaining 20 data sets were held back to test the model validity and performance.
For the ANN architectures, both the 6-10-1 ANNs (i.e. the cylindricity and roughness performances were implemented and analyzed using separate networks) and the 6-10-2 ANN (i.e. the cylindricity and roughness performances were congregated in one network) were considered as shown in Figure 5. Table 8 enlists the prediction values given by the multi-regression (MR) and the ANN models. Only, odd runs are shown. The trained ANNs were monitored according to the mean square error (MSE), the correlation coefficient (R), and the coefficient of determination (R-sq.) indices. Next, the best performing ANN was compared with the multi-regression models.

The 6-10-1 and 6-10-2 ANN models for prediction of the cylindricity (HC) and roughness (HC) performances.
Multiple-regression and ANN prediction models for the cylindricity and roughness responses.

Figure 6 shows the training performance plots. The 6-10-1 cylindricity model (HC) had MSE of 5.16.10−3 at the fourth epoch. The numerical stabilization of the network was reached at epoch 9. The best MSE equals 6.78.10−2 as regards the roughness response (HR), and it was met at the seventh epoch, which is also the system stabilization epoch. The 6-10-2 best MSE of 8.06.10−2 was achieved at epoch 16 and the system stabilizes at epoch 19. According to the correlation coefficients (R) shown in Table 9, the 6-10-2 network performs better than the 6-10-1 ANNs.
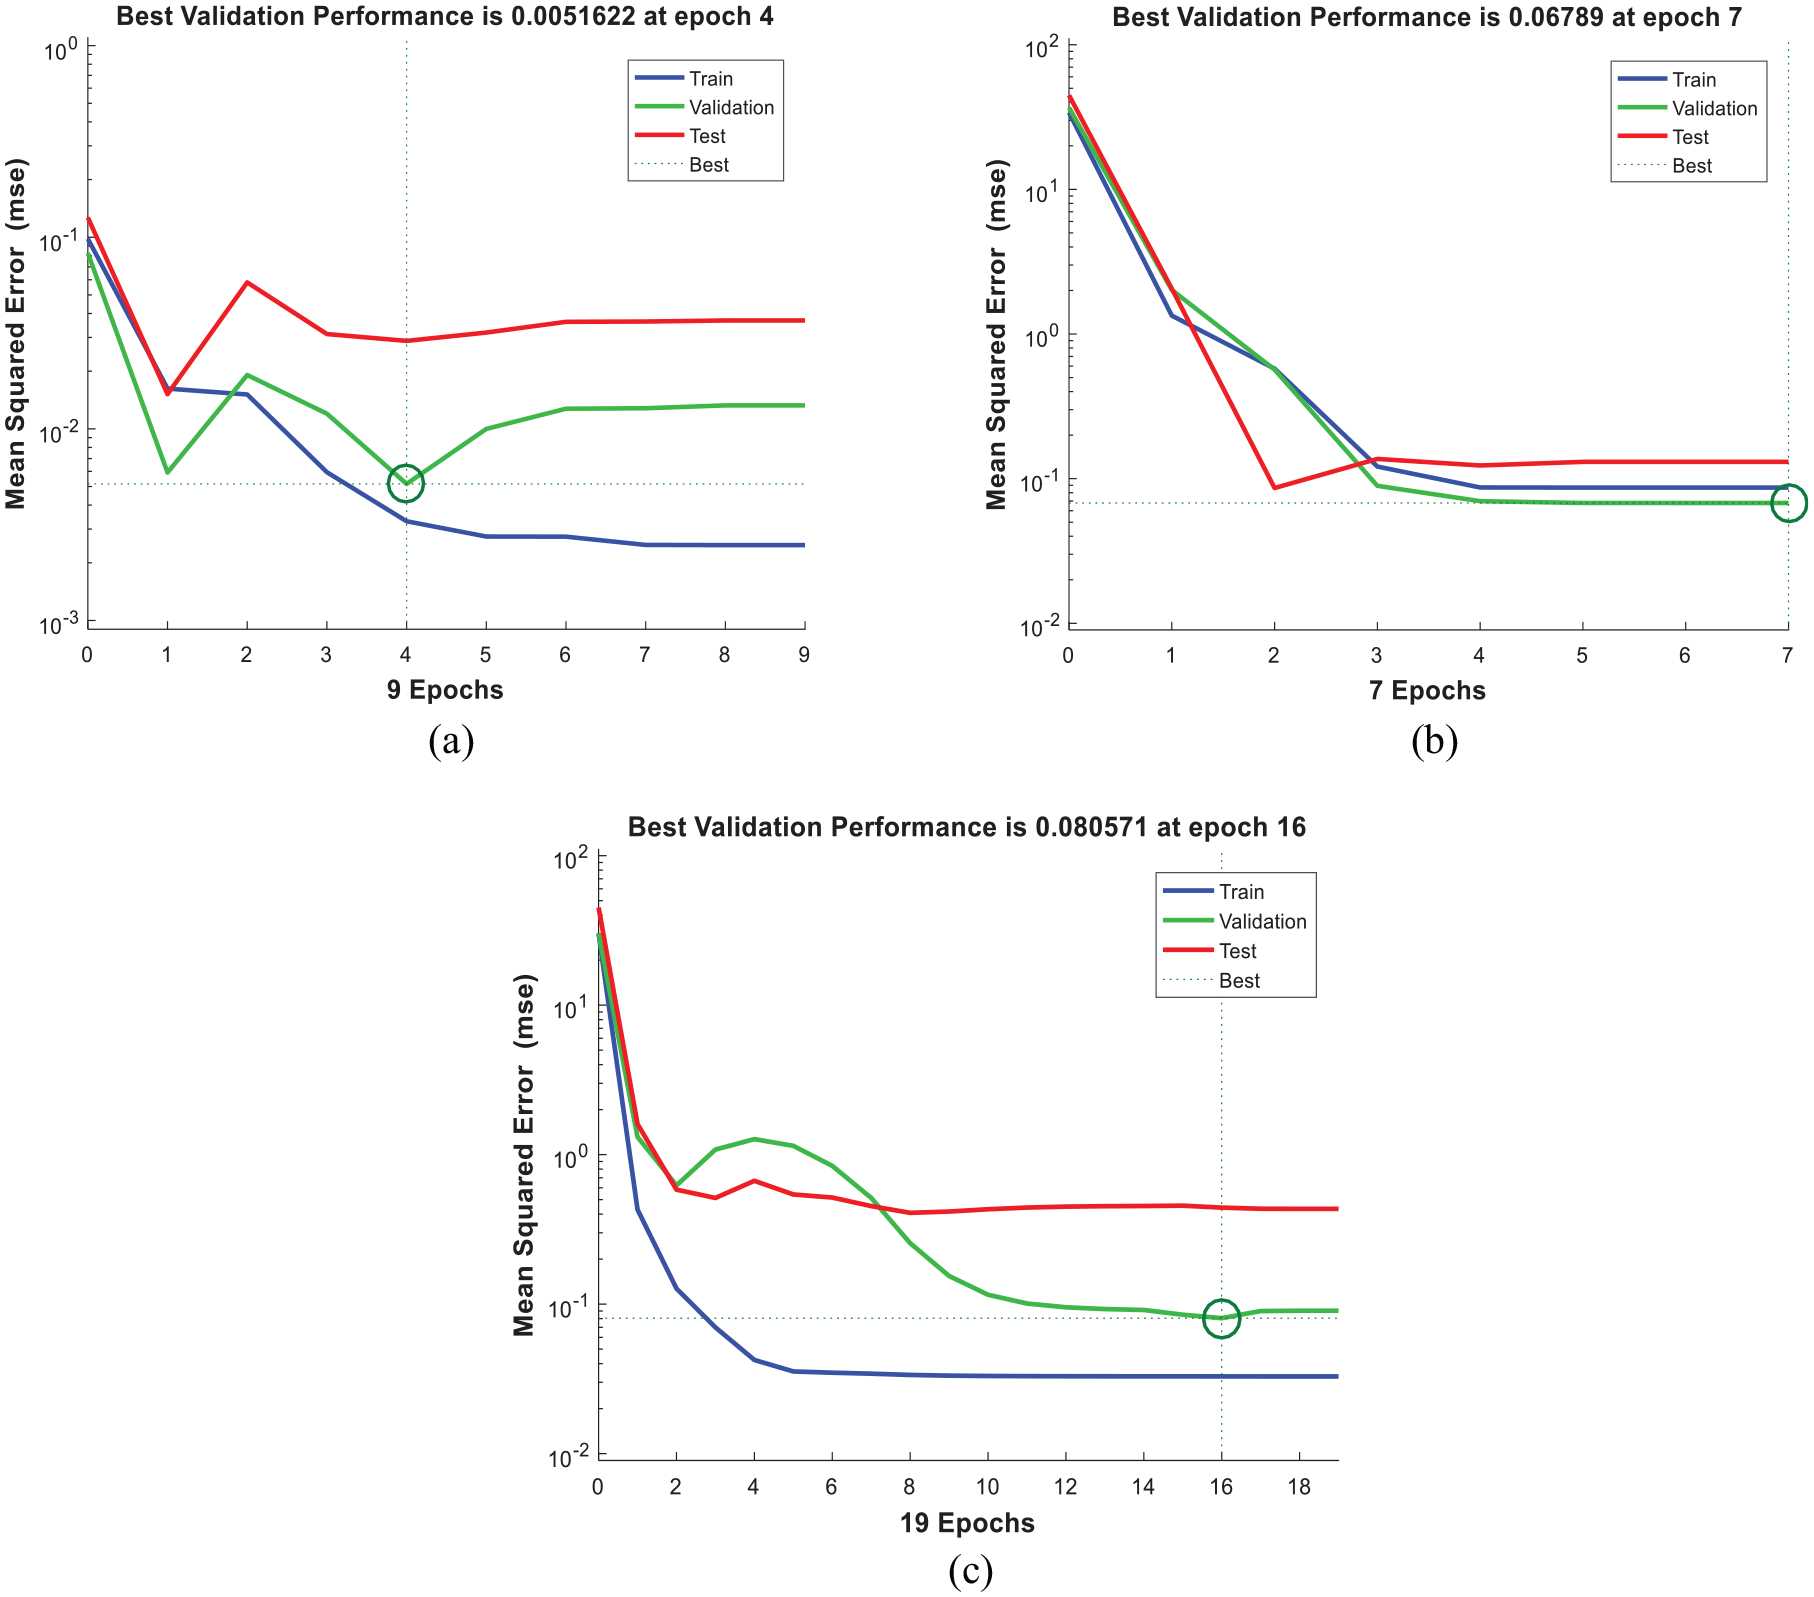
Training performance graphs: (a) 6-10-1 model for the (HC) response, (b) 6-10-1 model for the (HR) response, and (c) 6-10-2 model for both (HC) and (HR).
Comparison of the statistical performances of the 6-10-1 ANN, the 6-10-2 ANN, and the multi-regression models.

Comparison and validation
Table 9 indicates that the non-linearity and the model prediction, pertaining especially to the cylindricity performance (HC), are better managed by the6-10-2 model (Std. Dev. 0.08, R-sq.(adj.) 50.64, andR-sq.(pred.) 48.67). However, both the multi-regression and the ANN models provide excellent results with regard to the roughness response (HR).
To this end, the test of equal variances and means of the experimental data set versus the multi-regression and the 6-10-1 and the 6-10-2 ANN models is given in Table 10. Apart from the test of variance on the multi-regression model of cylindricity (HC), which overrides the null hypothesis of equal variances at 5% level (Leven p-value 0.035), all remaining tests on means and variances were conclusive, thereby, the experimental and the ANN models describe samples emanating from the same populations.
Equal mean and variance tests of the multiple-regression models, the 6-10-1 and the 6-10-2 models versus the experimental data.

For instance, and with regard for the three experimental tests (see Table 11) executed according to three input series, we found that all results for cylindricity and roughness are in tight accordance with the predicted results essentially yielded with the MR model.
Validation test.

Conclusion
Perforation in Calacatta-Carrara white marble was performed using a 2^(6-1) strategy. The objective was to find out the optimum setting of six controlled process parameters N, F, BD, BH, P, and DD, which yield minimum holes cylindricity (HC) and roughness (HR) performances. The multi-regression and the ANN models were investigated and compared in terms of predictability and data fit. We came up to the following conclusions.
The modeling and the predictability performances of the roughness response (HR) are highly accurate regarding both the multi-regression and the 6-10-x ANN models (both R-sq.(adj.) and R-sq.(pred.) >94%). However, the cylindricity performance characteristic, (HC), is better predicted by the 6-10-2 ANN with regard to the model metrics given in Tables 9 and 12. The statistical performances, that is, Std. dev. 0.08 versus 0.58, R-sq.(adj.) 50.64 versus 41.05, and R-sq.(pred.) 48.67 versus 14.84 are reflective of the incapacity of the multi-regression model to deal with non-linearity as expressed by the data set. Even though, the ANN solution is still passably satisfactory (R-sq.(adj.) is about 50%), further investigations is needed to improve the predictability and the fit of the cylindricity performance (HC). The Leven and t-tests for equal variances and means between the experimental and the MR, 6-10-1 and the 6-10-2 observations as for the process responses (HC and HR) show that groups would emanate from the same population.
By reference to the GRA analysis, optimum setting of the independent parameters is met when N is set high (4800 rpm), F high (350 mm mn−1), BD low (15 mm), BH low (45 mm), P high (3 cycles), and DD low (10 mm).
The MC simulation of the process responses (HC) and (HR) discloses that the cylindricity performance (HC) is sensitive to the pecking cycles (P), drilling depth (DD), and the rotation speed (N), in order, while the roughness performance (HR) is sensitive to the rotation speed (N) and the feed rate (F), in order. Therefore, monitoring the N, F, P, DD parameters is still required to ensure robustness of the process responses (HC and HR).
Correlation coefficients as for the 6-10-1 and the 6-10-2 ANN models.

During the development of the present paper, we have encountered many issues and come up with new ideas to enhance our findings. We represent hereafter some recommendations for future studies:
✓ Study the output parameters with other optimization methods, such as ANFIS, and then compare the predicted results with the results obtained using artificial neural networks (ANN) and regression models (MR).
✓ Develop another decision support model (DSM) that automatically chooses Calacatta-Carrara marble machining strategies.
✓ Simulate, using (Abaqus®) software, the material damage characterization based on the thorough apprehension of the proposed CALACATTA white marble material model.
Footnotes
Acknowledgements
The authors are grateful to MARBLE TUNIS-CARTHAGE Company for bringing assistance and fruitful technical discussions throughout the experimental study.
Handling Editor: James Baldwin
Declaration of conflicting interests
The author(s) declared no potential conflicts of interest with respect to the research, authorship, and/or publication of this article.
Funding
The author(s) received no financial support for the research, authorship, and/or publication of this article.