
Abstract
This paper focuses on the effect of hub clearance in the design space of the highly loaded cantilevered stator. The embedded 1.5 stages of a low-speed research compressor (LSRC) were conducted with Unsteady Reynolds Average Navier-Stokes (URANS) numerical investigation, and the cantilevered stator adopts positive bowed and fore-sweep three-dimensional design. The research details that with the hub clearance increasing from 1.1% to 4.5% span, the loss coefficient and the total leakage momentum of the cantilevered stator correspond to the change of the blade loading near the hub. When designing the inlet metal angle of the rotor downstream the cantilevered stator, emphasis should be given to considering the inter-stage matching below 15% span. The mixing of leakage flow in 1.1% span clearance and 2.5% span clearance is basically completed in the S3 passage, but the mixing of leakage flow in 3.5% span clearance and 4.5% span clearance is still relatively strong downstream of S3. When calculating the relative entropy variation based on Denton’s mixing model, attention should be paid to the relationship between the leakage flow velocity affected by the hub gap and the mainstream velocity, as well as whether the mixing has been completed in the blade passage.
Introduction
In the past decades, a great deal of research has been done on compressor leakage flows, most of which focus on tip leakage flow and less on hub leakage flow. The rotor tip and stator hub clearance can be less than 0.5% span in the front stages and as large as more than 5% span in the rear stages of axial compressor in large industrial gas turbine. 1 The hub clearance is very important to the design of the cantilevered stator in the high-pressure compressor (HPC), because it will impact the aerodynamic performance and stability of the compressor. The effects of the stator hub configuration are strongly dependent on the stator design and the flow field details under consideration, 2 thus far the effect of variation in hub clearance of the highly loaded cantilevered stator has not yet been satisfactorily quantified and the parameter values that mark the change in the behavior are not known in any depth.
The hub leakage flow and mainstream mixing within the HPC is unsteady and heavily influenced by incoming rotor wakes. In addition, the effects of the skewed incoming boundary layers through the development of multi-stage compressor should be considered because leakage mixing loss and viscous shear loss are greatly affected by it. 3 Therefore, the true multi-stage flow field of LSRC is very necessary and could create unique opportunities to analyze an “embedded” stage (i.e. the third stage). Therefore, this is also the reason why this paper adopts the LSRC test rig. Lange et al.4,5 carried out LSRC experimental investigation and showed that a reduction in isentropic efficiency over stator 3 and rotor 4 with increased hub clearance. Swoboda et al. 6 and Campobasso et al. 7 presented that a stabilizing effect of the hub clearance vortex (cleaned up separation on hub). Montomoli et al. 8 calculated the LSRC test rig and showed that the unsteady simulation could reproduce total pressure loss experimentally observed near the hub at the stator exit but not found in the steady simulation. Tschirner et al. 9 carried out LSRC test on three kinds of hub clearances (1.8, 3.0, and 4.8 mm, corresponding to 1.79%, 2.98%, and 4.76% span), with the purpose of studying the impact of increased running hub clearance on standard airfoils such as medium loaded stators, and showed that a sensible impact of increased running gaps onto compressor stability. Ju et al. 3 studied the cantilevered stator with 1.1% span of hub clearance and gave the evolution of the hub leakage flow at NS operating condition compared with DP.
The main loss in the cantilevered stator comes from hub leakage vortex (HLV), which rolls up and passes downstream. When the stator hub clearance increases, the enhanced leakage flow can suppress the transverse migration of the low energy flow near the hub, but excessive leakage flow could induce new mixing loss. How to control the loss caused by the hub leakage flow is the focus of research. One of the loss control methods is to give an optimum clearance (Beselt et al. 10 and Liu et al. 11 ). In addition, non-uniform clearance is also used to control the loss. 12 Other effective methods to control the loss caused by the hub leakage flow are to adopt bowed13–17 and forward end-sweep18,19 cantilevered stator design to improve the flow field near the hub. In this paper, the cantilevered stator adopts positive bowed and fore-sweep three-dimensional design of the fore-loaded blade near the hub region to control the loss. The main purpose of this paper is to use the LSRC test rig to better understand the effect of hub clearance in the design space (from 1.1% to 4.5% span) and detailed flow characteristics of a highly loaded cantilevered stator with this loss control method.
Rig description
The SJTU LSRC, modeled according to the rear stage of a high-pressure compressor, consists of four repeating stages (i.e. rotor and stator blade rows) plus an inlet guide vane (IGV) row, as shown in Figure 1. 3 The measuring stations are also shown by the dashed lines in Figure 1(b).

Aerodynamic survey locations of the SJTU LSRC, Ju et al. 3 : (a) test rig and (b) measuring stations.
The hub and casing diameter of LSRC are 1320- and 1500-mm parallel annulus, respectively. Except for the cantilevered stator with designed 1.1% span hub clearance of the third stator, other stators are shrouded with two labyrinth seal-teeth. The cantilevered stator adopts positive bowed and fore-sweep three-dimensional design of the fore-loaded blade near the hub region, as reported by Ju et al. 3 The design parameters of LSRC stage 3 are shown in Table 1.
Design parameters of LSRC stage 3 with a cantilevered stator.

Numerical setup and verification
Numerical setup
Commercial numerical simulation software NUMECA was adopted to simulate the 1.5 stage (R3, S3, and R4) by URANS method at both DP and NS working conditions, respectively. The details about computational domain are shown in Figure 2, and one passage of R3, S3, and R4 is selected as the computation domain. To ensure that the number of passages for three blade rows is 1:1:1, 76 blades of S3 on the experimental rig were reduced to 72 and the solidity kept unchanged by geometrically scaling the S3 chord, and it also reduces computing resources in the time marching solutions. The fillet radius at the rotor hub and the stator tip is 4 mm. Five numerical probes for monitoring static pressure fluctuation, marked from MP_1 to MP_5, are located at upstream and downstream of 10% span of S3, the near leading edge, mid-chord, and near trailing edge in the middle of the hub clearance, respectively.
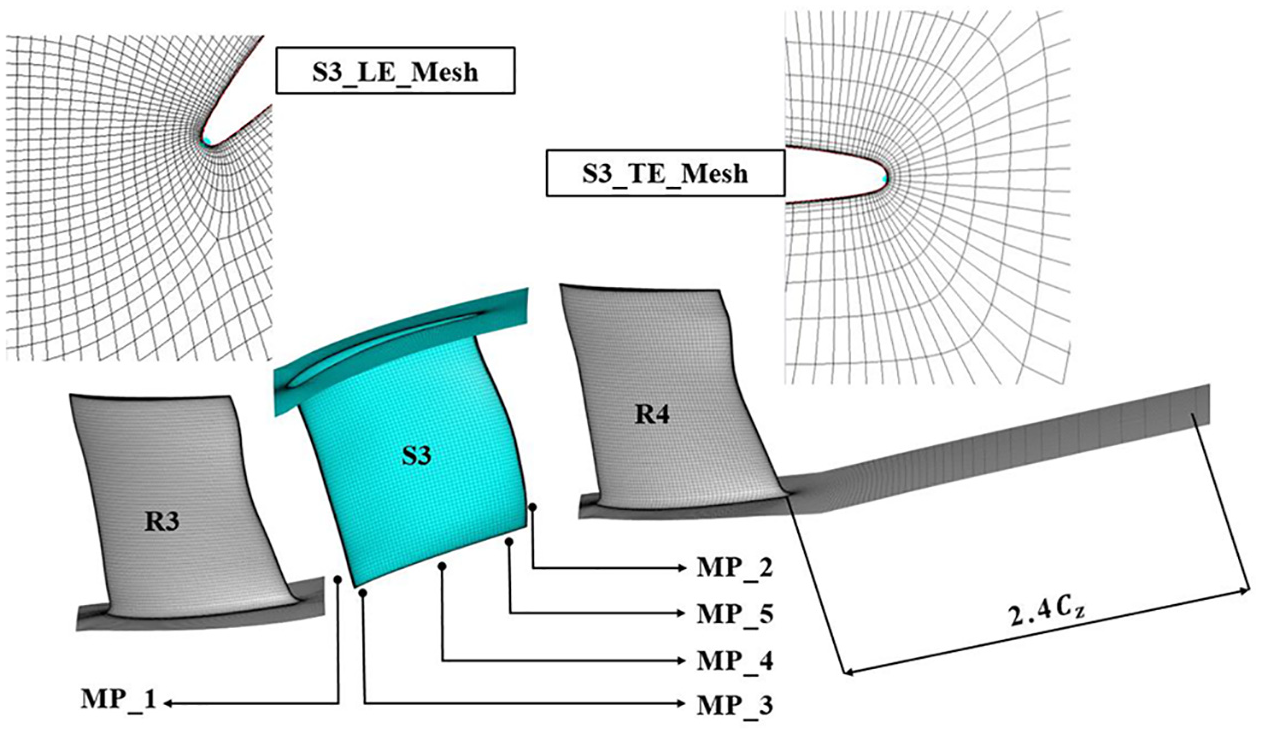
Computation domain with monitor point location.
According to the hub clearance size of the cantilevered stator, four computational cases are set, as shown in Table 2. All clearance sizes are actual for the high-pressure compressor. Of the four cases, 1.1% span case was selected the prototype for subsequent comparison.
Four computational cases.

The inlet boundary is located at the plane measured in the experiment and specified with radial distributions of the total pressure and absolute flow angle and the averaged total temperature. At the outlet, the boundary is lengthened to 2.4 times of the axial chord (Cz) of R4 and set to experimentally determined mass flow rate, by adjusting radial equilibrium static pressure at the outlet to meet the set mass flow rate. The explicit algebraic Reynolds stress model (EARSM) is selected as the turbulence model, and the model yields a realistic level of mixing and blockage by comparing with the experimental data.
20
For the URANS simulation, the solver employs the dual time stepping algorithm that marches the RANS equations in
The mesh was generated by the NUMECA Auto-Grid-5 module. OH-type is used for rotor tip clearance and stator hub clearance mesh, O4H topology is used for other computational domain, and the minimum orthogonality of the meshes is greater than 20°. When the clearance changed from the prototype (1.1% span case) to larger clearance size, the radial grid points increased correspondingly. In the research of Roache,21,22 the convergence index


where
The hub leakage mass flow rate was used to evaluate the grid sensitivity. Tables 3 to 5 shows the radial grid number in the hub clearance, hub leakage flow rate
Sensitivity of radial grid points in the hub clearance of 2.5% span case.

Sensitivity of radial grid points in the hub clearance of 3.5% span case.

Sensitivity of radial grid points in the hub clearance of 4.5% span case.

There are approximately 3.1 million cells in the one passage computational domain for the prototype, and each blade row has at least one million cells. The first layer of mesh is
Figure 3 shows the convergence history of the static pressure at the monitor points of 1.1% span case and 4.5% span case at NS point. The characteristic period is related to the blade passing frequency. The fluctuation of MP_3 and MP_4 is mainly determined by hub clearance flow. When hub clearance changes from 1.1% to 4.5% span, the static pressure value is significantly different.

Convergence history of the static pressure at the monitor points at NS condition: (a) 1.1% span case and (b) 4.5% span case.
Verification of numerical solution
To verify the accuracy of the numerical simulation, the comparison between experimental data and numerical results is given. Table 6 shows the mass flow rate and relative error compared with experimental data at both DP and NS working condition, and the working condition of numerical simulation is consistent with the experiment.
Comparison of mass flow rate between experimental data and numerical results.

Figure 4 shows the radial distribution of the total pressure Pt, static pressure Ps, and absolute flow angle

Radial distribution of Pt, Ps, and
As shown in Figure 4, the main difference area is concentrated above 80% span and the reason may be related to the installed two-dimensional radial and circumferential moving test probe which leads to slight air leakage. The results predicted by URANS method is much closer to experiment measurement compared with the results predicted by RANS method, therefore, URANS method is necessary to simulate the 1.5 stage flow field. The error bar was given as the three times of standard deviation and the error is within an acceptable range, which indicates that URANS simulation is effective. Therefore, the following analysis will be based on the URANS time-averaged results.
Results and discussion
Loss model
Table 7 shows the variation of the static pressure coefficient and loss coefficient of S3 with different hub clearances. The parameters are calculated as follows
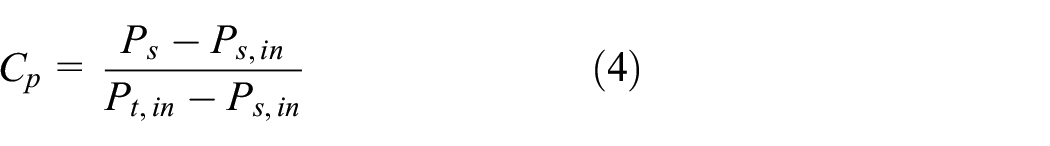

where all the parameters are the mass averaged results, and the subscript in and out represent inlet and outlet, respectively.
Variation of

As shown in Table 7, with the increase of hub clearance, the static pressure coefficient decreases and the loss coefficient increases. For the same clearance, the performance change at NS condition is greater than that at DP condition, which is caused by the higher loading at NS condition.
The leakage mass flow rate is calculated as follows

where the variable S is the section surface area.
Figure 5 depicts the hub leakage mass flow rate variation with the increasing hub clearance at both DP and NS working condition. The hub leakage mass flow rate increases linearly with the hub clearance. At NS condition, the hub leakage mass flow rate is more sensitive to clearance size.
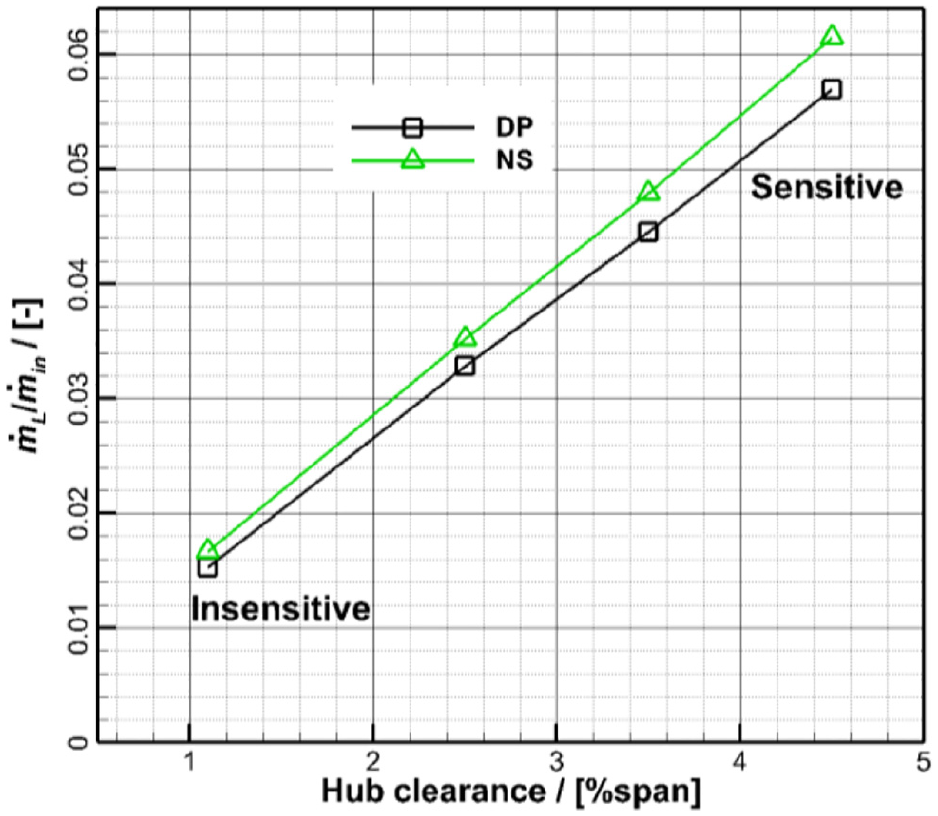
Sensitivity of clearance variation to the hub leakage mass flow rate.
As for the leakage flow loss model, Denton 23 proposed the clearance flow mixing loss model as early as 1993 in the quick prediction of the loss generation from clearance flow. The entropy creation leakage flow is given in equation (7) (named Denton_equation1), and the entire entropy creation is provided in equation (8). But in the circumstance that all the relative kinetic energy of the secondary flow is lost, the loss should be predicted by equation (9) (named Denton_equation2).


First equation gives a lower loss when Vm < Vc because the lost kinetic energy argument does not account for the static pressure recovery caused by jet momentum. Denton 23 recommended equation (7), but in the cantilevered stator, the hub leakage flow will be accelerated by the viscosity effect caused by the rotating hub and the leakage flow velocity Vc is higher than the mainstream velocity Vm. For tip leakage flow, equation (7) is suitable, but for the rotating hub in the cantilevered stator, equation (9) may be more suitable, which is a completely different circumstance from tip leakage flow.
Figure 6 shows comparisons of relative entropy variation in S3 passage with different hub clearances based on Denton leakage mixing model and URANS. The loss predicted by Denton equation_1 is lower than numerical calculation results due to Vc > Vm, but Denton equation_2 is in good agreement with the URANS results at 2.5% span. This is well supported for the above analysis. The larger the difference between Vc and Vm, the worse the accuracy of Denton equation_1. When the clearance reaches 3.5% span and 4.5% span, the loss of numerical calculation in Figure 6(b) is smaller than that of the mixing model. The reason is that when the hub clearance reaches a critical value, the mixing process will be completed outside the stator passage, while Denton’s 23 model is based on complete mixing within the passage.

Comparisons of relative entropy variation with hub clearance at DP condition: (a) Denton_equation1_DP and (b) Denton_equation2_DP.
Span-wise distributions of aerodynamic parameters
Figure 7 shows the span-wise distributions of the diffusion factor (DF) and the definition is calculated as follows:

where
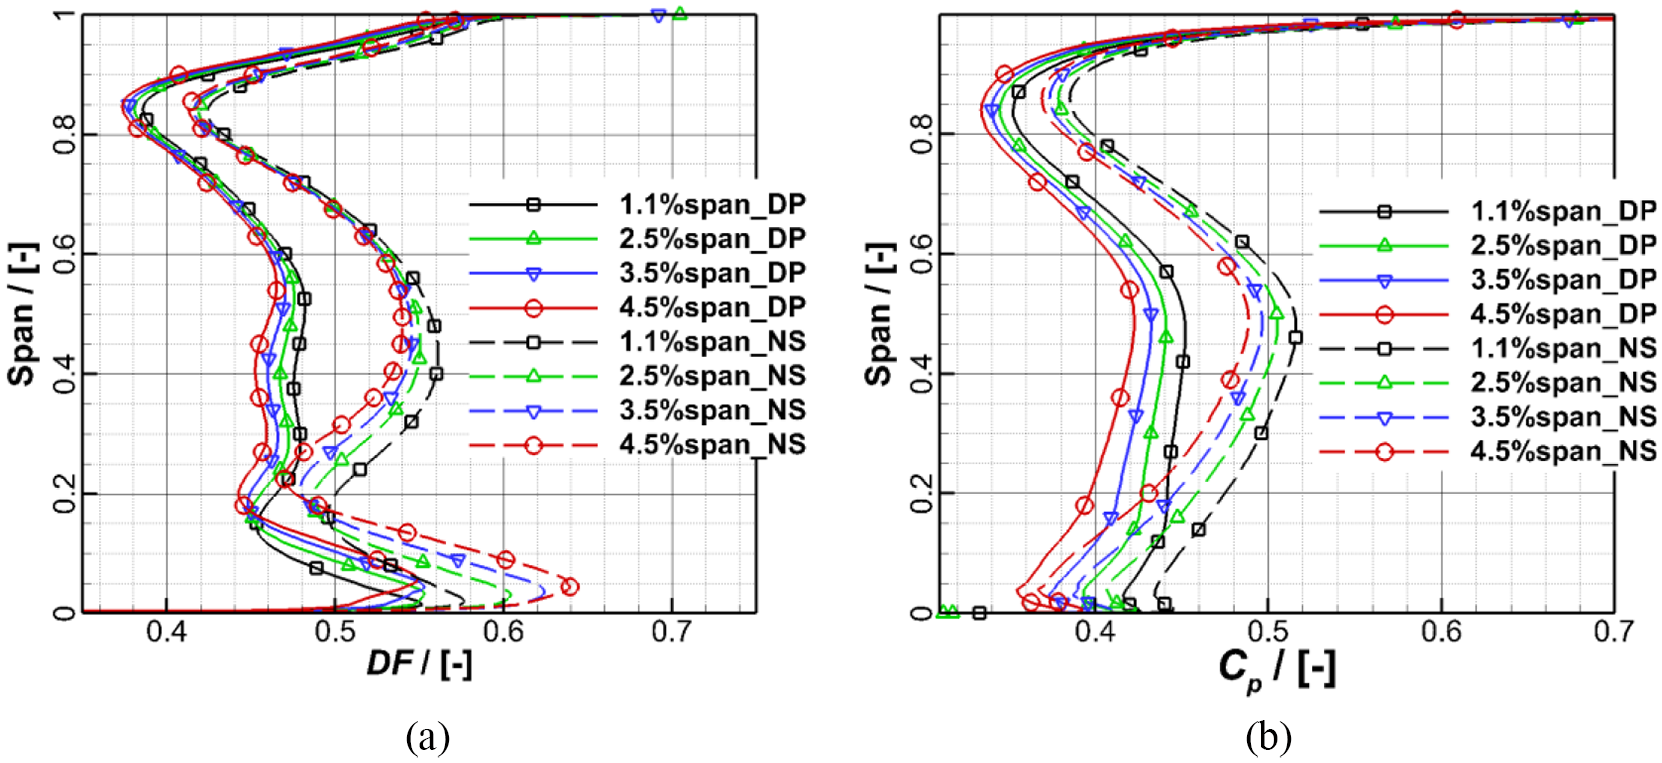
Span-wise distributions of DF and Cp of S3: (a) DF and (b) Cp.
As shown in Figure 7(a), with the hub clearance increasing from 1.1% to 4.5% span, the DF value gradually increases below about 15% span, and decreases from about 15% span to 60% span. Over 60% span, the difference caused by the hub clearance variation can be neglected. As shown in Figure 7(b), the Cp value decreases with the increase of hub clearance, and the influence of Cp decreases with the increase of radial position.
Figure 8 shows the span-wise distributions of S3 outlet flow angle (

Span-wise distributions of S3 outlet flow angle: (a) at DP condition and (b) at NS condition.
Figure 9 depicts the total pressure loss coefficient (

Span-wise distributions of S3 total pressure loss coefficient: (a) at DP condition and (b) at NS condition.
Variation of Blockage Coefficient and Loss
The blockage coefficient (B) is usually calculated as follows


where the parameters of
Figure 10 depicts the blockage coefficient from LE to TE with 5% axial chord interval, which is clear to evaluate the blockage growth. For 1.1% span case at the DP working condition, the blockage coefficient goes down at first from LE to 5% Cz, then the value grows slowly until 40% Cz. The blockage remains nearly unchanged until 65% Cz which indicates that the no flow field blockage deterioration occurs in this range. Afterwards, the blockage value increases rapidly until TE. When the hub clearance size increases, the overall trend is like the prototype 1.1% span case and the value is obviously higher than the prototype. When the working condition changes from DP to NS, it’s a little bit different. Firstly, the blockage coefficient decreases from LE to about 10%–20% of axial chord according to the clearance size, and then the blockage value remains basically unchanged until about 55% Cz, and finally the blockage area increases sharply. Obviously, the blockage in the rear part is caused by the suction side separation. In the following section, the separation is explained through blade loading.
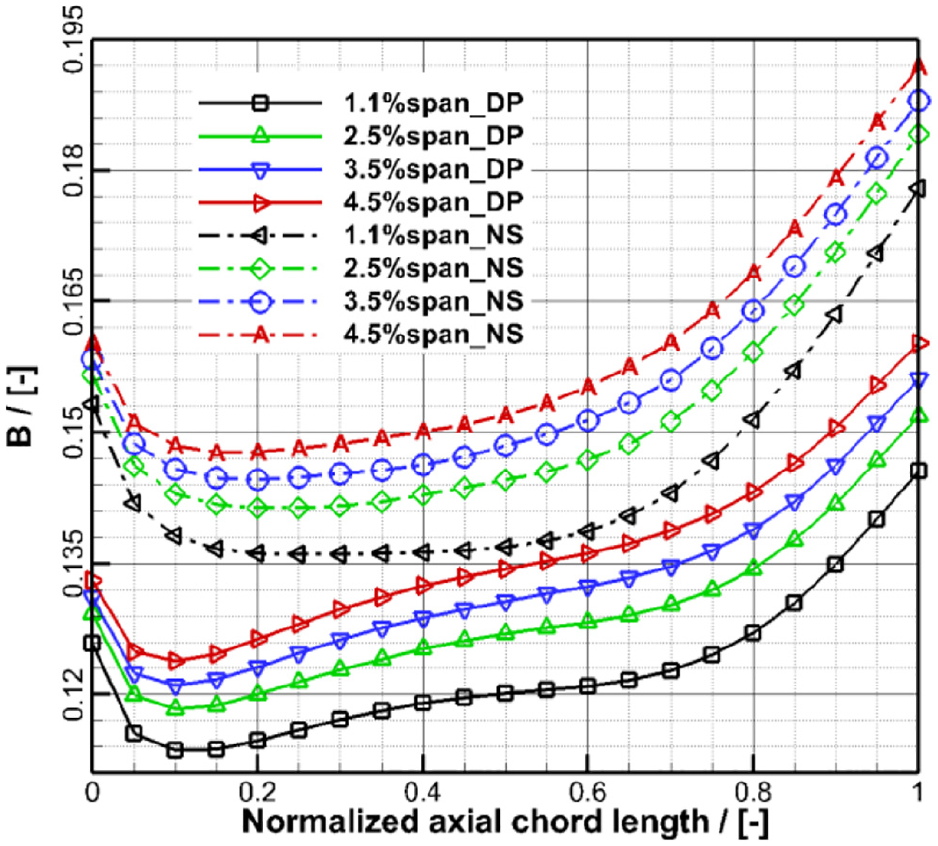
Variation of blockage coefficient with clearance from LE to TE.
Figure 11 shows the total pressure loss coefficient with different hub clearances from leading edge to trailing edge and the static pressure coefficient on the suction side at the design point. The axial cut planes are sequentially located at 10%, 20%, 30%, 50%, 70%, and 90% axial chord. As shown in Figure 11, with the increase of clearance, the loss range from suction surface gradually increases. For 1.1% and 2.5% span case, the loss range after 50% chord changes little, while in other cases, the loss range after 50% chord increases significantly. This shows the strength, location, and range of the leakage flow mixing, except that the mixing of leakage flow in 1.1% span case and 2.5% span case is basically completed in the S3 passage, the mixing of leakage flow in 3.5% span case and 4.5% span case is still relatively strong downstream of S3. This explains the inaccuracy of Denton leakage loss prediction model in the cases of large clearance sizes. Moreover, the low Cp region is delayed by the increasing hub clearance size, this caused the delay of formation of hub leakage vortex, which is another reason for uncomplete mixing process.

Total pressure loss coefficient and static pressure coefficient on the suction side with different clearance sizes at DP condition: (a) 1.1%span_DP, (b) 2.5%span_DP, (c) 3.5%span_DP, and (d) 4.5%span_DP.
Blade surface loading near the hub
The blockage and loss of the cantilevered stator are mainly caused by hub leakage flow, which is related to the static pressure difference between the pressure side and the suction side. The static pressure coefficient (Cp) and the difference between pressure side and suction side (

Figure 12 shows the Cp and
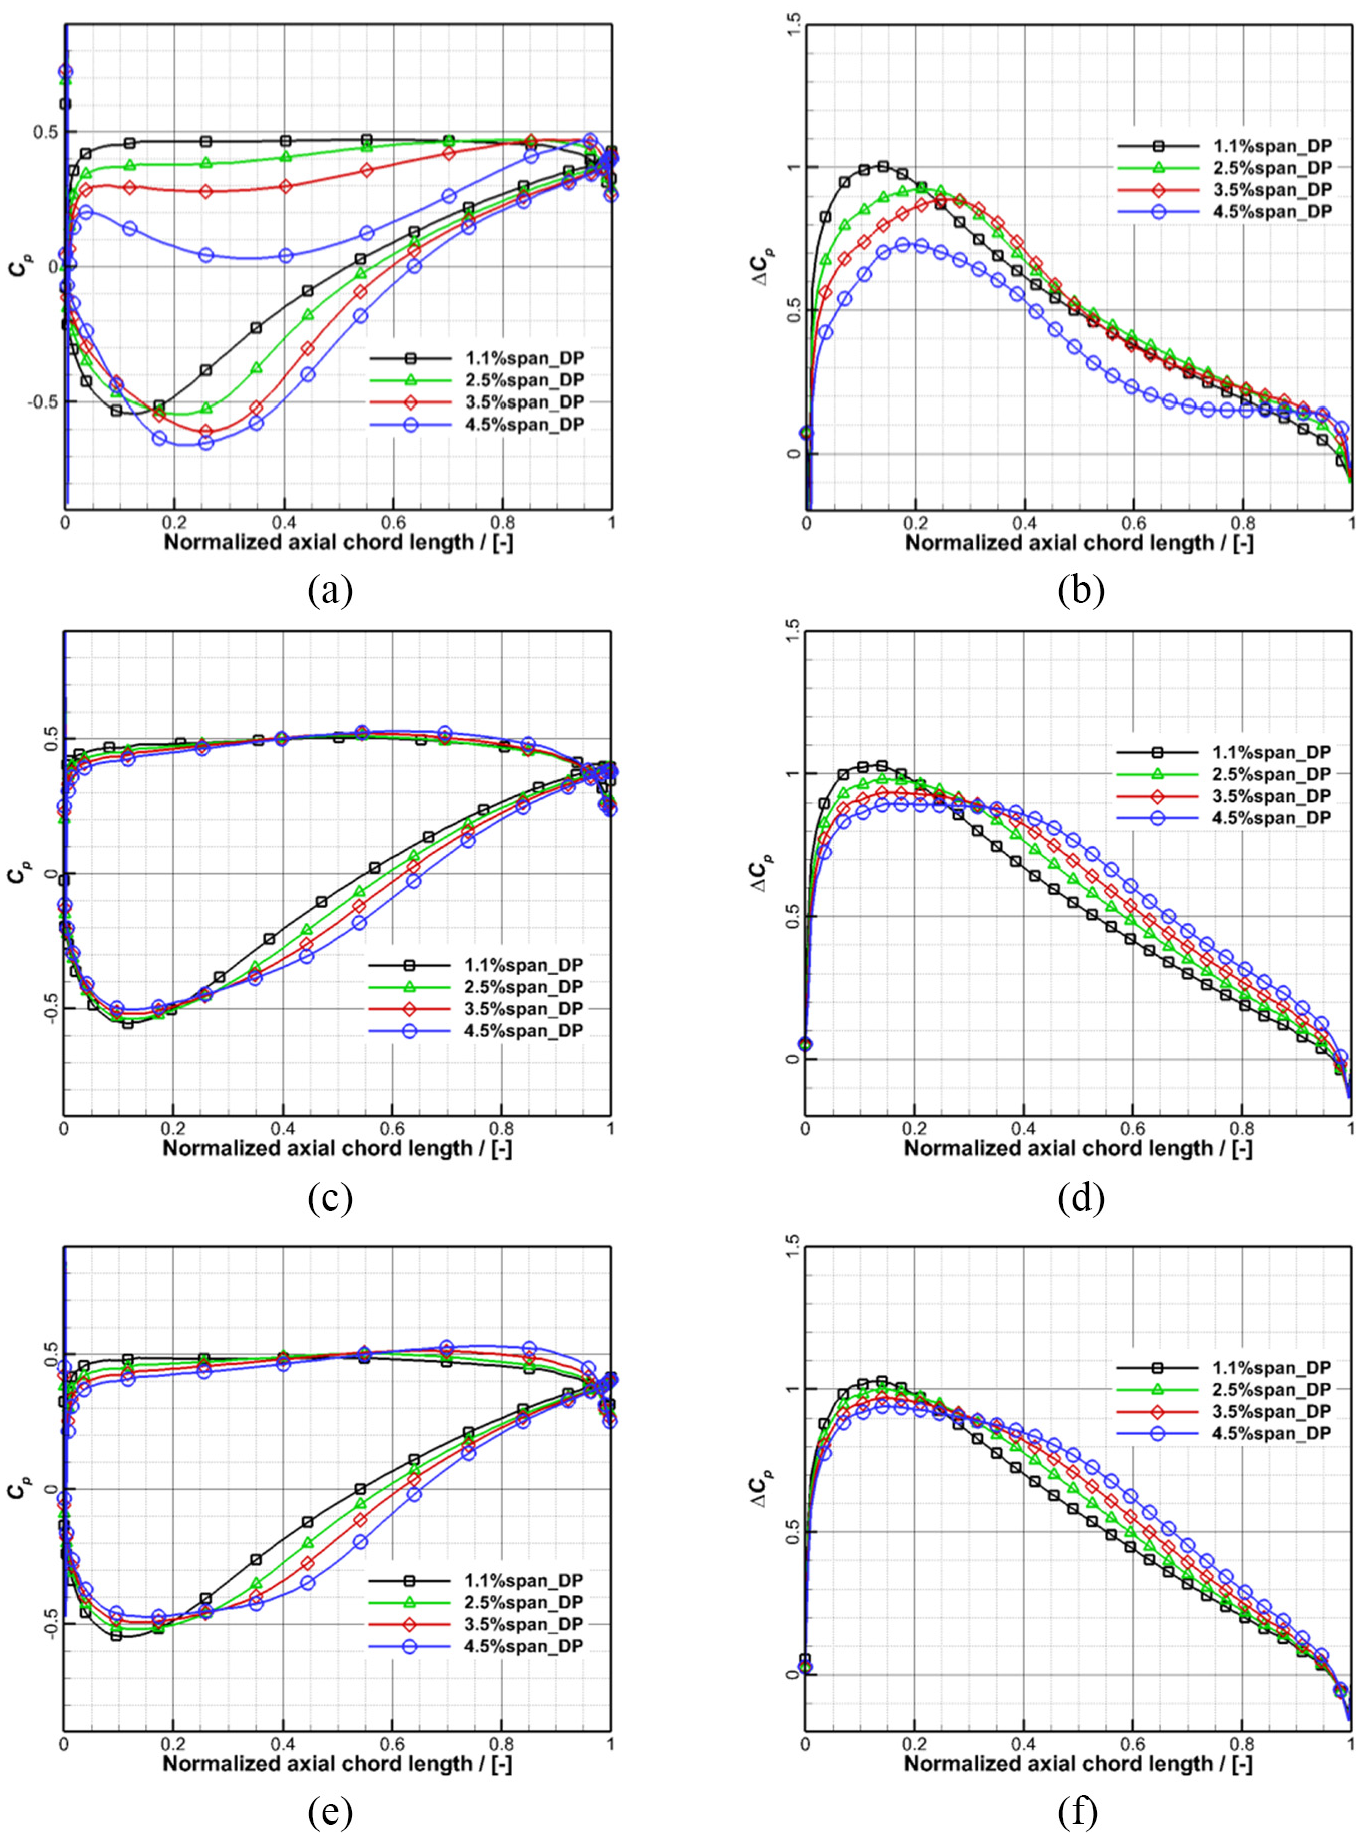
Cp and
As shown in Figure 12(a), (c), and (e), with the increase of clearance, Cp below 10% span is affected more severely, while the influence at 15% span is relatively smaller. And the loading moves backwards as the clearance increases. The
Variation of leakage momentum
The hub leakage mass flow rate per unit axial chord

where Vn and
The hub leakage mass flow rate per unit axial chord
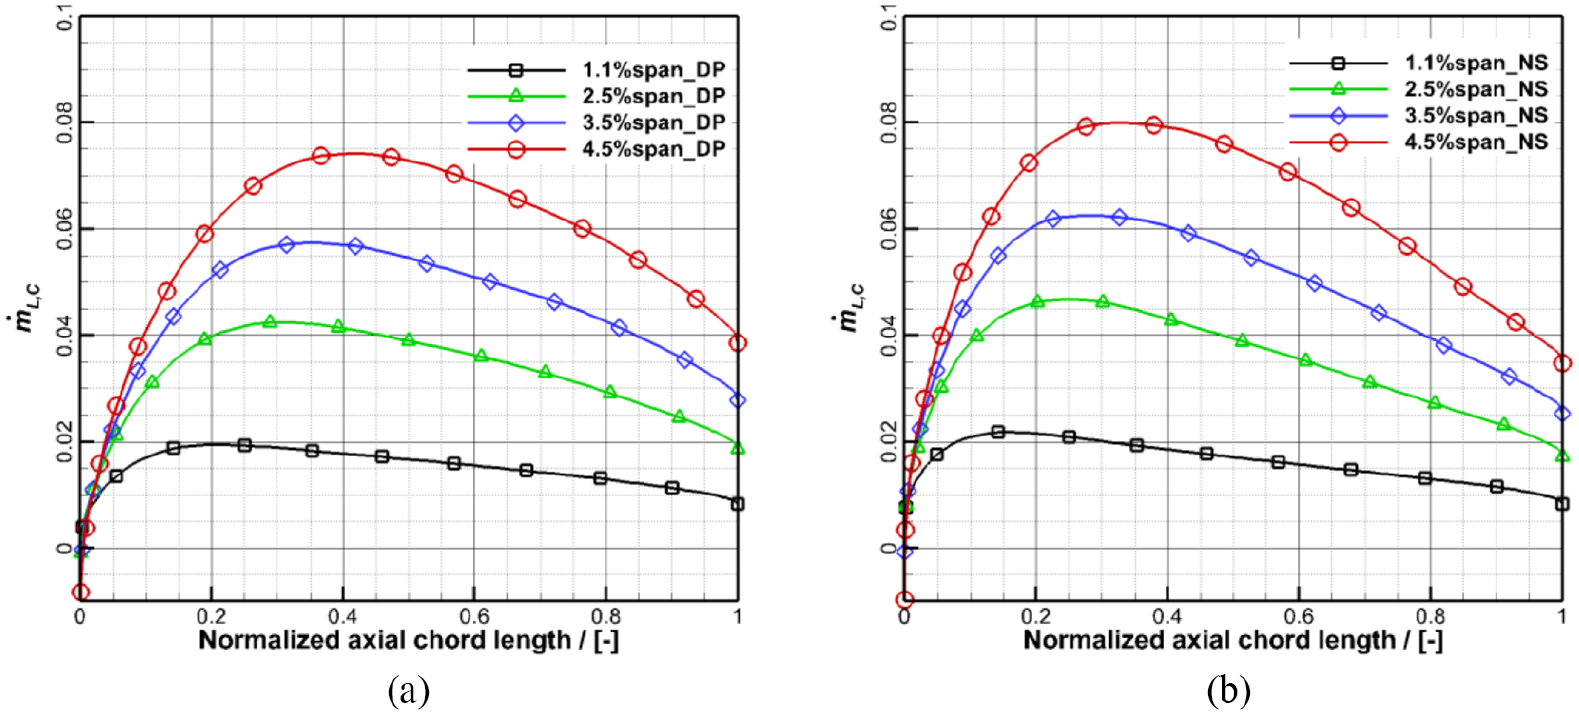
Leakage mass flow rate along the axial chord: (a) at DP condition and (b) at NS condition.
Apart from the hub leakage mass flow rate, the leakage momentum is critical for the hub leakage loss and aerodynamic stability near the hub region. The hub leakage flow axial and circumferential momentum per unit axial chord, as shown in Figure 14, are defined as

where the subscript z and t represent the axial and circumferential direction, respectively.
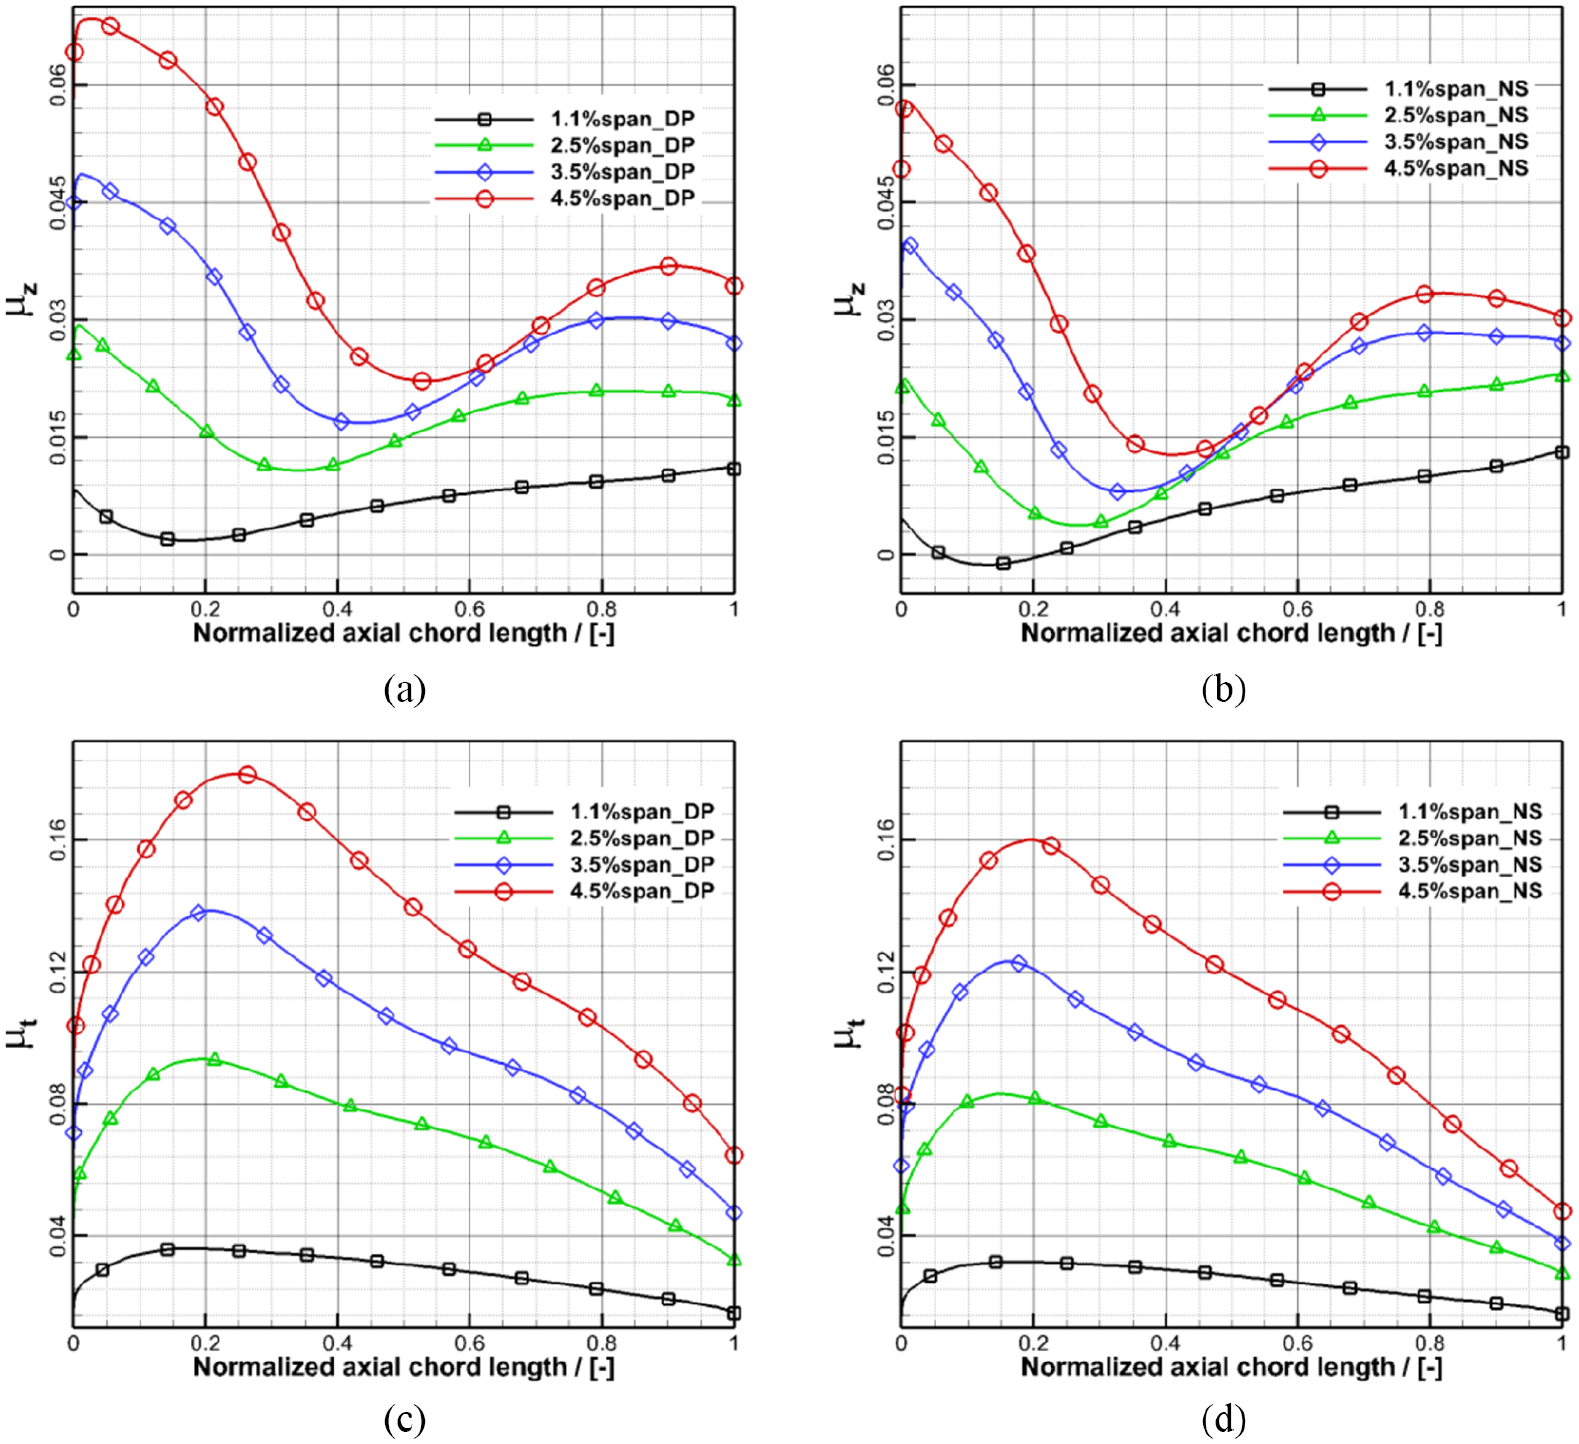
Hub leakage momentum along axial chord: (a) axial momentum at DP, (b) axial momentum at NS, (c) circumferential momentum at DP, and (d) circumferential momentum at NS.
As shown in Figure 14(a) and (b), the minimum
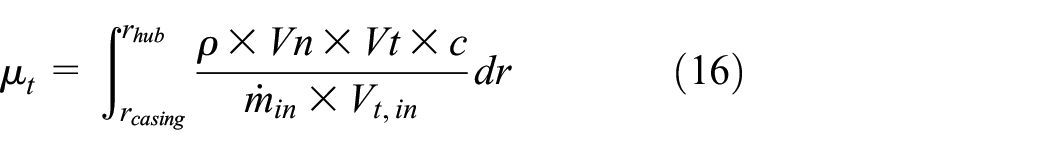
The total hub leakage flow axial momentum (

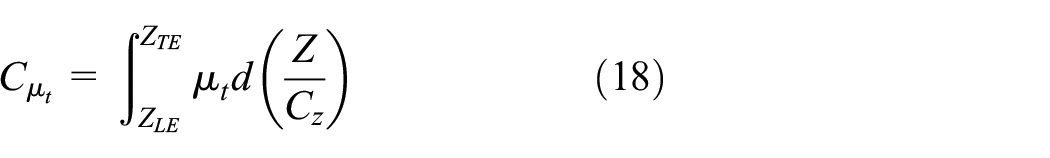
Figure 15 shows the integration of hub leakage flow axial momentum (

Integration of hub leakage flow axial momentum and circumferential momentum: (a) at DP condition and (b) at NS condition.
Conclusions
The effect of hub clearance in the design space (from 1.1% to 4.5% span) and detailed flow characteristics of a highly loaded cantilevered stator embedded in a 4-stage low-speed research compressor were mainly studied in this paper. The URANS numerical simulation was conducted in the computation domain of embedded stage 3 and R4 at both design point and near stall condition, and was verified by experimental results. The research details the quantified data between the aerodynamic performance and hub leakage flow when the hub clearance varies from 1.1% span to 4.5% span. The following conclusions are drawn:
In the design space of hub clearance, the loss coefficient of the cantilevered stator increases approximately linearly with the increase of hub clearance, moreover, the loss at the near stall condition is greater than that at the design point for the same gap. When designing the inlet metal angle of the downstream rotor, emphasis should be given to considering the inter-stage matching below 15% span.
The mixing of leakage flow in 1.1% span clearance and 2.5% span clearance is basically completed in the S3 passage, but the mixing of leakage flow in 3.5% span clearance and 4.5% span clearance is still relatively strong downstream of S3. This explains the inaccuracy of Denton leakage loss prediction model in the cases of large clearance sizes. Relative entropy variation based on Denton_equation_2 is in good agreement with the URANS results because the leakage flow velocity is higher than the mainstream velocity, which is different from the mixing loss in the rotor tip gap.
With the increase of clearance, the distributions of the static pressure coefficient and the difference between pressure side and suction side along axial chord below 10% span are affected more severely, while the influence at 15% span is relatively smaller. And the loading moves backwards along axial chord as the clearance increases. At the design point, the minimum hub leakage flow axial momentum of 1.1% span case is less than zero in a certain chord range near LE, which means that reverse flow occurs at the fore part of blade. The circumferential momentum value is much larger than the axial momentum, therefore, the circumferential momentum plays a dominant role in the loss near the hub. Controlling the value and distribution of hub leakage momentum can improve the aerodynamic performance of the compressor.
Finally, the main contribution of this paper to literature is summarized. The real multi-stage compressor working environment obtained by experiment in this paper provides a complex mixed flow field of multiple secondary flows, including the wakes of multiple rows of blades. And the boundary conditions of the inlet flow field have an important influence on the mixed evolution between the hub leakage flow and the main flow. On this basis, through in-depth analysis, the flow field characteristics of the cantilevered stator with different clearances are given, and the flow control mechanism of the cantilevered stator is explained by using positive bowed and fore-sweep three-dimensional design of the fore-loaded blade near the hub region, and the quantitative index of the leakage flow of the cantilevered stator is obtained.
Footnotes
Appendix
Handling Editor: James Baldwin
Declaration of conflicting interests
The author(s) declared no potential conflicts of interest with respect to the research, authorship, and/or publication of this article.
Funding
The author(s) disclosed receipt of the following financial support for the research, authorship, and/or publication of this article: This work was supported by the Natural Science Foundation of China (No. 51576124, No. 52076129), National Science and Technology Major Project (2017-II-0004-0017), the United Innovation Center (UIC) of Aerothermal Technologies for Turbomachinery, and Innovation Fund from Engineering Research Center of Aerospace Science and Technology, Ministry of Education.