
Abstract
A piston piezoelectric (PZT) pump has many advantages for the use of light actuators. How to deal with the contradiction between the piston amount and oil delivery quality is an essence when designing the pump. In order to depress the pressure pulsation and flow pulsation in a single-piston PZT pump, a two-stage attenuator is proposed. It involves an elastic cavity group and an unloading valve. Unsteady flow inside the pump is numerically calculated and analyzed to reveal its delivery characteristic in the whole pumping cycle. The distributing process of the passive valves is obtained through the dynamic mesh technique. Influences of key design and operation factors on the delivery performance of the pump are analyzed. The results indicate that the flexible cavity group and the unloading valve arranged at the delivery port can reduce the flow pulsation by 45%. The design can effectively provide stable flow for the actuator in a certain frequency range.
Introduction
Micro hydraulic pumps driven by intelligent materials have been widely used in light hydrostatic actuator control systems.1–4 Piezoelectric pump exhibits many advantages over conventional pumps, including simple arrangement, small size, light weight, large driving force, low leakage, fast response, low energy consumption, no noise, and no electromagnetic interference.5–9 However, the flow rate of the PZT pump which was used in high voltage and frequency situations is pulsating. Severe pressure and flow pulsation have a certain impact on the stability and accuracy of actuator control, it is very necessary to study the pulsation suppression of a single-piston pump.
The research on eliminating the pressure and flow pulsation of the pump has attracted wide attention.10–15 A new vibration active control method was presented to diminish the vibrations of the fluid power supply efficiently. 16 O’Shea 17 discussed the theory and implementation to reduce flow pressure ripple by influencing the speed of a relatively-high volumetric displacement low-inertia pump through open-loop control of the driving motor torque. Mironova et al. 18 developed a mathematical model of a pipeline system with a pressure pulsation damper under force excitation by oscillating fluid flow. It allows calculating the vibroacoustic characteristics of the pipeline system by oscillating fluid flow and values of inner forces in this system. The influence of dynamic exciting force on shell vibration of an axial piston pump is calculated and analyzed with the piston chamber pressure simulated by three-dimensional computational fluid dynamics model.19,20
Sung et al. 13 suggested designing relief grooves on the port plate to reduce pressure pulsation and completed the experimental verification. Bach et al. 21 developed a kind of integrated bio-inspired pulsation damper, which offers a high potential to dampen pressure pulsations of positive displacement pumps operating below 10 bar while allowing for a compact design. A pressure pulsation dampener (PPD) applied in the discharge chamber of a twin-screw refrigeration compressor was proposed based on the theory of Helmholtz resonator. An experimental study was then performed to validate the model and evaluate the effect of key parameters such as oil flow rate and cavity volume on attenuation performance of the PPD. 22 Xiaohui et al. 23 put forward an effective means that makes multiple accumulators which are charged different pressures connect with the outlet chamber of the water pump. Results of simulation and experiment revealed that three pairs of accumulators, whose parameters were optimally calculated from actual working conditions, could keep the pressure pulsation factor to about the allowable value all along when working pressure varied over the range. The movement of the bladder was simulated by dynamic mesh and user-defined function. The absorption effect of attenuator on pipeline pressure fluctuation was investigated under different inflating pressures and frequencies. The results showed that a reasonable selection of initial pressure of the attenuator could effectively reduce the pressure fluctuation of pipeline fluid. 24
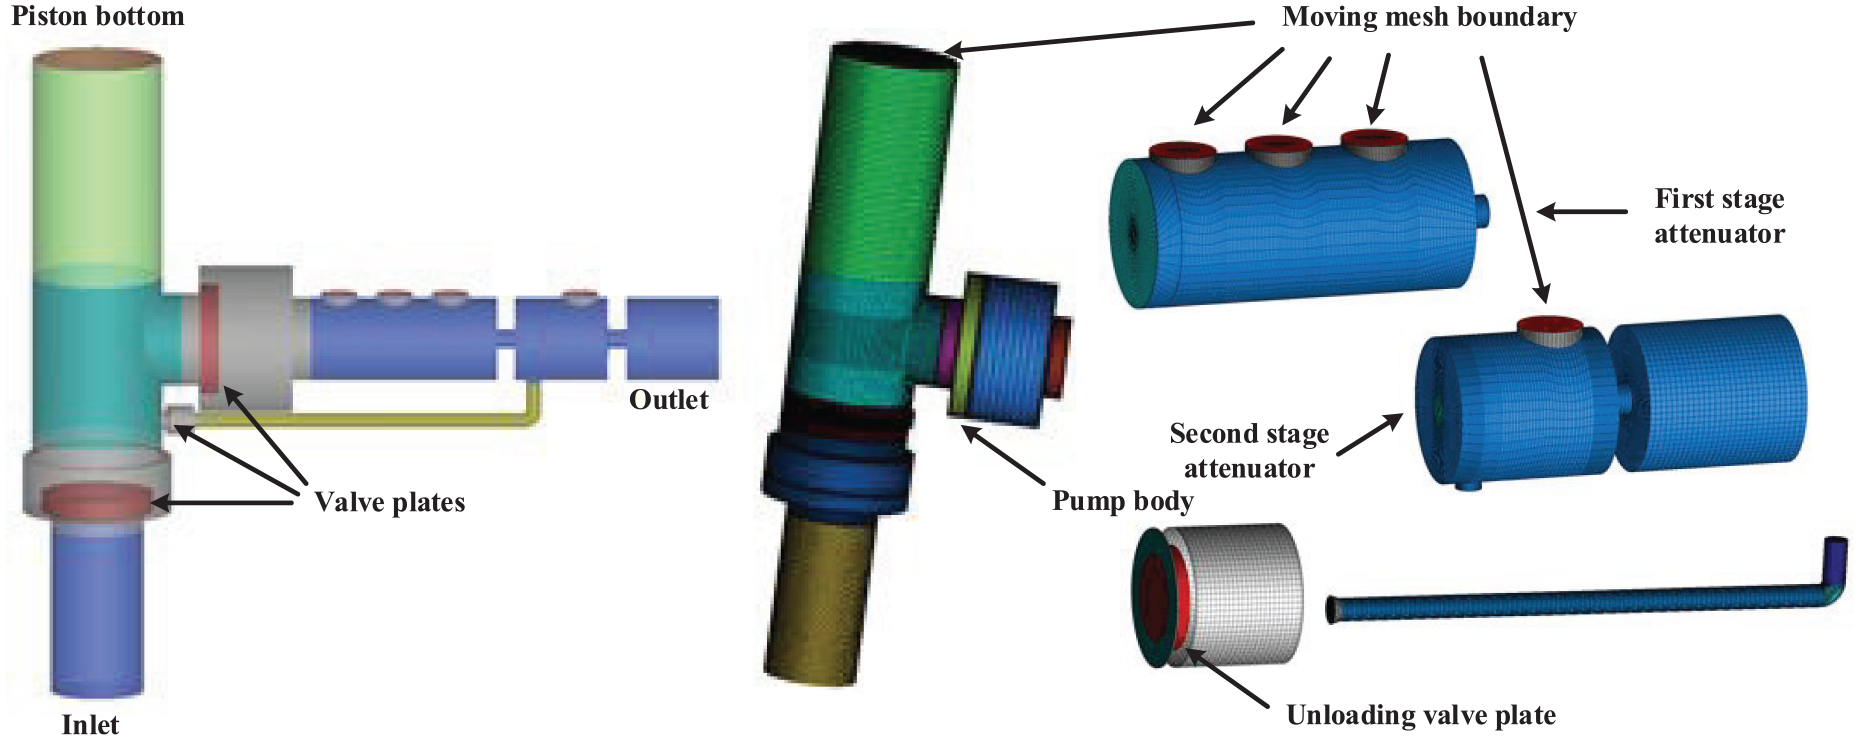
The design of the PZT pump attenuator realizes the pulsation suppression in two ways: pump chamber structure optimization and fluid transmission. As shown in Figure 1, the flow pulsation in the pipeline is absorbed by setting multiple elastic deformable cavities at the pump outlet. On the other hand, because of the large pressure pulsation in the pump chamber caused by the high-frequency operation of the PZT pump, a small flow channel is designed to connect the pump chamber with the second-stage attenuator, and the instantaneous high-pressure pulsation of the pump chamber can be suppressed by setting the opening pressure of the unloading valve reasonably. The flow released through the unloading valve attenuates the secondary pulsation. The design suppresses the pressure and flow pulsation of the PZT pump effectively, and does not cause the loss of flow.

Structure diagram of the PZT pump with attenuator.
Mathematical model
Pulsation damper
The principal diagram of the damper is shown in Figure 2. In this paper, the elastic deformation cavity group is equivalent to a spring-damping system. The mechanism of the flow pulsation is that the part of the instantaneous flow which is larger than the average flow is absorbed by the attenuator during the flow pulsation period. When the instantaneous flow rate is smaller than the average flow rate, the attenuator releases the absorbed liquid, so that the output flow of the system remains stable.

Principle diagram of the damper.
Ignoring the elastic modulus of the oil, according to Newton’s second law, the equilibrium equation of the flexible surface can be described below

where Pd is the oil pressure in the liquid cavity, P is the pre-compression pressure in the damper under any condition, K, x are the stiffness and deformation of the elastic material, C is its damping coefficient, A is the contact area between the bladder and the liquid, which is approximately the cross-sectional area of the damper shell.
Pump chamber
The pressure of the pump chamber varies with piston displacement (driven by PZT stack). The continuity equation of the fluid yields the following as

where Qin and Qout are the inlet and outlet flow rate of the pump, respectively. D is the piston diameter, and y is the piston displacement of the pump chamber.
Check valves
Dynamics equation of two distributing valves are expressed as


where Pin and Pout are the inlet pressure and outlet pressure of the pump, d1 and d2 are the port diameter of suction and discharge valves, respectively. K1 and K2 are the stiffness of the tightening springs for the suction and discharge valves, respectively. x1 and x2 are the openings of the valves, xa and xb are the pre-compression amounts of the springs, respectively, m1 and m2 are the mass of the corresponding valve plates.
Flow continuity equations for two valves are


where Cd is the flow coefficient of the valves, and ρ is the fluid density.
Numerical analysis
Motion equation in CFX
The deformation of the valve plate in the opening and closing process is very small. Accordingly, in order to simplify the calculation, the motion assembly of the distribution valve is assumed as a rigid body. The motion of the valve plates satisfies the following equation

where m is the mass of the plate, Ff is the fluid force on the plate, Fs is the spring force on the plate, F0 is the initial force, Ks is the spring stiffness, dt+Δt is the displacement of the valve plate at the time of t+Δt, and a is the acceleration of the valve plate at any time.

where vt represents the velocity of the valve plate at t, Δt is the time step. vt+Δt can also be written as

where dt is the displacement of the plate. dt+Δt can be deduced as

The dynamic mesh technique is adopted to model the motion of the valve plates, the elastic deformation cavity group and the piston of the pump chamber.
Boundary conditions
In order to improve the mesh quality, the model is divided into eight subdomains, as in Figure 3. The turbulence model is SST (Shear Stress Transport), the fluid is regarded incompressible. The criterion of convergence is that the average residual RMS is <1 × 10⁻⁴. Meanwhile, the continuity of the fluid in the flow field must be ensured in the dynamic mesh calculation, so the gap between the valve plate and the valve seat needs to be reserved, and the initial gap in this paper is 0.015 mm. In order to avoid negative volume mesh in the calculation, the displacement must be driven by the dynamic force equilibrium equation of the valve plates. In this study, it is coded through CEL (CFX Expression Language).
The fluid domain of the pump with attenuator and the associated FEM mesh.
Result and discussions
The suction and discharge process of the pump is realized by applying a sinusoidal signal to the stack. The hydraulic amplifier amplifies the stack displacement and transmits the sinusoidal displacement to the pump cavity piston. Under the condition of different driving frequencies and outlet pressure, the working process of the pump is simulated, and the range of simulation parameters is shown in Table 1.
Model parameters.

Figure 4 shows the average flow rate of the pump without attenuator for different driving frequencies under the back pressure from 5 to 50 bar. It can be seen that the peak of the average flow rate is 3 L/min, near the 120 Hz frequency. Because the opening and closing of the valves belong to passive motion, when the driving frequency is greater than the natural frequency of the valves assembly, the dynamic response of the valve plates will lag behind the movement of the piston in the pump chamber, which leads to the attenuation of the flow rate to a certain extent. This phenomenon widely exists in valved piezoelectric pumps. At the same time, the influence of the outlet pressure on the average flow rate is different in the low-frequency and high-frequency stages. In the low-frequency stage, the motion of the valve plates can well follow the reciprocating movement of the piston in the pump chamber, and the flow rate is mainly affected by frequency. In the high-frequency stage, the backflow phenomenon caused by the lag of the valve assembly will become more obvious with the increase of the outlet pressure.

Average flow rate without attenuator for different driving frequencies.
Two definitions are


where σ q and σ p denote the outlet flow pulsation rate and the chamber pressure pulsation rate, respectively. Figure 5 shows the pump chamber pressure and the outlet flow rate versus time within the driving frequency range from 20 to 120 Hz when the PZT pump is provided with an attenuator and the back pressure is from 5 to 50 bar. The curves display that the maximum and minimum value of pressure and flow rate are influenced by the frequency. According to equations (11) and (12), the outlet flow and pressure pulsation rate are consistent with the change of the driving frequency. Figure 6 illustrates that both pressure and flow pulsation rate reach the maximum value at 120 Hz, which increases by 942% and 732%, respectively.

Pressure and flowrate for different driving frequencies: (a) 20 Hz, (b) 40 Hz, (c) 60 Hz, (d) 80 Hz, (e) 100 Hz, and (f) 120 Hz.

Pressure and flow pulsation rate for different driving frequencies.
With driving frequency at 120 Hz, Figure 7 shows the velocity configuration in the pump chamber for one pumping cycle under five bar delivery pressure. During the suction (0–4.17 ms), with the opening of the inlet valve, the fluid velocity reaches the maximum at the valve seat and pump chamber successively, which is the main factor for the large pressure pulsation in the pump chamber. During the discharge (4.17–8.33 ms), the fluid velocity reaches the maximum nearby the valve seat and outlet successively, which is the main factor for the large flow pulsation.

Velocity of flow distribution over one pumping cycle: (a) t = 0.83 ms, (b) t = 1.67 ms, (c) t = 2.50 ms, (d) t = 3.33 ms, (e) t = 4.17 ms, (f) t = 5.00 ms, (g) t = 5.83 ms, (h) t = 6.67 ms, (i) t = 7.50 ms, and (j) t = 8.33 ms.
Figure 8 shows the displacement of the piston and valve plates after the attenuator is provided with the pump at the 120 Hz. With the sinusoidal displacement of the piston in the pump chamber, the inlet and outlet valve plates open alternately. At the same time, the unloading valve in the attenuator also shows a certain opening periodic movement ensuring parts of the flow from the unloading valve into the secondary attenuator. Table 2 shows the model parameters of the attenuator.

Displacement of the valve plates and chamber piston.
Model parameters of the attenuator.

Figure 9 shows six partial time-domain signal graphs under the conditions that are not connected to the attenuator and connected to attenuator with different driving frequencies. The inlet and delivery pressure are one bar and five bar, respectively. It can be seen from the diagram that the attenuator attenuates the flow rate in different conditions. The attenuator can effectively reduce the peak value of outlet flow from 20 to 120 Hz. When there is no attenuator, the backflow phenomenon of the pump is more serious at 80 and 120 Hz. When the attenuator is provided with the pump, the compensation of negative flow is more obvious.

Flow pulsation curves of pump with attenuator for different driving frequencies: (a) 20 Hz, (b) 40 Hz, (c) 60 Hz, (d) 80 Hz, (e) 100 Hz, and (f) 120 Hz.
Figure 10 shows the streamline distribution over one pumping cycle with driving frequency of 120 Hz. In the oil absorption process, the maximum velocity is distributed in the inlet valve and pump chamber. In the oil discharge process, due to the opening of the unloading valve, part of the flow flows from the unloading valve to the secondary attenuator. The unloading valve reduces the flow velocity of the main outlet valve, resulting in a better attenuation effect of the flow pulsation of the primary attenuator to the main outlet valve.

Streamline distribution over one pumping cycle: (a) t = 0.83 ms, (b) t = 1.67 ms, (c) t = 2.50 ms, (d) t = 3.33 ms, (e) t = 4.17 ms, (f) t = 5.00 ms, (g) t = 5.83 ms, (h) t = 6.67 ms, (i) t = 7.50 ms, and (j) t = 8.33 ms.
Figures 11 and 12 show the eddy viscosity distribution over one pumping cycle with or without attenuator at the same driving frequency. Eddy viscosity refers to the strong vortex mass diffusion and cascade hash caused by random pulsation when the fluid flow is in a turbulent state. In Figure 11, there is always a large eddy viscosity in the pump chamber without an attenuator, and the average eddy viscosity is 4 Pa s. It shows that the vortex mass pulsation of fluid particles in this region is strong, and the overall flow pattern is unstable. At the same time, the eddy viscosity in the whole pump chamber is generally reduced after the attenuator is provided. This shows that the installation of attenuators can reduce the intensity of vortex pulsation in the flow.

Eddy viscosity distribution over one pumping cycle without attenuator: (a) t = 0.83 ms, (b) t = 1.67 ms, (c) t = 2.50 ms, (d) t = 3.33 ms, (e) t = 4.17 ms, (f) t = 5.00 ms, (g) t = 5.83 ms, (h) t = 6.67 ms, (i) t = 7.50 ms, and (j) t = 8.33 ms.

Eddy viscosity distribution over one pumping cycle with attenuator: (a) t = 0.83 ms, (b) t = 1.67 ms, (c) t = 2.50 ms, (d) t = 3.33 ms, (e) t = 4.17 ms, (f) t = 5.00 ms, (g) t = 5.83 ms, (h) t = 6.67 ms, (i) t = 7.50 ms, and (j) t = 8.33 ms.
Figure 13 is a comparison of the flow pulsation rate with and without the attenuator at different driving frequencies. It can be seen from Figure 14 that the average flow loss is large in the range of 20–60 Hz, which is due to the partial flow loss caused by the damping of the attenuator structure, resulting in excessive pulsation rate. When the frequency is larger than 60 Hz, the attenuation curve tends to be the same with the increase of the driving frequency. It can be seen from Figure 14 that the effect of the attenuator is obvious, and the maximum attenuation rate can by 45%. The appropriate frequency range should be considered in the design of attenuation to make the effect of the attenuation rate better.

Comparison curves of flow pulsation rate.

Comparison curves of attenuation rate.
Conclusion
In order to depress the flow pulsation of the PZT piston pump better, the mathematical modeling and simulation analysis of the two-stage pulsating attenuator provided in the pump outlet are carried out. The simulation model is established based on the structure and working principle of the attenuator, and the simulation study of the model is carried out by using the dynamic mesh technology in the fluid dynamics software CFX. The simulation results show that the effect with attenuation achieves best when the frequency from 60 to 120 Hz, and the maximum outlet flow pulsation rate can be reduced by 45%. However when the driving frequency is smaller than the 60 Hz, the effect with attenuation is worse.
In view of the large pulsation rate caused by the intermittent oil supply of a single-piston pump, the designed attenuator can weaken the instability of output flow. It has many advantages includes better attenuation, multi-functional and strong adaptability compared with the traditional accumulator. The principle of attenuator proposed in this paper can be improved and applied according to the working characteristics of many kinds of hydraulic pumps. By adjusting the characteristic parameters of the attenuator, a stable oil supply flow can be provided for the actuator.
In the follow-up study, the influence of the structure of the attenuator on the efficiency of the piston pump and the influence of the change of outlet pressure on the effect of the attenuator should be considered.
Footnotes
Handling editor: James Baldwin
Declaration of conflicting interests
The author(s) declared no potential conflicts of interest with respect to the research, authorship, and/or publication of this article.
Funding
The author(s) disclosed receipt of the following financial support for the research, authorship, and/or publication of this article: This study was financially supported by the Natural Science Foundation of Jiangsu Province (Grants No BK20171412).