
Abstract
Plasma machining was investigated for suitability to cut thin sheets and the quality obtained was assessed. The aim of this research was to analyse the impact of the heat generated from plasma cutting on thin sheet surface deformation and heat affected zones. Plasma cutting was assumed to be noneffective for processing thin material, this technology was known primely for cutting medium to thick plates. Tremendous work was performed previously to improve the quality. However, there are no scientific publications assessed the effect of the plasma heat on thin material under 1 mm and optimised optimise the process to reduce the phenomena resulted to their minimal. The traditional cutting methods were found to be limited and time consuming. This research can be beneficial for vehicle convertors such as wheelchair accessible vehicles or similar industries where conventional cutting methods are still predominant. Therefore, an automated plasma cutter if properly optimised would be an effective solution. CNC Plasma cutter with an automated torch height adjustment was used for this experiment to process a 0.6 mm thick deep drawing cold rolled DCO1 steel grade material. Tests were carried out varying the plasma parameters speed, pressure and intensity, the quality obtained was assessed. Three-dimensional Triplescan Atos model was used to measure the maximum surface deformation. Samples were sectioned, mounted, polished, mirrored and etched with 5% Nital acid to expose the material grains. Results were gathered on a tables, then Taguchi method and Analysis of Variance were used to optimise and analyse the parameters. Results showed an effective cut for thin materials. The optimal values obtained were 8000 mm/min, pressure 70 psi and Intensity 25 A for sheet deformation whereas heat affected zones was cutting speed 8500 mm/min, pressure 80 psi and Intensity 30 A. Cutting speed and intensity had the highest impact on deformation however heat affected zones was influenced mainly by the cutting speed. The study suggested also that a mathematical model can be constructed to predict the response for both phenomena and assess the relationship strength, the method used was least square error, the tests showed that the models fit adequately and can be trusted to predict new values. Lastly, a vehicle chassis was used for the test, the results showed an effective cutting on painted material, no second processing was required. Sealant under the material required removal on plasma pathway to avoid excess smoke or fire generation. An estimation was made for the underbody chassis cut out processing time and it was found that automated plasma can reduce the cycle time to just above 40 min.
Keywords
Introduction
Wheelchair Accessible Vehicles can be described as vehicles that have been modified by experts to allow a disabled person to travel in their wheelchair safely. The process of conversion required cutting and lowering the floor chassis to provide an easy access for wheelchair users. The main techniques used for sectioning in the automotive industry where business focus is converting or modifying vehicles are mechanical tools known as conventional methods for example, circular and reciprocating saws. These tools turned out to have some limitations for instance time consuming, ease of use, profiling issues, accuracy, injury risks, tool size and weight. 1 The technology known nowadays in the market for profiling thin sheets steel is mainly laser, as this can result to a better accuracy, less deformation, narrow heat affected zones size, small deformation and excellent surface finish. However, the initial investment and operating cost 2 are primarily the reasons which motivated the engineers to find an alternative affordable technique. One of the most advanced technology available and widely used is plasma, this offered both affordability and productivity. 3 However, the suitability of plasma to process thin sheets without altering the material was a concern. 4 The conventional material thickness used when cutting with plasma is medium or thick range. 3 The technique is a cost effective and obtain a good quality results when used for thicknesses in the range between 5 and 40 mm. 4 However, one of the major issues encountered when cutting thin material with this technology was a surface deformation due to the amount of heat transferred to the material. Therefore, a proper settings to reduce this phenomenon was crucial. 5 The optimised settings required to achieve the best quality are not known, these are not provided by the manufacturers, therefore an investigation and analysis are usually necessary. 6 Some research assumed that plasma was not adequate for any thickness under 1 mm due to quality issues. 7 Hence, investigating on this problem was necessary to qualify the technology for processing thin materials under 1 mm and replacing mechanical tools.
The aim of this work was to demonstrate that plasma machining can be used to cut effectively thin materials under 1 mm (0.6 mm in this case) without altering the surface in addition to find ways to optimise the process to reduce the phenomena to their lower level. Plasma would provide a fast and more efficient way than mechanical tools if automated to process the underbody vehicle, this would overcome the issues faced. Plasma is used in overall to process medium thickness plates. Therefore, it is crucial to assess the deformation of the material caused by the heat before qualifying the technique. The objectives were to test and cut DC01 steel material 0.6 mm thick (similar material than the vehicle chassis rear floor), assess the quality, optimizing the parameters using statistical tool e.g. Taguchi method and ANOVA, check the level of improvement, qualify the plasma technique and implement the finding on a real chassis.
Ghane et al. assessed the effect of plasma parameters and the nozzle type on 20 mm mild steel cutting quality material removal and roughness. Çelik 8 looked at ways to optimise the plasma settings to reduce heat affected zones and roughness for a different mild steel material thicknesses 4, 6 and 8 mm. Lazarevic 9 on stainless steel material to assess the influence of the input parameters on kerf, roughness and bevel angle for different thicknesses 4, 6, 8, 12 and 15 mm. Ilii and Coteaţč 10 carried out a research on what drives the cost in plasma. Wang et al. 11 looked at the characteristic of the fume generated during the plasma cutting. Kavka et al. 12 assessed experimentally the effect of different gases on the performance of plasma cutting. Asiabanpour et al. 5 looked at the possibility to reduce desirability using surface response method using plasma for mild steel 6 mm thick.
There are many articles investigated the plasma cutting. The work performed previously on plasma was focused mainly in improving and understanding the quality cut obtained. Most of published articles was focused mainly on assessing the edge of the cut, this included in overall heat affected zones, kerf, roughness, bevel angle, edge squareness or dross, phenomenon such as deformation are neglected. Furthermore, previous investigations were made on materials thickness which falls within the conventional thickness range, plasma was already known to achieve an acceptable quality. 2 However, to date there have been no scientific publications on this topic which analysed the effect of the heat energy generated by plasma during the cutting on the surface deformation for thin materials under 1 mm. In addition, it was found that there is a lack of knowledge about the adequate settings required for a specific material or thickness in order to optimise the process to achieve the best quality possible and reduce the phenomenon to their lowest level. 6
Experimental methods
Material
The material used for the experiments was a 500 × 500 × 0.6 mm thin sheet cold rolled DC01 steel grade, similar material used for some parts in the automotive chassis underbody floor parts. The chemical composition of the low carbon steel material is 0.12% Carbon, 0.6% Manganese, 0.045% phosphorus and 0.45% Sulfur. 13 The mechanical properties of the metal are given in the Table 1 below:
Mechanical properties. 10

Plasma model
CNC (Computer Numerical Control) plasma was used in this study, Hypertherm Powermax 1250 model G3 series Torchmate T80M automatic distance adjustment torch-workpiece with capacity of 50% duty cycle. Voltage 240 V, pressure ranging between 40 and 90 psi and current between 20 and 80 A. Plasma model with current capacity up to 200 A was categorised by fabricators as low current machines. 14
Taguchi design
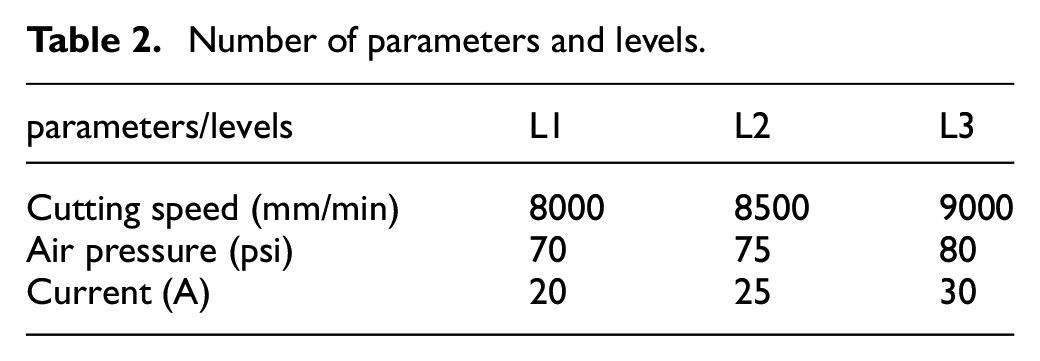
Taguchi method is a robust design used to optimise and analyse the parameters. The technique allows with a minimum number of trials to understand the influence of the input-controlled parameters on the output variables. Based on the number of levels and parameters chosen, Taguchi offers the possibility to identify the optimal combination required to improve the quality cut. 15 In this experiment, three input variables were used including cutting speed, current and gas pressure at three levels, the assigned values were summarised in Table 2. Orthogonal arrays table was constructed L9 (3^3), nine tests assigned at different combination as shown in Table 3 to cut nine specimens of 150 × 40 mm rectangle size.
Number of parameters and levels.
Experimental layout.

Surface deformation measurement
Nine specimens (150 × 40 mm rectangles) were collected from the experiment as seen in the Figure 1 below were analysed for surface deformation.

Specimens collected after tests.
The technology used to measure the deformation level was a 3D ATOS TripleScan state of the art surface analysis as shown in the Figure 2. 19 The technique is widely used in metrology field and in the automotive industry nowadays. The technology uses a non-contact blue light. 16 One single scan can take up to 16 million points inside the surface with high precision of 10 μm. 17 This technique can achieve a better result compared to a conventional tool such as probe gauge where an accurate measurement is difficult to obtain during the deformation assessment. Furthermore, this method was suggested by researchers as an efficient way to capture features detail in short time. 18

Three-dimensional ATOS TripleScan. 19
GOM inspect was used as a software to analyse the maximum deformation of each specimen. Gaussian best fit virtual plan method was used to construct the reference to measure the level. All nine samples were scanned and measured for deformation in same manner as shown in the Figure 3 (Trial One). Simulation was illustrated in the scan below to show different levels of deformation. Zones with the red colour represents the areas with a maximum level of deformation.

Scanned specimen and deformation value measured (Trial One).
The analysis showed different values for deformation in all specimens. Sheets were assessed independently. The values obtained were displayed in the Table 4 based on the Taguchi method experiment.
Deformation results.
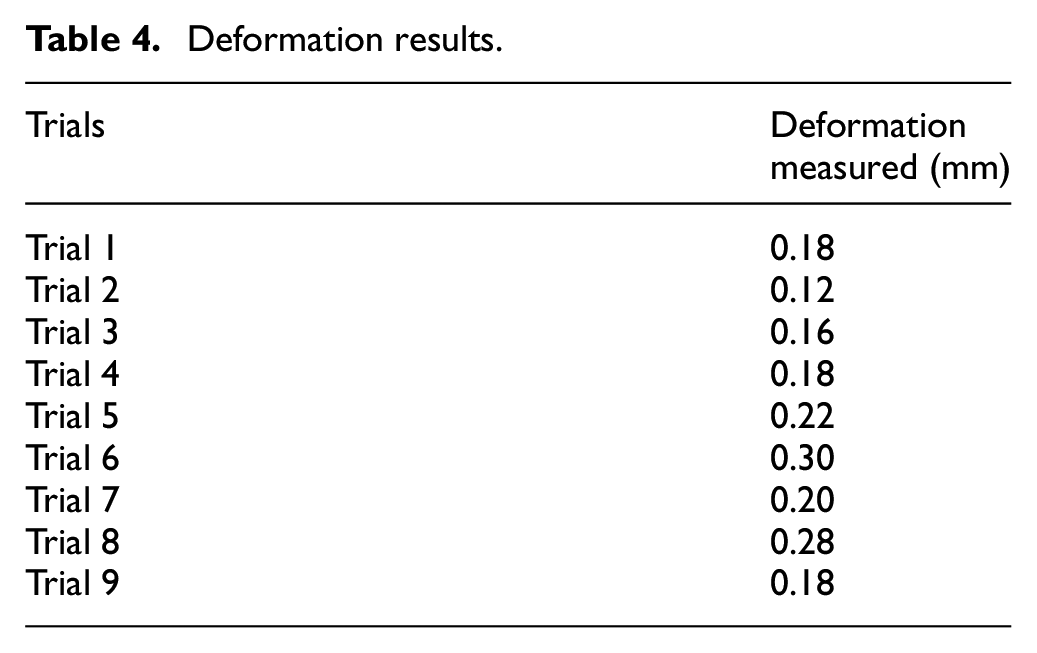
The results showed that the deformation did not exceed 0.3 mm. The values measured of the scanned parts fluctuated varying from 0.12 to 0.3 mm. The minimum value was obtained using parameters of the trial number 2 and the maximum deformation was obtained when parameters of the trial number 6 were used.
Heat affected zones measurement
The Specimens were sectioned to small rectangles of approximately 20 × 10 mm with Buehler AbrasiMatic 300 abrasive cutting machine, then mounted on a 40 mm diameter mould. The type of mounting press used was SimpliMet3000 Buehler using ProbeMet compound pressed to 290 bars at 150°C. Specimens were grinded and polished with a rotating machine AutoMet300 Buehler model using successively sandpapers, P120, P240, P400, P800, P1200 Grit Sic, followed by a mirroring process using 9 and 3 µm Metadi Supreme Diamond then 0.05 µm MasterPrep Alumina solution. Lastly, all samples were etched with 5% Nital acid to expose the grains. The specimens were assessed using a microscope Model LEICA DM12000M, magnification of 5, 10, 20, 50 and 100 times. All samples were measured in the same manner as shown in the Figure 4. Values obtained were in millimetres and given in Table 5.
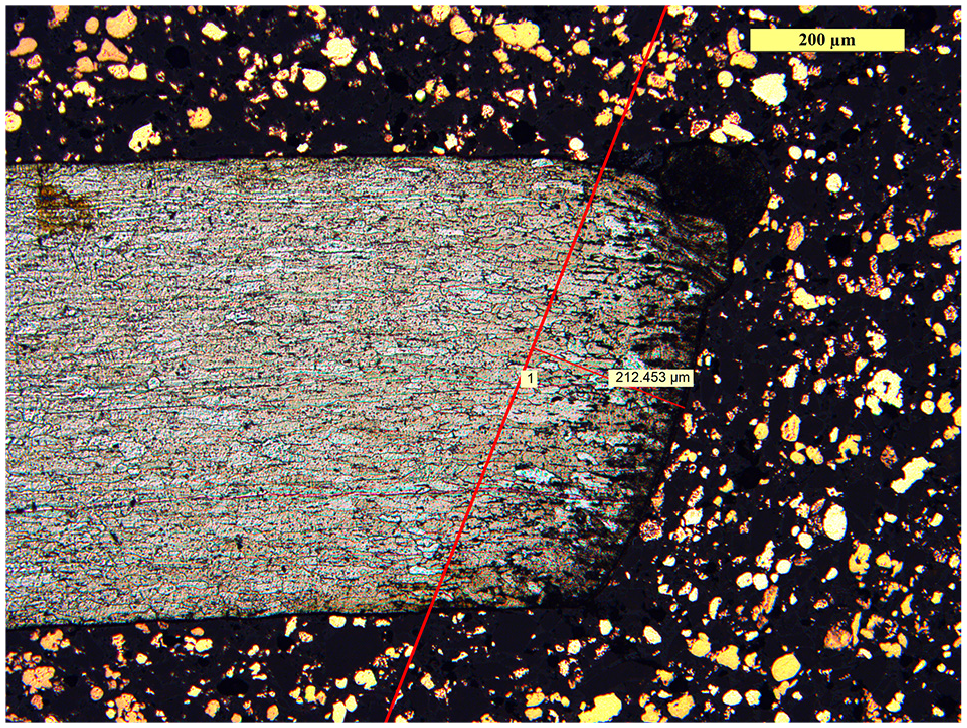
HAZ width (Trial 7).
Heat affected zones measured.

Heat Affected Zones is the volume material between the cutting edge and the base material which the mechanical properties are altered due to high heat input and fast cooling, this area is weaker compared to the unaffected base metal and can easily crack and cause problems during welding process. Therefore, it is undesirable for engineering applications. Zones affected exhibit a microstructure change and can be divided mainly into four areas, tempered area closest to the unaffected metal base, partly changed area, recrystalised area and the grain growth area which is closest to the cutting edge.20,21 Different areas in the HAZ (Heat Affected Zones) can be contrasted (heat tint) and visible due to high temperature distribution in the metal base and surface oxidation during a cut, usually HAZ is depending on the material used, the quantity of heat applied and the length of exposure. 21
Based on the Table 5 the values of the heat affected zones width varied from 0.154 to 0.403 mm. The values give a good indication that a second processing might not be required due to small size. The minimum value was obtained using parameters of the trial 5 whereas the maximum width measured was obtained when parameters of the trial one is used.
Parameters optimisation
In the current study minimising surface deformation and heat affected zones was required, this can be achieved using Taguchi method signal to noise (S/N) ratio. Therefore, smaller is the better option was selected. This was obtained with Minitab software using the equation below 22

Y is the observed response and n is the number of trials; S/N is Signal to Noise Ratio.
To identify the optimum parameters that can minimise the heat affected zones or sheet deformation the main effect graphs for signal to noise were given in Figure 5 for both phenomena, a (deformation) and b (heat affected zones). The levels that have the highest S/N ratio are the optimum parameters. 23

Optimal parameters obtained using S/N Ratio (a) Deformation (b) HAZ.
Based on the graphs in Figure 5, the highest levels signal to noise ratio corresponding to the optimal parameters which minimise the sheet deformation are cutting speed at 8000 mm/min, pressure at 70 psi and Intensity at 25 A whereas Heat Affected Zones are Cutting speed at 8500 mm/min, pressure at 80 psi and Intensity at 30 A.
The S/N Ratio obtained are given in the Table 6 for deformation and heat affected zones, the highest signal to noise ratio for the surface deformation is 16.41 db for cutting speed, 14.59 db for pressure and 16.07 db for intensity, this means that cutting speed and pressure at level one, intensity at level two is the optimal settings for the deformation phenomenon. The heat affected zones have 15.579 db as the highest value for cutting speed and successively 14.840 and 14.278 db for pressure and intensity, this also means that cutting speed at level two, pressure and intensity at level three are the optimal settings.
S/N ratio results for phenomena deformation and HAZ.

Analysis of variance (ANOVA)
ANOVA is an effective statistical tool used to analyse the effect of each parameter, this can summarise and give an approximative percentage of the controlled variables which are most influential on the response, in addition to the effect significance. The analysis was performed at 95% confidence for all levels, this represents the level of uncertainty. 26
Tables 7 and 8 above shows the results obtained from analysis of variance for the deformation and HAZ respectively. The most influential parameter on both responses was mainly cutting speed, this had a higher impact on both phenomena, HAZ at 70% and deformation 43%. Intensity has a biggest effect on surface deformation 52% slightly higher than cutting speed whereas HAZ showed a small effect of 8%. Pressure did not show a big impact on both responses, but it reflected more on the HAZ than sheet deformation, respectively 15% and 4%.
Analysis of variance for deformation.

Analysis of variance for HAZ.
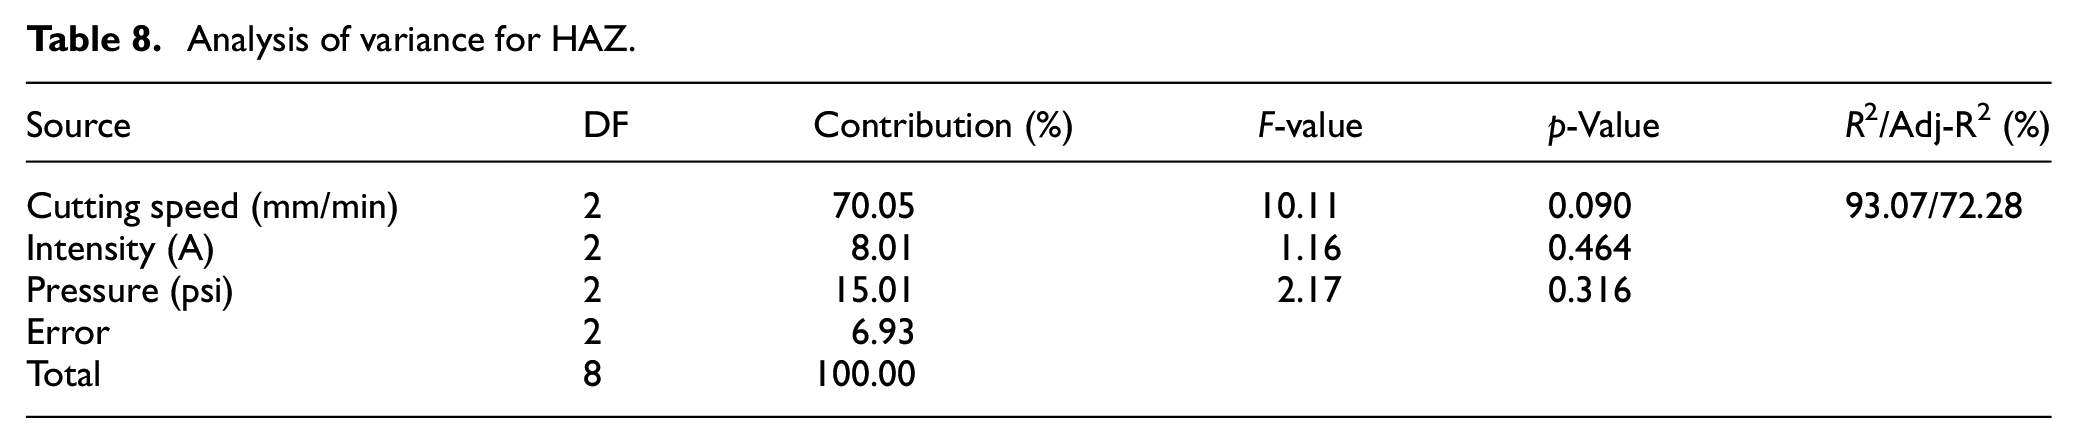
The results showed also that for deformation there was a statistical evidence that Cutting speed and intensity had a significant effect on the response as the p-values obtained were less than 0.05, 24 the values obtained were successively 0.031 and 0.026 but there was no evidence that pressure had a significant effect as the p-value was 0.235. In the other hand, the results showed that there was no statistical evidence that the effects were significant for the heat affected zones.
R-Squared known as the coefficient of determination can give an indication of quality of the model. R-Squared can show the relation strength between the factors and the response. 25 The Value can illustrate the percentile of the variation in the response that can be explained by the variation of the input variables. ANOVA showed a value for R-Squared and Adjusted R-Squared respectively 98.63% and 94.52% for surface deformation whereas HAZ was 93.07% and 72.28%.
Three-dimensional surface plot was used to assess the effect of the two most influential parameters on the surface deformation and the heat affected zones as shown in the graphs in Figure 6 below. The surface plot for surface deformation showed that using the power at level one and cutting speed at level two can result to a maximum deformation. However, using power at level two associated with cutting speed at level one the deformation can be reduced to their lowest level. Heat affected zones surface plot showed a maximum defect when both cutting speed and pressure at level one. The minimum value can be obtained if cutting speed used at level two mainly or three using pressure at level three.

Surface plot: (a) heat affected zones and (b) surface deformation.
Regression analysis
Assumptions
Analysis of Variance results illustrated that for both heat affected zones (see Figure 7) and surface deformation (Figure 8) that residual plots for fits which is the difference between the observed and predicted values were spaced and falling randomly to the horizontal line (zero value mid-axis). 26 Percent graphs showed that the variation and the distribution of residuals was practically similar for each level.

Residuals and fits graph for HAZ.

Residuals and fits graph for surface deformation.
These two conditions were necessary to assume that there is a linear relationship between the input parameters and the response. In addition, multicolliniality between the independent variables were analysed using pearson correlation. The coefficient for each independent variable in the regression model can indicate the average change of the response when the independent variable is changed by one unit assuming the other terms remain constant. However, if multicolliniality exists then this would not be the case. 27 Matrix plot showed that all the points were falling randomly for both responses and not following any pattern, direction or neither aligned. Pearson r obtained were all equal to zero which indicated that there was no linear relationship between the independent variables. Therefore, it is possible to build a mathematical regression model which can be used to assess the relation strength between the input variables and the output response.
From the diagram Figure 9, it is noticeable that the residuals are all scattered along and close to the diagonal line which represents the ideal normal distribution. Errors are the vertical distance between the residuals and the diagonal line. Accurate regression requires that the distance of residuals (errors) to be verry small. In this case, this condition is satisfactory as the residuals are normally distributed and therefore the numerical data can be trusted. 28

Response prediction for both phenomenon: (a) surface deformation and (b) HAZ.
Mathematical modelling
The general multi-variable linear regression model can be writen as follows 28 :

y is the Observed value (response), x
1
to
The number of parameters involved in the regression are three parameters: itensity, pressure, gap, cutting speed for one response then we obtain the following equation

Where respectively X1, X2 and X3 are cutting speed, pressure and intensity.
There are nine observations collected from the experiment (n = 9), therefore:

From the equations above, the generale equation for an observation is:

We concider the variate of the estimate value yi given xi (xi = xi1, xi2, xi3) as:

Where E(yi/xi) is the linear regression estimate ŷi. 29 Therefore


y
i is the obseved value, ŷi is the predicted value and
The objective is to find a way to minimise the errors between the observed values y and the predected values of the model y1, the method that can be used to help achieving the target is the least square error approach. However, if we sum the errors we will obtain a zero value
To simplify the calculations when working with a large number of variables and equations it is convenient to convert these equations into matrices and vectors, the equation (2) above can be written as:

(n × 1) (n) × (k + 1) (k + 1) × 1 (n × 1)
Where n is the number of observation (in our case n = 9) and k is the number of parameters (k = 3)
We consider that:

Then:

The equation above is the multi-linear regression model (MLR), the objective is to estimate the model parameters of the vector B = (b0, b1, b2, b3)T which minimise the errors to allow the model to be closer to the ideal (theoritical) line as close as possible.
The equation of the sum squared errors:

where E is the error victor with (n × 1) dimention and ET is its transpose with (1 × n) dimention

Starting from the equation (4)

We have


Using the properties of matrices, vectors and scalars, it is possible to use in the equation (5) obtained above and change the terms YTXB with BTXTY as the product result is 1 × 1 dimention scalar and its transpose remain the same 30 (knowing that (XB)T = BTXT and (YT)T = Y). 31 Therfore, BTXTY can be written as (XB)TY which is equal to [YT(XB)]T, the result of this product is a (1 × 1) dimention scalar (dimentions product of (1 × n) × (n × (k + 1)) × ((k + 1) × 1) will result to (1 × 1) dimention scalar) and by definition its transpose will be the same.
We obtain then the following result:
We write

To minimise the sum squared errors we need to find the derivative of SSE with respect to B set to zero


Where

Using the data collected from the experiment we can estimate B1, we have:
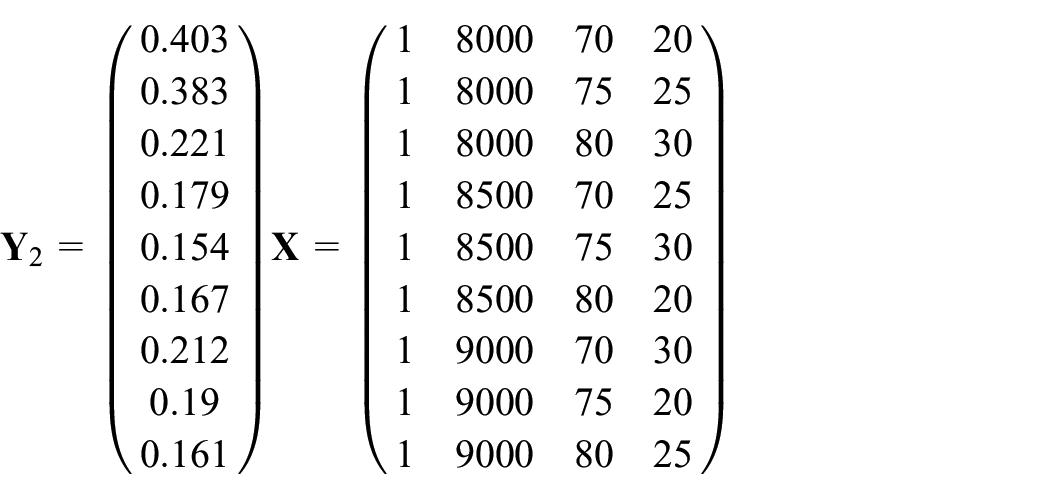
Table 9 above is the summary of the plasma input variables and the output measured for both deformation and heat affected zones. This data were used for numerical applications and assign values to variables Xi and Yi in the matrix and vector obtained in matrices (2) and resolve the equation (6), starting first with top sheet deformation Y1. We obtain:

Data parameters and observations.

(9 × 1) (9 × 4) (4 × 1) (9 × 1)
We use the equation (6) to estimate the coefficients of vector B1:

(4 × 9) × (9 × 4)

(4
The inverse of a square matrix (4 × 4) can be calculated using the following formula(37)

The matrix inverse exists only if it meets the condition of determinant
det |XTX| = 303,750,000,000 which is ≠0 (calculator was used to compute)
The convenient way to calculate the inverse when we have a large matrix with n columns and n rows usually larger than (2 × 2) is to transform


The process of conversion was very long therefore a calculator was used to obtain the following result.

Therefore, the matrix inverse is:

(4 × 4)
The following step was to calculate the product matrix below:

(4 × 9) × (9 × 1) → (4 × 1)


(4 × 4) × (4 × 1) = (4 × 1)

Therefore, we obtain the coeffeients

Using these coefficients in the multi-linear regression of the equation (1) We obtain:
Same than
Therefore:
To obtain the multi-linear regression model for the heat affected zones:

(XTX)−1 was calculated previously. Therfore:


Replacing the coefficients in the equation (1) we obtain:
Therefore:
• In order to find out if regression models can estimate the response at an acceptable level, it is recommended to verify the R-Squared predictor, known as the coefficient of determination that can assess the quality of the model, the value can indicate the strength of the relationship between the factors and the response. 25 R2 is ranging between 0 ≤ R2 ≤ 1 (or 100%), when R2 equal to zero it means the model is poorly fit whereas R2 = 1 represents the ideal model fit or meaning that residuals are scattered along the regression line without errors. 38 R2 can give an indication of the percentage of variability in response Y that can be explained by the variability of the parameters used. The rest of the proportion (1 − R2) remain unexplained (unknown) due to the errors, meaning that the rest of the proportion (1 − R2) does not represent the inadequacy of the model. An important point to emphasise was the high or low value of R2 generally can give an indication of the model strength but it has been proven that R2 can be misleading in some cases, meaning that we could get a poor R2 for a good model and vice versa. 39 In certain cases, a low R-Squared can also meet the requirement of the model built, it does not mean necessarily that the model is poor. The convenient way was to use the prediction interval to satisfy the requirements. 40
The equation is given below:


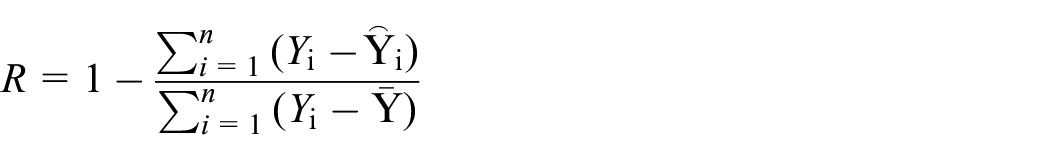
Ŷi: Predicted value.
Yi: Observed value.
n: Number of observed values.
SSE: Sum squared errors.
SST: Sum squared total error.
The values were computed and taken from the regression analysis in Minitab, for surface deformation R2 of the regression is 50.60 %, this means that just above the half of the variation in the deformation can be explained by the model constructed, whereas 65.77% of the variation in the heat affected zones can be explained with the model constructed.
Validation tests
Additional tests were performed to validate the results obtained. Initially, two trials were made at optimum parameters to check the level of improvement reached. Second set of trials were made, and the parameters were chosen randomly (see Table 11). Test results were compared against the predicted responses calculated. Six samples were assessed to validate the regression models for each phenomenon, the specimens collected from validation tests were processed and assessed the same manner than previous tests. Large sheet of 0.6 mm thick was used for the optimisation tests, two rectangle sheets 150 × 40 mm were cut using the optimal setting shown in the Table 10 below, then an additional six tests as shown in the Table 11, the samples were scanned using a atos triplescan for the deformation analysis, then a small section was taken from each sample to assess the heat affected zones, the samples were mounted, polished, chemically itched and analysed using a microscope, the results are shown below.
Optimal parameters confirmation tests, the values measured are given in the Table 10.
Optimal parameters tests.

Predicted tests analysis.
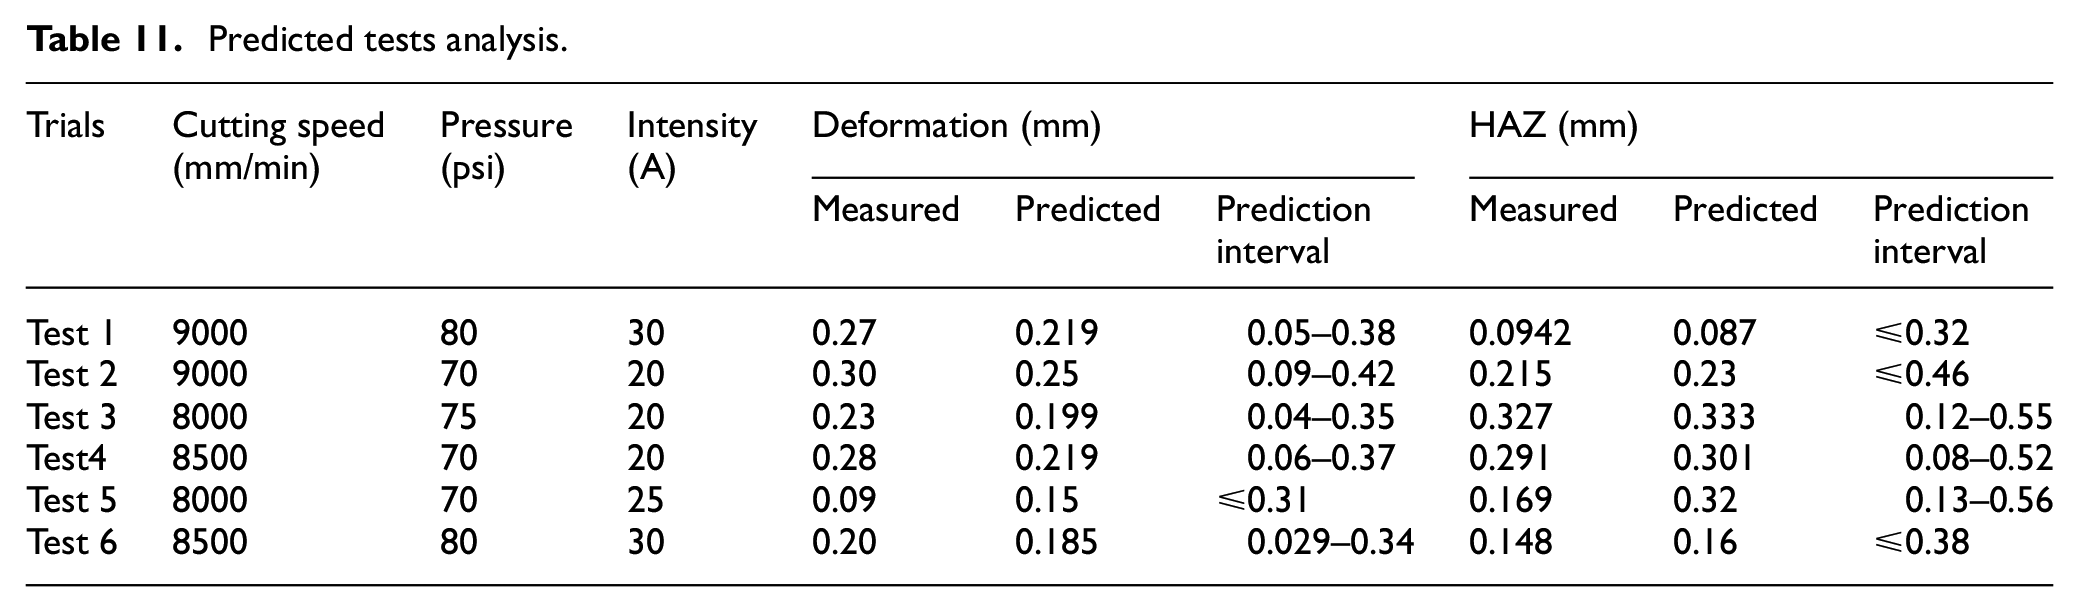
The optimal parameters in Table 10 showed a slight improvement for both responses. The heat affected zones alteration was reduced from 0.154 to 0.148 mm whereas the deformation was reduced from 0.12 to 0.09 mm. This showed that Taguchi can be an efficient method to improve the quality.
Prediction models validation tests, we obtained the results below:
The Table 11 showed that all predicted values were close to the measured results obtained from validation and none of the values were falling outside the predicted interval. This indicated a good fit of the model constructed and the models can be trusted. Therefore, there is a strong relationship between the input variables and the output. The tests
Chassis cut and applications
The tests were made on scrapped chassis part (Allied Vehicles Partner Car) as shown in the Figure 10. The material contained sealant underneath some sheet’s zones. The results showed that the cutting process was reflected dramatically by the sealant as excess fume and fire was generated. Therefore, a quick removal of the sealant using a sand belt tool was required (only on the plasma pathway).
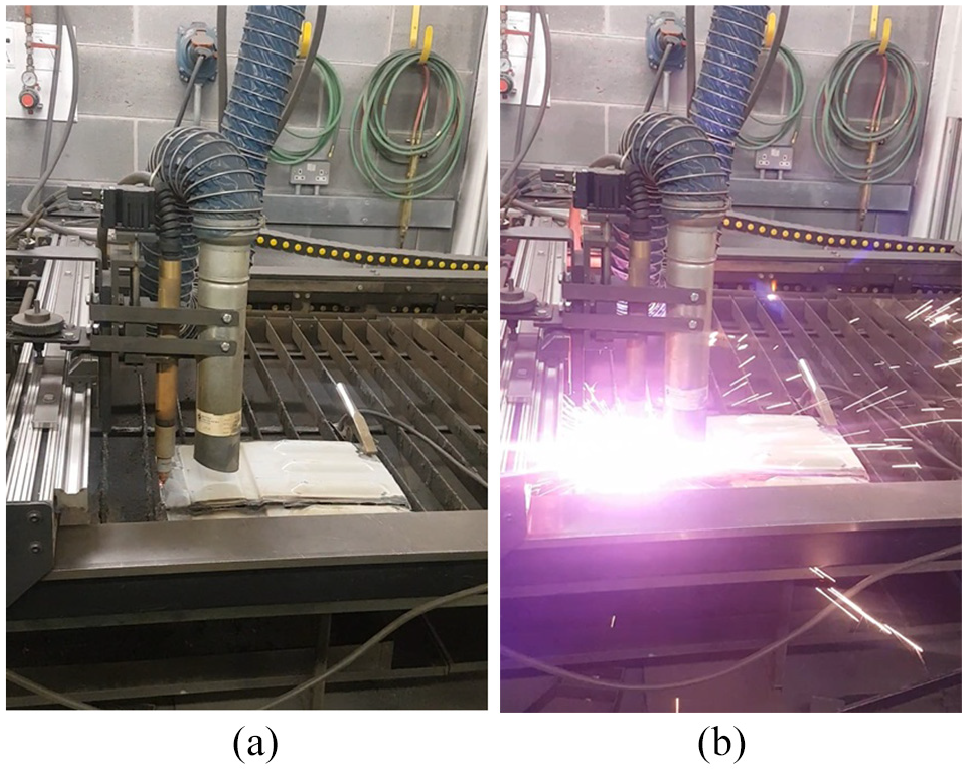
CNC plasma test on a vehicle chassis floor.
The tests showed that leaving the sealant material underneath the chassis might result to a deterioration of the quality cut. However, after removing the sealant from the plasma path the quality resulted to a better finish, matching but not identical to the ones obtained from the experiments performed on clean sheets. Even though the quality was good, but the test showed that the paint also has a slight effect on the cut, as shown in the Figure 11.

Different cuts results with and without sealant underneath the sheet.
The Figure 12 illustrates the difference when the plasma torch travels through a material containing sealant underneath the sheets and the zone without a sealant. The mid zone (with no sealant) of the cut showed a better quality compared to the outer zones of the cut edge.

Cutting quality (with and without sealant).
The Figure 13 can show that after removing the sealant using a sand belt, the quality improved greatly, we resulted to a good quality and no second processing is required. The quality was very close to the results obtained with no coating material.

Quality obtained after sealant removed using sand belt.
To perform the entire cut out on the vehicle floor effectively, it was necessary to follow some steps, a bespoke automated machinery or a robotic arm was required to control the speed, path, movement of the tool in three-dimensional space and also other parameters.
Plasma cutting process automation
Robotic arm was found to be a better option to automate the process due to their popularity and wide spread in the automotive industry for tasks such as cutting, trimming or welding, 41 especially when cutting in three-dimensional space is required. Six axis robotic arm was taking the lead as they can be operated with a simple programmes and can work at full time. 42
In this study, the reach required for the task was approximatively 3 m long, this would allow to perform sectioning on AV chassis floor in all vehicle models and also to discard the scrapped parts. The largest vans floor measured was approximatively 2500 mm long and 850 mm wide. The plasma arm robot usually (depending on the companies requirements) needs to possess a good isolation from high frequencies current, isolation shield from dust, dross and sparks, integrated with torch height control (voltage sensing height control mounted on the torch with constant feedback), a vision system was required to recognise the parts/vehicle models in less than 0.1 s, 43 this offered a fast and a better flexibility than sensing prob, magnetic gripper, tool changer mounted at the end of the arm robot this will allow to switch between the gripper and the torch at the end of each the task as required. Tool holder was also required, this needs to be integrated as part of the robot path cycle when switching from gripper and torch, fume extractor to reduce smoke, a safety cage. 44 Fire detector and control system must be implemented.
One of the well-known and most implemented robotic arms in the automotive industry is Fanuc. The selected model (according to the company’s needs) to perform the floor chassis cut is Fanuc R-2000IB 125L R-30IA 6 axis, the reach was just above 3 m, this will cover all the vehicles brands, the loads was 125 kg. The model is well known also for plasma cutting. 45
Cutting method
The process of the cutting required the tool to follow a specific path, the Figure 14 46 below shows one of the vehicles used for conversion and the cut-out profile (Ford Van Short Base). The robotic arm can use a vision system to identify the vehicle and pathway required for the cut. The efficient way for a full floor cut-out required first to perform a few cuts on the rails underneath the vehicles as highlighted with a yellow in Figure 15 below, the arm required to start from position one and then cut all the rails one after one flowing the profile highlighted with black colour until reaching position two then finishing the rest of the cut on the top of the floor following the path shown in the Figure 14 below. Alternative pathways and techniques can be generated for each vehicle model. We are assuming in this case a chassis with two layers structure. Gripper can be used to remove sheets or scrapped parts.

Position one, cutting profile.

Underneath the vehicle cut profile.
The estimated cut can be made and computed by taking the total size periphery of the profile path on the top side vehicle which is length 1900 mm (×2) adding the width 800 mm making the total 4600 mm, the rear side plus the underneath total periphery distance for all rails including first box section which was larger than the rest 4000 mm, adding also the torch displacement between rails approximatively the same distance than the top side 4600 mm, the speed of the robotic arm which would be programmed for around 8000 mm/min. The estimation of the cutting time can be approximatively 2 min which is a reduction of just above 40 min compared to mechanical cutting methods.
The tests on a real chassis showed an effective cutting using plasma technique. Cutting through coated sheets showed very little reduction in quality. A good electric contact between the work piece and the plasma is required or a special torch design might be used. Sealant on the chassis reflected on the quality cut. Therefore, it necessary to remove the material which is located under the chassis on the plasma pathway to obtain a good quality cut. To speed up the cutting process it is recommended to program the arm robot to follow a special path. Plasma technology can reduce the processing time to approximatively 40 min compared to circular saw, this requires the use of a proper robotic arm and an adequate methodology of cut. This new method can guarantee a constant cutting time whereas in the other hand the operators failed to keep a constant timing for processing a similar vehicle brand each time, the values fluctuated (average 45 min for cutting, timed using a stopwatch during the conversion process).
Discussion and Conclusion
This research was carried out mainly for a medium size automotive industry which converts vehicles to make them accessible to wheelchair users. The biggest challenge encountered during the conversion process was in the cutting stage due to complexity of the task when manual tools are used for example, circular, or reciprocating saws, it was necessary to find an alternative cutting tool to mechanical shearing methods used at the company to process the chassis underbody floor and overcome those challenges, mainly profiling and time consuming. The suitable technique that can be used as an alternative to mechanical cutting was found to be plasma technology due to their advantages over the remaining techniques. This method if well automated can be an efficient way to cut complex shapes and three-dimensional structures, therefore it can be employed for underbody chassis vehicle sectioning.
The research questions addressed in this study was whether the heat generated from plasma cutting would alter the surface in thin materials under 1 mm primarily for thickness of 0.6 mm and how the process can be optimised and reduce the phenomenon to their lowest value.
Cutting single thin sheets DC01 grade material at 0.6 mm thick using a plasma resulted to good quality without altering the surface. This contradicted the research performed in the past claiming that plasma was not suitable for this range of thicknesses. 4 Tests showed that plasma cutter can result to a deformation as low as 0.12 mm, the maximum value obtained in all samples observed was 0.3 mm, even though the defect was measured however this was not visible. The parameters that affected mostly deformation were intensity followed by cutting speed successively 51.71% and 42.47%, both effects were statistically significant. The 3D surface plot showed that to achieve an effective cut and keep the deformation down it is recommended to avoid using high or low intensity associated with fast cutting speed, meaning that if we set a moderate or elevated feed rate and employ whether low or high power then this would result to a higher degree of surface deformation. Therefore, it was important to use the right settings. Taguchi methods showed that an optimal cutting parameter can be identified and reduce the defect to their lower levels, it was found that the best parameters that can result to an optimal cut were cutting speed 8000 mm/min, pressure 70 psi and 25 A. The optimal settings were tested and resulted to a small improvement of 0.09 mm deformation, which was 0.03 mm less than the lowest value measured before.
The heat affected zones values measured for 0.6 mm single sheet were varied from 0.154 to 0.403 mm, the quality obtained was acceptable, the maximum size was less than half millimetre, there was no second processing required. The parameter which affected mostly the sheets was cutting speed with more than 70%. The results showed that the effect was statistically significant. The other parameters did not exhibit a big impact. The surface plot suggested that to reduce the heat affected zones it was necessary to avoid using low speed especially when associated with weak pressure, this might expose the material to longer period of heat. Optimal input variables were obtained using Taguchi method at cutting speed 8500 mm/min, pressure 80 psi and intensity 30 A. The settings showed an improvement on the quality result, the heat affected zones size was reduced from 0.154 to 0.148 mm. The dross was very small in size and not noticeable, a very narrow kerf was obtained.
To assess the relationship strength between the input variables effects and the response, two mathematical models (multivariable linear regression) were constructed for both phenomenon deformation and the heat affected zones. The method used to construct the equations was least square errors approach. The validation results showed a close values between the estimated and the measured ones and none of them were outside the interval of prediction. Therefore, we can conclude that there is strong relationship between the input variables and output and the models can be trusted to predict new values.
A final test was performed on a real chassis to demonstrate the suitability and practicability of the findings of this study. The test results on a chassis showed that it was necessary to remove any sealing (if applicable, depends on the vehicle’s brand and zones) that was under the sheets as this might result to a degradation of quality cut, risk of fire and smoke generation. The removal was required only on the plasma pathway. This confirmed also the claim of some articles which emphasised the necessity to verify the parts processed before proceeding to any type of cutting in order to avoid fire generation. 47 The results showed a considerable deference in quality before and after removing the sealant material. The paint did not show a big impact and reduction on the quality cut (only in low scale and hardly noticeable) apart a black tint accumulated at the cut edge caused by the fume, this matched the findings of previous article. 48 A good electric connection between work piece and the electrode was necessary especially at the start for the first spark (piercing) or alternatively other plasma model can be used, 49 these were referred to non-direct arc transfer plasma cutting. 50
The literature review showed that practically the same cutting method was employed to process the chassis (mechanical tools) in most companies that converted cars to wheelchair accessible vehicles. 47 Tests demonstrated that plasma cutting can be a good and fast alternative solution. The technique showed a better ability compared to circular saw for example, profiling or cutting sharp corners where mechanical tool clearly showed limitations processing the chassis effectively. Tests showed that plasma can process and cut parts at higher speed rate, meaning that the cycle time for processing the full chassis cut out can be reduced to approximately 2 min, this is a reduction of more than 40 min. Furthermore, plasma technique can be mechanised. Hence, the operating cost can be eliminated. To sum up, Plasma cutter can be shaped and structured to satisfy the company’s needs. However, it was required first to understand properly the challenges and what we trying to achieve, the nature of material, structure of the parts, then we can customise, readjust and build the cutting tool needed to meet the industry demands.
Limitation and future work
There are few works that could be done to add to this present paper. The experiments performed were made using a basic air plasma considering the economical aspect of the project. Therefore, repeating the same tests using a more advanced plasma such as high density would be beneficial especially if compared with laser in quality wise and productivity. Simulation models can be built to predict the outcome for different thicknesses and zones in the chassis. Certainly, a better results can be achieved using a robotic arm as this can move freely in three dimensional space, also an exact timing of the cutting process using the arm could be done.
Footnotes
Acknowledgements
I express my gratitude to Strathclyde University, Advanced Forming Research Centre, Kelvin College and Clyde College Glasgow, Allied vehicles and everyone who supported this work.
Handling Editor: James Baldwin
Declaration of conflicting interests
The author(s) declared no potential conflicts of interest with respect to the research, authorship, and/or publication of this article.
Funding
The author(s) received no financial support for the research, authorship, and/or publication of this article.
Availability of data and material
All data are available in this paper.
Code availability
Minitab Software 19 Student version, Gom Inspect 19.