
Abstract
An imperative requirement of a modern machining system is to detect tool wear while machining to maintain the surface quality of the product. Vibration signatures emanating during machining with a single point cutting tool have proven to be good indicators for the tool’s health. The current research undertaken utilizes vibration signatures while turning EN9 and EN24 steel alloy to predict tool life using Artificial Neural Network (ANN). During initial meager experimentation, tool acceleration during machining was recorded, and the width of the flank wear at the end of each run was measured using Tool Makers Microscope. The recorded experimental data is utilized to develop the neural network with the variation of operating parameters and corresponding tool vibration with measured tool flank wear. The endeavor undertaken for the development of ANN flank wear prediction model was effective with a regression coefficient of 0.9964. The proposed methodology of indirect measurement of tool wear is efficient, economical for the machining industry to predict tool life, which in turn avoids catastrophic tool failure.
Introduction
The requirement of modern-day unmanned and automated machining centers that operate on high speed and power needs to detect the condition of the tool automatically before it fails catastrophically or causes production losses due to poor surface quality. The necessity to anticipate the tool health has elicited the scientist and production engineers to ponder new indirect methods of measuring the tool wear.
The contact between the surface being machined, and the tool inherits the unavoidable and unprecedented phenomenon known as tool wear. Excessive tool wear is unwanted as it induces poor surface finish, alters the dimensions of the machined part, and increases production cost. 1 Tool failure is ascribed to cause nearly 20% of the breakdown in machining, 2 and 3%–12% of total production costs are incurred by the cost of tools. 3 Traditionally, replacement of tool is based on the machinist decision, and modern-day unmanned machining centers necessitate a decision support system for replacement of the tool. The decision support system is based on indirect measurement of tool wear based on vibration, acoustic emission and tool force. Due to wear, the tool’s exact replacement is a subject of interest for the machining industry and continual studies in the scientific community.
Many researchers studied tool Condition Monitoring (TCM) in turning operation. Efficient mathematical models were developed to estimate tool wear based on the variation of speed, 4 force signals, 5 sound amplitude, 6 wear coefficient-rate of rise of load-index of diffusion, 7 vibration-cutting forces-acoustic emission, 8 mean power of vibration signatures, 9 chatter vibration, 10 image segmentation and texture 11 and acoustic energy.12,13 Feed rate is a dominant factor in contributing surface roughness of workpiece, whereas speed and depth of cut are dominant factors in influencing tool wear.14,15 Extensive research is carried out on wear mechanism of abrasive jet machining.16–21 Surface integrity prediction and measurement of machined surface are time-consuming and are rarely applied on the shop floor. Forecasting the above parameters under different operating conditions prior to the machining process is challenging. 12
TCM is a very tedious and complex process as it involves indirect measurement of tool wear. Tool wear is influenced by several factors such as temperature, force, torque, and mechanical vibration. Cutting tool monitoring is an intricate phenomenon and required a systematic and prolific approach. It requires a decisive support system to predict the tool’s condition and decide the exact replacement time. Hence, an Artificial Neural Network (ANN) approach is suggested by several researchers as one of the unique approaches that have been explored and advocated to predict and automate TCM system in turning operations.
Neural network utilization for prediction of tool wear has been probed by many researchers. A back-propagation neural network model, 22 predict failure mode and tool life with varying speed and depth of cut while machining gray cast iron was built. The prediction of failure mode and tool life using the developed model was 87.5% and 58.3% accurate. ANN models developed to predict tool wear was accurate with an error of less than 10%.23–26 ANN model for the prediction of tool wear using tool vibration and cutting forces while machining EN24 alloy 27 was accurate, but accuracy decreased when cutting conditions were altered. The adoption of the design of the experiment (DOE) to build ANN model for predicting flank wear in machining EN 24 was utilized, 28 and the model prediction was accurate within the trained range. The particle swarm optimization technique was superior to the ANN model in reducing computational time with prediction accuracy in acceptable limit. 29 ANN model of hard turning was robust, faster, and accurate. 30 Tool wear prediction model in milling operation was developed using cutting force, vibration, and acoustic emission. 31 ANN multilayered feed-forward network to forecast surface roughness and tool wear was established.32,33
The adaptive neuro-fuzzy inference system (ANFIS) system for TCM using a strain gauge sensor was built, 34 and the model was found to be accurate. A two-step method to predict tool life using a flank wear image combined with ANN was nurtured. 35 Several researchers have pondered upon the utilization of ANN to predict tool wear.36–39 ANN models were developed to predict performance of Abrasive water jet machining parameters. 21
The motivation of the study
A literature review reveals extensive research in tool wear prediction using various techniques, especially ANN. However, meager ANN prediction models were reported exclusively utilizing vibration signatures to forecast tool wear in turning operations. Efficacy of wear prediction using ANN depends on many factors such as training algorithms, transfer functions, data presented for training, stopping criteria, and the number of neurons in the network. Each ANN model developed is unique, as its development depends on work piece-tool material combination, speed, feed, and depth of cut employed for cutting operation. This work presents a detailed methodology for the development of an ANN model based on experimentation. The inquest’s objective is to find suitability and efficacy of neural network technique for the tool-material combination under given operating conditions built on vibration signals for the prediction of tool life and its replacement time.
Materials and methods
Tool wear measurements were carried on the workpiece material chosen, EN9 and EN24. EN9 finds its applications in the manufacturing of crankshafts, lead screws, gears, worms, spindles, shafts, machine parts, axles, mandrels, tool shanks, and heat-treated machine parts. It can be said that EN9 is day-to-day steel with tremendous demand in the market. Whereas, the critical applications of EN24 include highly stressed components of the large cross-section for aircraft, automotive and general engineering application such as propeller shafts, connecting rods, gear shafts, crankshafts and landing gear components, heavy forgings, such as rotor shafts and discs.
The applications mentioned for materials mandates severe operating conditions in terms of rotating speeds, loading, fatigue, tensile-compressive-shear stresses, etc. The research delves to study the effect of machinability for EN9 and EN24 on the tool life by vibration condition monitoring using ANN.
IRD model 970 accelerometer is utilized to measure acceleration; IRD model 970 has in-built electronics provide low impedance output and eliminate the need for special low noise cables. IRD model 880 spectrum analyzer was used to analyze the accelerometer output, both frequency spectrum and amplitude versus time plots can be obtained from the instrument.
A single-stage neural network model is developed with inputs as specimen material, tool inserts, feed rate, depth of cut, cutting speed, number of cuts, cumulative time and vibration amplitude, whereas the network’s output as tool wear. The experimental data obtained is utilized for training the ANN model developed, and the trained model is used to predict online cutting tool wear progression.
Experimentation
The natural frequency of the tool holder is evaluated theoretically and experimentally and found to be 45 kHz. The cutting tools used were coated and uncoated carbide inserts, and the specimen materials are EN9 and EN24.
Experimental procedure
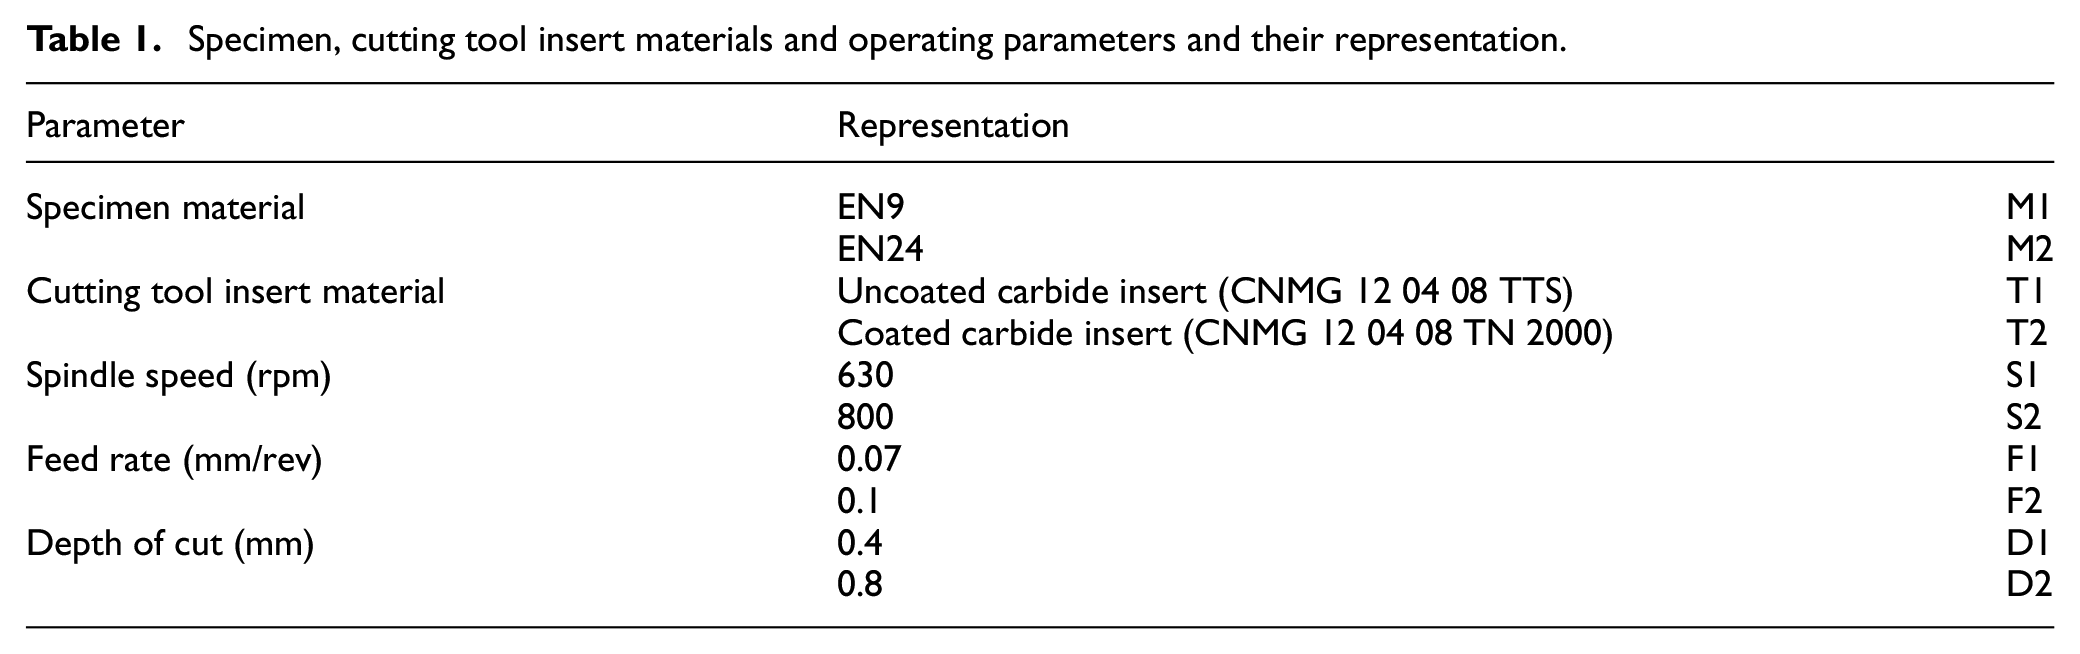
The experimental parameters chosen are tabulated in Table 1; specimen samples of 100 mm diameter and 300 mm length (ISO 3685: 1993(E)) are selected for the current experimental work. Machining is done on a High-Speed Precision Lathe, Turn Master – 45 Kirloskar with 18 speeds stretching from 40 to 2000 RPM. The turning operation is undertaken with a set of speed, feed, and depth of cut on particular specimens using specific carbide tool insert. During each pass, the vibration data is recorded, frequency domain analysis was performed to obtain amplitude of vibration for various frequencies, as it is already identified the frequency range over which tool is supposed to vibrate, it is thus enough to concentrate on amplitude of vibration caused by tool. At the end of each turn, the tool wear is measured using the toolmaker’s microscope, as depicted in Figure 1. Several experimental trials or cuts were carried out for each set of speed, feed, and depth of cut combinations. The trials or cuts were carried until the tool wear reached a maximum limit of 0.6 mm (ISO 3685: 1993(E)) as imposed prior to experimentation. Nearly 18 to 20 trials are effectuated for each set of speed, feed, and depth of cut.
Specimen, cutting tool insert materials and operating parameters and their representation.

Experimental setup.
Artificial neural network model
The human brain’s inspiration in processing complex data leads to the evolution of Artificial Neural Network (ANN) to solve complex engineering problems. 40 ANN emulate the human brain and process data based on the input presented to them. 41 ANN process data fed to them with interconnected neurons, the transformation of information rest on the strength between two adjacent neurons termed as weights. Weights indicate the knowledge gained during training. Learning is obtained by the adaptation of weights relating to input-output patterns. The prodigious ability of ANN is to predict the output for an unknown input presented to the trained network. As forecasting is performed via prediction of the future from experience achieved in the past, the neural network is being used for the decision support system.
Experimental data obtained from 606 trials or cuts by varying tool material, specimen material, speed, feed, depth of cut, cumulative time, and vibration amplitude were used to develop the model to predict tool wear without actually measuring it. The predicted tool wear trend will educate about the second peak of acceleration for replacement of tool insert for the better surface finish of the finished product. A schematic illustration of feed-forward back propagation artificial neural network model architecture employed is depicted in Figure 2.
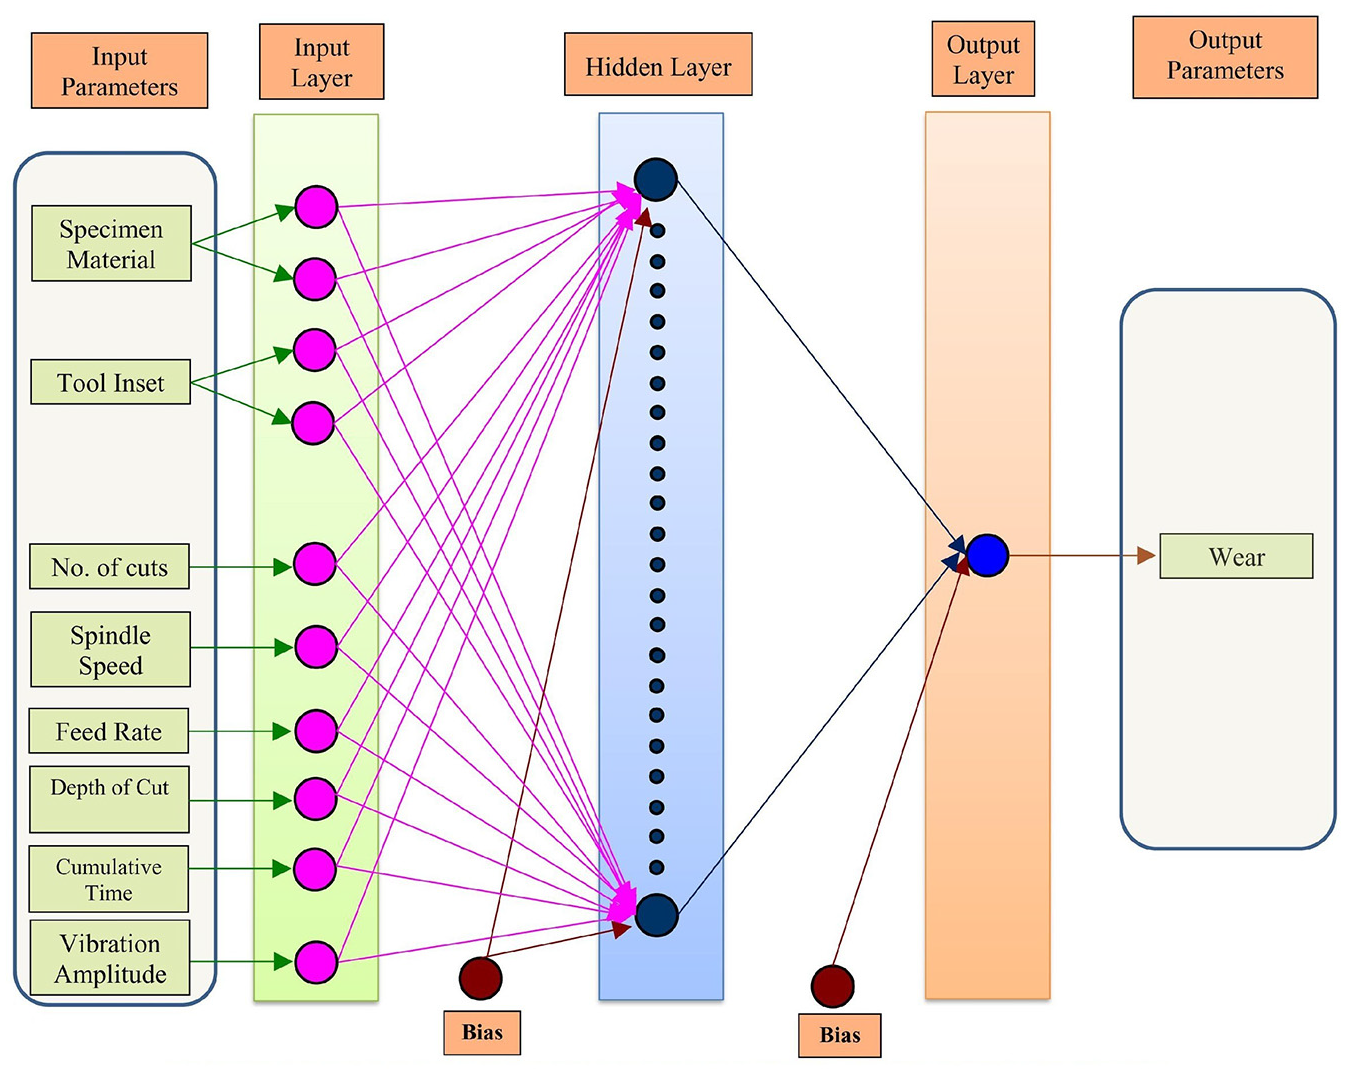
The neural network configuration of feed-forward back propagation multi-layer perceptron model.
ANN model was developed on MATLAB. The ANN model’s efficacy is determined by the input fed to the model; hence, the data was normalized between −1 to 1. 70-15-15% network architecture of training-validation-testing of input data was utilized. ANN model was studied with various training functions and training algorithms with a variation of neurons for 100 iterations, as depicted in Figure 3. At the onset of discovering the apt model, 10,000 epochs and minimum gradient of 10−7 were utilized as stopping criteria. The statistical benchmark pointers utilized for adjudicating the network are regression coefficients, Mean Squared Error, Mean Absolute Percentage Error, Nash-Sutcliffe efficiency, and Kling-Gupta efficiency and are calculated using the following expressions:


Where,
n number of trial cases
Oi output for ith trial case
Ti target for ith trial case
σ T Standard deviation of targets of ANN
σ O Standard deviation of outputs of ANN
α Relative variability ratio (σ O /σ T )
β Ratio of mean of outputs to mean of targets
γ The Pearson Product Moment correlation coefficient (Covariance/ σ T *σ O )
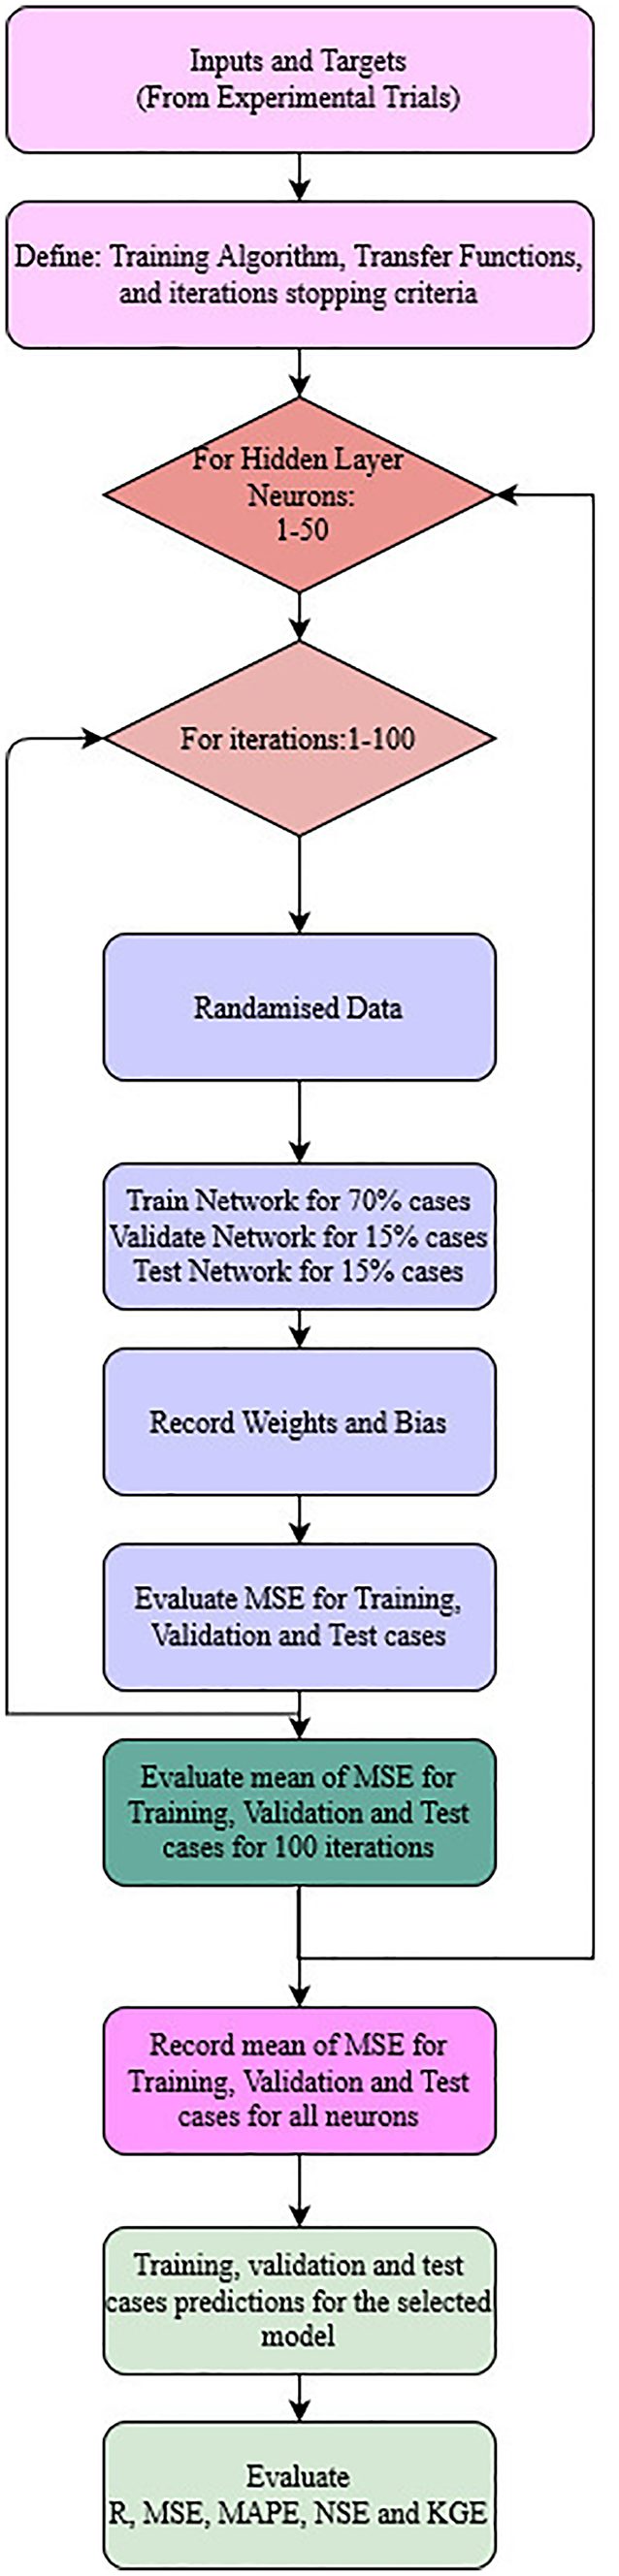
Flowchart representing proposed methodology adapted to evaluate the ANN model.
Results and discussion
During experimentation, a notable trend is observed for all the sets of trials. Two peaks of acceleration are witnessed in the life of the tool. The second peak of acceleration could be treated as a warning peak for changing the tool, as the second peak falls near and within the maximum limit set for tool wear of 0.6 mm. The tool wear’s vibration signature obtained during each cut is recorded and at the end of each cut, the tool wear is measured using toolmaker’s microscope. The tool acceleration variation is plotted with tool wear and is shown in Figure 4 for the specimen combination T1M1S1F1D1. The graph obtained has two peaks of acceleration. When a tool is new, the cutting tool and workpiece establish a point contact resulting in less friction and eventually lower vibration amplitude.

Tool wear vs tool acceleration.
Additionally, owing to the workpiece’s heaviness during the initial stage, an increase in vibration amplitude could be observed. 42 During the progression of machining the workpiece’s diameter, the mass of it decreases, and a corresponding decrease in vibration amplitude is observed. Further increase in the tool wear, that is, the tool’s flank wear, brings a little more surface to surface contact of the workpiece due to which friction increase between workpiece and the cutting tool and, therefore, the vibration acceleration amplitude increases. 34 Thereafter a second peak appears. As the tool starts reaching its wear limit that is indicative of tool failure, the vibration acceleration amplitude drastically reduces, due to the fact that the blunt tool tip is no longer able to remove workpiece material effectively.
For various operating parameters of cut-feed-speed depth, the measurement of tool vibration pertaining to second peak is recorded and tabulated in Table 2. For the specimen combination, T1M1S1F1D1 tool wear at the warning peak is 0.39 mm.
Tool wear as obtained for different combinations for the second peak of acceleration.

The data obtained in the course of experimentation is used to build the ANN model. The ANN model’s outcome, that is, predicted wear, is compared with the experimental wear to adjudge the model’s performance. In the course of training the network, various training algorithms (Scaled conjugate gradient backpropagation (trainscg), BFGS quasi-Newton backpropagation (trainbfg), Conjugate gradient backpropagation with Fletcher-Reeves updates (traincgf), Gradient descent with momentum and adaptive learning rate backpropagation (traingdx), Gradient descent with adaptive learning rate (traingda), Resilient backpropagation (trainrp) and Levenberg–Marquardt (trainlm)) and transfer functions (Hyperbolic tangent sigmoid (tansig), Linear (purelin) and Logarithmic sigmoid (logsig)) were tested. In addition, the number of neurons in the hidden layers were varied from 1 to 50. The training outcomes with seven diverse training algorithms assessed, each with five combinations of transfer functions, are tabularized in Table 3. The acumen of results obtained divulges that the Levenberg–Marquardt backpropagation training algorithm with logarithmic sigmoid and hyperbolic tangent sigmoid transfer function has the best regression, MSE, MAPE, NSE, and KGE (Figures 5(a)–5(e)).
Indices for various algorithms and transfer functions in denormalized form.


(a) Comparison of regression for various training algorithms and transfer function. (b) Comparison of MSE for various training algorithms and transfer function. (c) Comparison of MAPE for various training algorithms and transfer function. (d) Comparison of NSE for various training algorithms and transfer function. (e) Comparison of KGE for various training algorithms and transfer function.
Average of regression, KGE and NSE are plotted for various combinations of transfer functions in the Figure 6, the bar chart depicted shows that tansig-purlin transfer function combination is giving good results for all training algorithms when compared with other transfer function combinations, Shahsavari et al. 43 and Prasad et al. 44 compared training function combinations and found that tansig-purlin is the best combination. Validating the network architecture obtained with choosen tansig-purelin transfer function from the literature.43,44

Comparison of average of indices for various training algorithms with transfer function.
The optimal number of neurons for the apt model is 15. The predicted wear in terms of inputs is presented in equation 6. The transfer functions tansig-purelin excels compared to other transfer functions, and the second best is tansig-tansig. 45

Where,


where i = 1 to 15
A sample calculation for predicted wear is as follows:
In case of inputs x1 = 1, x2 = −1, x3 = −1, x4 = 1, x5 = −1, x6 = 1, x7 = 1, x8 = −0.4884, x9 = −0.647, x10 = −0.4439
Then
Z 1 = −6.1211, Z2 = 3.9334, Z3 = −18.9339, Z4 = −0.3914, Z5 = 3.9124, Z6 = 3.0038, Z7 = 1.3752, Z8 = −2.7435, Z9 = 0.7855, Z10 = 2.6590, Z11 = −1.8188, Z12 = −2.3907, Z13 = −4.0000, Z14 = −8.5537, Z15 = −7.9179
And
F 1 = −1, F2 = 0.9810, F3 = −1, F4 = 0.7535, F5 = 1, F6 = 0.9916, F7 = 0.9677, F8 = −0.9972, F9 = −0.4486, F10 = 1, F11 = 0.9892, F12 = −0.9964, F13 = −1, F14 = −1, F15 = −1
Predicted wear for the sample calculation in normalized form turns out to be −0.1632 (0.2903 mm in the denormalized form), which is closely matching the experimental wear of 0.2900 mm. The values of the regression coefficient of the best training algorithm of Levenberg–Marquardt and the transfer function of logarithmic sigmoid and hyperbolic tangent sigmoid are depicted in Figure 6. Table 4 presents similar studies carried on tool wear which suggest that the model predictions with less than 10% error are acceptable.


Summary of few literature studies.

To validate the prediction of the neural network, ANN predictions of tool wear for 15% test cases (91 cases) that are not used during the network training are used, as depicted in Figure 7 (in actual units). The predicted values of the ANN model closely match the experimental values. For test cases, the ANN regression coefficient, MSE, MAPE, NSE and KGE are 0.9964, 0.0002, 3.9330, 0.9927, and 0.9912, respectively.

Regression plot for wear.
Figures 8 and 9 depict the mean and Standard Deviation (SD) of MSE for training, testing, and validation with varying number of neurons. For each neuron, 100 iterations were carried out, and mean of MSE and SD for training, testing, and validation are plotted. The trend shows a lower MSE and SD for training compared to testing and validation. 46 The number of neurons for the apt model is 15. Figures 10 and 11 depict the mean and SD of MAPE for training, testing, and validation. Figures 8 to 11 justifies the number of neurons within the range of 0–15; after the neuron number 16 the MSE, SD, and MAPE of validation increases beyond the value of testing, and hence the model efficacy of prediction drops.
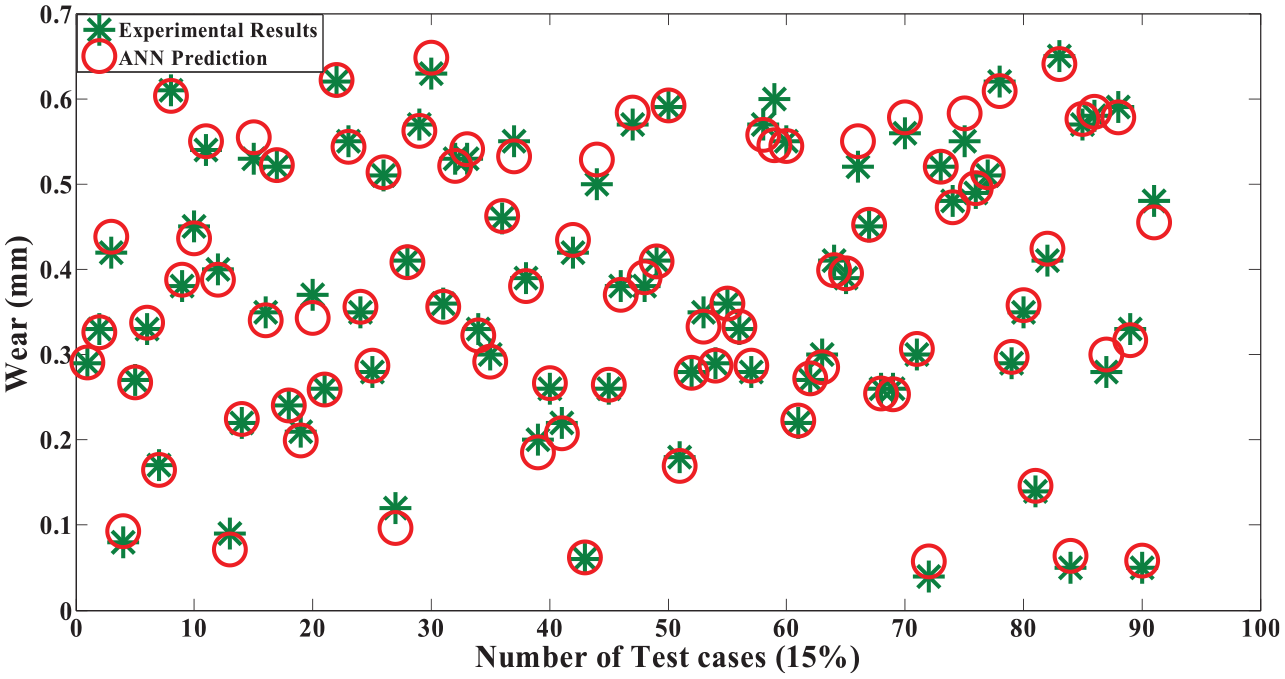
Experimental and ANN predicted wear (mm) for 91 test cases (15%).

Variation of mean of MSE with number of neurons.

Variation of SD of MSE with number of neurons.

Variation of mean of MAPE with number of neurons.
Conclusion
The estimation of tool replacement time in improving the quality of the product being machined involves cumbersome experimentation and economically not viable. When a tool is new, the cutting tool and workpiece establish a point contact resulting in less friction and eventually lower vibration amplitude, see Figure 12 for Variation of SD of MAPE with number of neurons

Variation of SD of MAPE with number of neurons.
The suggested novel methodology is to employ ANN to predict the tool wear. Initial experimentation was carried out, and the outcome of experimentation was utilized to develop the ANN model to predict tool wear. Levenberg–Marquardt model with hyperbolic tangent sigmoid and Logarithmic sigmoid transfer function for 15 neurons has the best regression of 0.9964, MAPE of 3.9330, MSE of 0.0002, and training time of 5.9200 s. The prediction of ANN is closely abutted with the experimental values. The proposed approach of using ANN for predicting tool wear is efficient and economical, which curtails the time-consuming, costly, and strenuous experimentation. The neural network prediction model developed lays a pathway to the online prediction of tool wear progression in the machining industry.
Optimization of weights and bias obtained through the ANN model could be carried out using Genetic Algorithm and deep learning technique.
Footnotes
Handling editor: James Baldwin
Declaration of conflicting interests
The author(s) declared no potential conflicts of interest with respect to the research, authorship, and/or publication of this article.
Funding
The author(s) disclosed receipt of the following financial support for the research, authorship, and/or publication of this article: The authors extend their appreciation to the Deanship of Scientific Research at King Khalid University for funding this work through research groups program under grant number GRP-246-41.