
Abstract
Multi-pin joints are commonly used in engineering due to their high loading capacity. However, affected by coupling relationships between pin load and bypass load, the evaluation of stress state is difficult for composite multi-pin joints. An analytical method is proposed in this paper to calculate stress distribution of these joints under tensile load. Stress functions in this method are created considering the pin load and bypass load, according to a geometry division of the whole plate. Superposition relationships are built for each section type with an influence coefficient of bypass load. Stress components could be obtained by calculation of stress functions when material properties, geometry dimension and load are known. Experiments and finite element method are employed to verify the validation of proposed method. Results show that pin position affects stress state, and mainly embodies in σx. The first pin always gets the highest stress level, while for the other pins the stress is quite similar. Increase pin number will decrease stress level but the effect is relatively small for the first pin.
Introduction
Mechanical joints are commonly used in structures due to disassembly and relatively high loading capacity.1–3 Most of the joints in these structures are multi-fastener joints in order to enhance carrying limit. However, mechanical joints require drilling holes which leads to stress concentration and makes joints the weakest positions. For multi-fastener joints the situation becomes even more complicated as there are several holes, which brings difficulties for design. As stress state is an important element in design of structures, it is necessary to develop methods to estimate the stress distribution of multi-fastener joints.
Stress state depends on load condition and material properties. Multi-fastener joints always exhibit uneven load distribution, and due to the coupling relationships between pin load and bypass load, the stress distribution is intricate. For composite joints, stress distribution is even more complex as the result of anisotropic properties. Therefore, evaluation of stress state around composite multi-fastener joints is quite difficult.
Load distribution has always been a research focus of mechanical joints. McCarthy 4 conducted experiments to study the effects of clearance on loading behaviors, including load distribution, quasi-static and fatigue behaviors, of single lap multi-bolted composite joints. In another paper, McCarthy et al. 5 employed spring-mass model to analyze the load distribution involving clearance. The model simplified plates and fasteners as springs and mass points. By building displacement equations, load transferred by fasteners could be easily obtained. Due to the accuracy and convenience, the model has been frequently used in analysis. McCarthy and Gray 6 further considered static friction effects between laminates, and extended spring-mass model to high bolt torque cases. Hole-location errors were considered in the work of Lecomte et al. 7 Nonlinear behaviors caused by bearing degradation were also included in modeling. In the work of Taheri-Behrooz et al., 8 the effects of material nonlinear on load distribution were discussed in detail, and comparison between linear and nonlinear results was made. Pisano et al. 9 studied the upper and lower bounds of the peak load for multi-pin joints on composite laminates using finite element method. The method was proved useful by comparison with experiment results. Global bolted joint model was employed in the research of Gray and McCarthy 10 to study load distribution of multi-bolt composite joints. In their work, composite plates were modeled by shell element and the bolt was modeled by beam elements and contact surfaces. The work was proved to be highly efficient and accurate. Kishore et al. 11 analyzed the failure of composite joints with three and four pins using 3D finite element method. Von-Mises stress was used in damage analysis. Load to displacement curves were obtained for specimens with different geometry parameters. In the work of Liu et al., 12 load distribution of two double-lap joints with two and four bolts was obtained to decide the critical hole for prediction of failure mode and strength of joints.
Stress analysis around composite single fastener joints was also a focus of research. Both of analytical and numerical methods were employed in related works. Yavari et al. 13 developed 3D finite element models to analyze stress distribution, separation angle, maximum radial stress of single lap joints. The effects of friction and applied load level were also discussed. Egan et al. 14 evaluated stress distribution of single-lap joints with countersunk fasteners. Bolt-hole clearances, both inside and outside typical aerospace fitting tolerances, were involved in this work. Attar 15 used both of analytical and numerical methods to study the effects of geometrical parameters, including edge-to-diameter and width-to-diameter ratio, on stress distribution. Zhao et al. 16 studied the stress distribution of open hole, filled hole and pin loaded laminates under tensile load using finite element methods. The results were finally employed in concentration relief factor analysis and modified failure envelopes for strength evaluation. A compact analytical model was proposed in the work of Zhang and Ueng 17 to evaluate stress around composite pin-loaded holes based on Lekhnitskii’s theory. 18 Boundary condition was built in this work to determine unknown coefficients in stress functions. The proposed method was prove to be useful and quite convenient to use. Aluko and Whitworth 19 developed Zhang’s model to calculate stress around pin-loaded holes considering the effects of friction and more detailed expressions were obtained. Combined with damage criterion and characteristic curve theory, Zhang’s stress analysis method was further employed in damage and strength prediction in the work of Olmedo et al. 20 Wu et al. 21 used Zhang’s method in stress analysis of composite interference-fit joints. Combined effects of interference deformation and pin-load were considered in this work. Grüber et al. 22 developed analytical methods for stress concentration analysis for multilayered composite pin loaded holes. Zhou et al. 23 studied the effects of pin profiles on stress concentration of pin-loaded composite joints under tensile load. Non-circular profiles were considered in this work.
Researches about multi-fastener joints have been well conducted. These researches provide detailed explanations of load distribution. Stress distribution around single joint has also been analyzed by both finite element and analytical methods. However, stress distribution of multi fastener joints could not be directly obtained from the existing methods. The coupling relationships between pin load and bypass load, should be discussed, as the effects of bypass load on stress distribution are affected by position. As stress state is an essential element in damage and strength evaluation, researches about stress distribution on these joints are still needed especially in analytical method which is low time and cost consuming.
An analytical method for stress analysis of composite multi-pin joints is proposed in this paper. Load distribution is obtained by spring-mass model, and the plate is divided into several sections according to load condition. Stress expressions are given based on the relationships between pin load and bypass load and the effects of bypass load on different sections are considered. Stress functions used in stress expressions, corresponding to load distribution, are decided based on Lekhnitskii’s complex function theory. Stress components could be obtained from stress expressions if material properties and applied load are known. 3D finite element models are also developed for joints with two, three and four pins. Tensile experiments for single lap three pins joints are conducted to get strain values on composite plates. Results of analytical method are compared with finite element method and experiments, and then the effects of pin number on stress are discussed.
Analytical modeling
Load distribution
Stress distribution of multi-pin joints is decided by load distribution which is commonly uneven. As it is stated in McCarthy et al., 5 load distribution among pins can be obtained by spring-mass model. Then the pin load and bypass load used in stress calculation can be known. In the model, both of the pin and plate are simplified as several springs connected by mass points as Figure 1. Every mass point is under load by springs.

Schematic diagram of spring-mass model.
Load transferred by springs can be calculated by equation (1), in which x represents the displacement of mass points in X direction.

KA, KC, and KB are stiffness constants affected by geometry size and material properties, and they can be decided by equations (2) and (3). 24


p and r are the pin pitch and radius respectively. t1 and t2 are thickness of plates. E and G are elastic constants. A presents the cross-sectional area. β is a constants reflecting the relationship between bending moment and bearing stress. For the convenience of analysis, the effects of second bending on stress is ignored in this research, therefore β is set to be zero. As the elastic deformation of pins is not a main concerning factor in this research, all pins are assumed to be rigid and therefore infinite elastic properties are used in calculation.
Stress analysis
As the thickness of plates is relatively small to width and length, and deformation mainly happens in plate plane, the stress analysis could be dealt as generalized plane stress problem. According to Lekhnitskii’s theory, stress components could be expressed as equation (4).

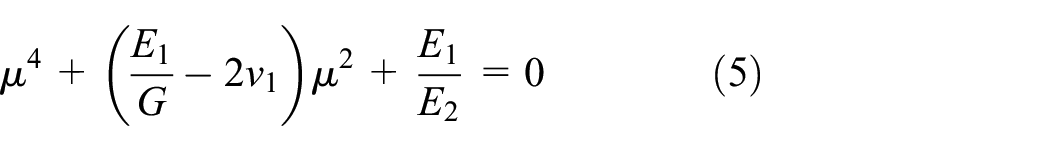
where μk (k = 1,2) are coefficients decided by characteristic equation (5). zk = x + μky (k = 1,2) are complex expressions of coordinates (x, y).
Stress functions for pin-loaded condition can be expressed as equation (6) 17 :

where U1, U2, V1, and V2 are coefficients decided by displacements and expressed as equation (7), in which c = −(10(k−v12+ηk+2η)−11η(1−k))/(10(k−v12+ηk+2η)-η(1−k)), k = (E1/E2)1/2, η = [2(k-v12)+E1/G12]1/2.

ζk (k = 1,2) are coefficients decided by conformal mapping.

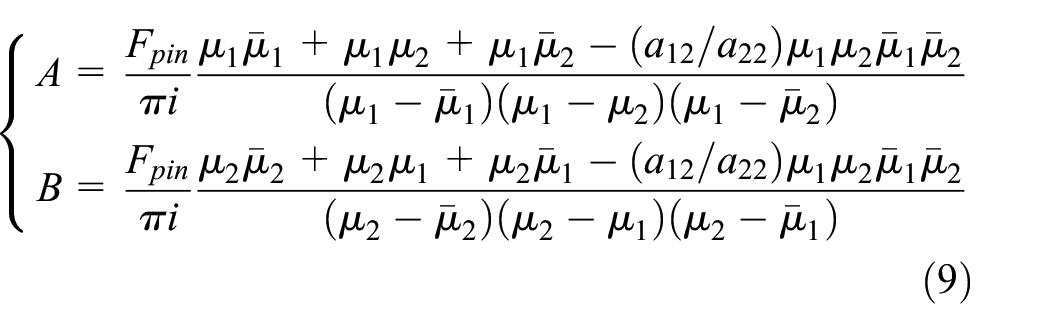
A and B in equation (6) are variations decided by the load condition and material properties as equation (9).
Then the expressions of pin load stress components can be obtained by substituting equation (6) into equation (4), and load condition Fpin used in calculation is obtained from the load distribution results.
Stress functions of plates with open hole under tensile load are also given as equation (10), 18 and this condition could be used in the approximation of bypass load.

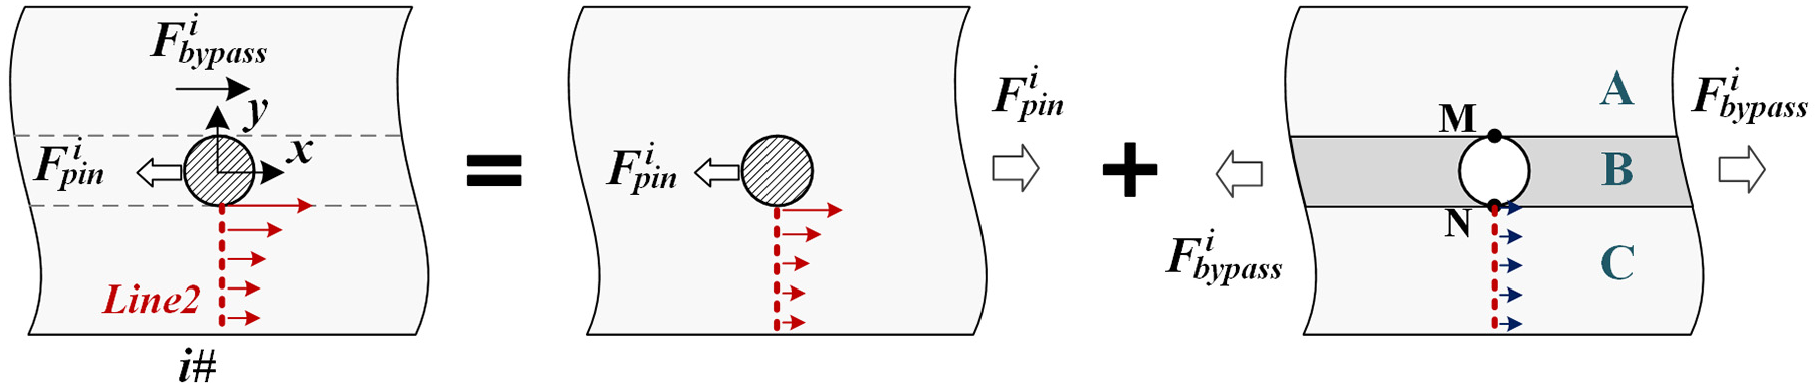
Load transfer state of the issue is shown in Figure 2. Tensile load F, which is applied at plate’s remote side, is distributed among pins. According to load state, the plate is divided into several sections, which can be classified into three types. In section 1# (the first pin), there is both pin load and bypass load. In section i# (i = 2, 3…, N−1), there is also pin load and bypass load, but deformation will be constrained by adjacent pins. In section N# (the last pin), there is only pin load.
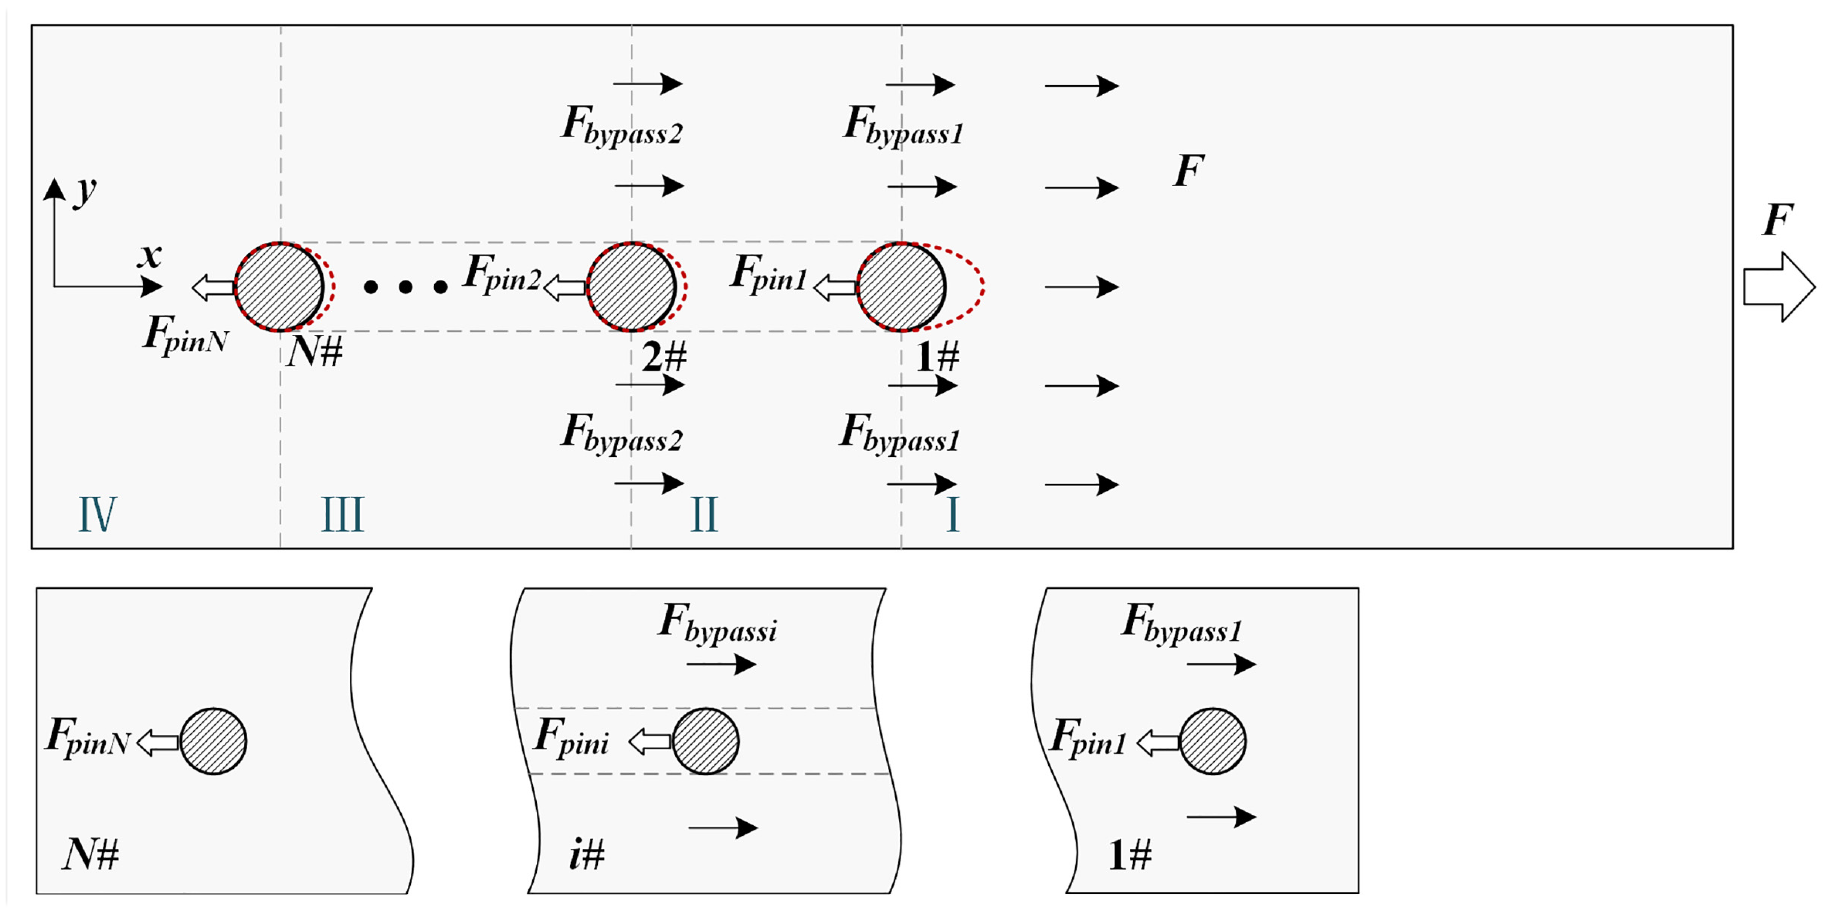
Schematic diagram of load distribution on a multi-pinned plate.
For pins in the first or last positions, the load condition can be unified as superposition of pin load Fpin and bypass load δFbypass as Figure 3. δ represents the effects of bypass load, and it equals to 1 for the first pin while 0 for the last pin. As a consequence, stress here can be expressed as a combination of pin load stress σpinload and bypass stress σbypass. The effect of bypass load is approximately dealt as open hole plates under remote tensile load. But considering the existence of pins, transverse deformation of the hole will be inconspicuous. Therefore, only normal stress in X direction caused by bypass load is used in stress superposition. The symbol p in equation (10) represents the pressure applied on the plates, so the expressions of bypass stress σ1bypass can be obtained as equation (11), where p1bypass is bypass pressure for the first pin.


Schematic diagram of load state of the first/last pin.
Although infinite plate assumption is commonly used in modeling, plate’ width (W) is used here to obtain bypass pressure from bypass load F1bypass of pin 1#.

According to the superposition assumption, the normal stress for pins in the first or last position can be obtained as equation (13).

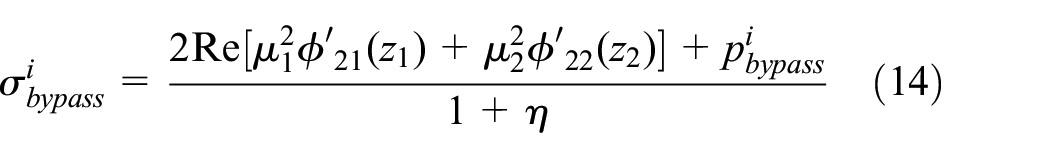
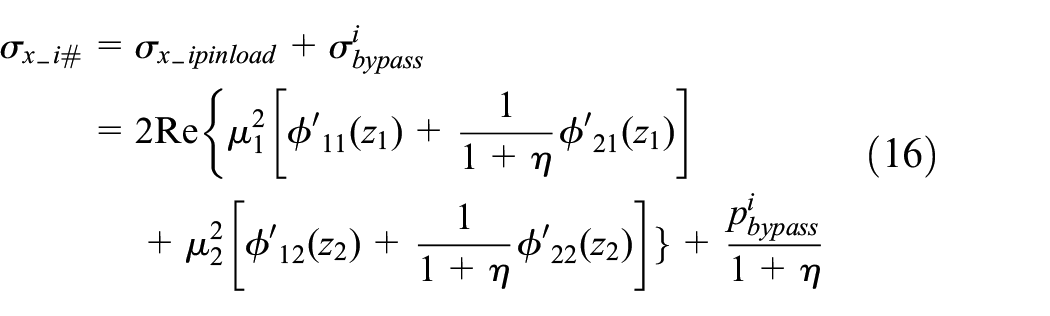
For pins in middle position of the row, which signed as i#, there is also pin load and bypass load as Figure 4. Pin load stress functions are as equation (6), except for that Fpin here equals to the load applied on middle pin F i pin . But the effect of bypass load is considered not the same as that in the first pin case. The plate zone related to bypass load is divided into three sections marked as A, B, and C. The deformation of section B is constrained by adjacent pins, and the transfer of bypass load is assumed to be not obvious in this section. Therefore, the transfer path of bypass load can be simplified as only existing in sections A and C with no stress concentration. Bypass stress σibypass in sections A and C, including points M and N, equals to bypass pressure pibypass. Along the hole edge, where no bypass pressure goes through, the distribution of σibypass is approximately dealt as that in open hole case. Multiplying by coefficient 1/(1+η), which is related to concentration factor, 18 stress at M and N will be pibypass. This coefficient could be viewed as the effect of deformation constraint by adjacent pins.
Schematic diagram of load state of the middle pin.
Stress functions ϕ21 and ϕ22 for bypass stress are given as equation (10), but bypass pressure in equations should be replaced by the pressure here as pibypass.

According to the superposition assumption, the normal stress for pins in middle position can be obtained as equation (16).
Comparing equation (16) with equation (13), the influence coefficient of bypass load should equal to 1/(1+η) for the middle pins, which reflects the stress concentration and could be decided by material properties. So δ can be defined as equation (17), in which all symbol has been explained above.

Then Stress distribution around holes of multi-pin joints in rectangular coordinate system could be obtained by equation (18), when material properties and applied load are known. Stress components in polar coordinate system could be further obtained by stress rotation formula.

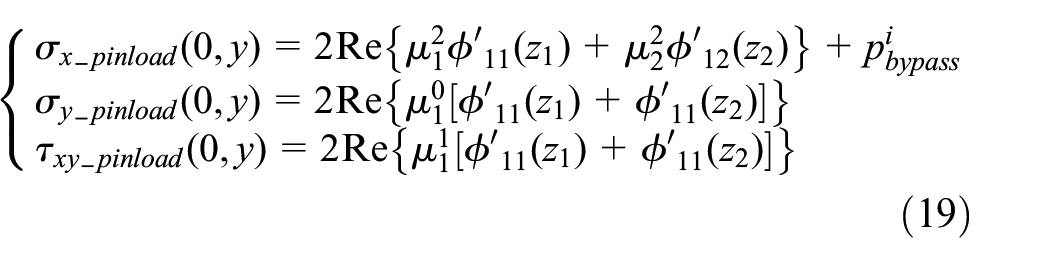
As line 1 and line 2 in Figures 3 and 4 represent the smallest transverse cross-section positions where damage easily happens, 25 stress distribution along these lines are consider specially. For line1, as the stress state can be regarded as linear superposition of σx_pinload and σbypass, which both exhibit stress concentration, equation (18) can be directly employed here by substituting zk = μky. For line 2, as the stress state is considered as superposition of σx_pinload and bypass pressure pibypass, which is a constant along the line, stress expressions are shown as equation (19).
Numerical simulation by FEM
Finite element models of composite multi-pin joints are developed in commercial software ABAQUS. Joints with two, three, and four pins are analyzed. Each model consists of three parts, upper plate, lower plate, and several pins, as shown in Figure 5. For the convenience of analysis, the upper and lower plates are designed to be the same. For joints with different number of pins, the length of plate is changed from 116 to 188 mm. Width and thickness of every plate is 48 and 3 mm respectively. Radius of the hole and pin is 6 mm to obtain neat fit. Pin pitch keeps 36 mm, and distance from the nearest pin to edge is 24 mm. Material properties are shown in Table 1.

Finite element models of composite multi pin joints.
Material properties.

As pins are assumed to be rigid in analytical modeling, rigid body constraints are created between reference points (RPs) and corresponding pins to keep in consistence with the analytical method. Friction in modeling is ignored. Surface to surface contact pairs are built between adjacent plates and pins, which prevents surface penetration in an average sense and provides more accurate results than node-to-surface discretization method. 26 Encastre condition is applied on one side of the lower plate, while tensile load is applied on the other side of the upper plate. In order to decrease the effects of second bending on stress distribution, the constraint of thickness direction is exerted on top surface of the upper plate and bottom surface of the lower plate. All pins could only move along plate length direction.
All parts are created as 3D solid models. Global seed size is 1mm, while refined mesh (0.25 mm × 0.25 mm × 0.5 mm) is applied around holes to obtain relatively accurate results with lower cost. Mesh type of area around holes is C3D8I, while for the other area it is C3D8R. Mesh type and seed size of pins is the same to the area around holes.
Experiments
The tensile experiment was conducted on INSTRON 8801 test machine at room temperature. Single lap specimens with three bolts were loaded with displacement rate 2 mm/min. The length of plate specimens was 262 mm, which was longer than that in numerical models to provide enough space for gripping. Both of the upper and lower plates were 3 mm thick. Plate material used here was unidirectional CFRP laminate with the thickness of 0.2 mm per ply, and properties were shown in Table 1. Plates were assembled with Ti alloy hex bolts by finger tight torque. The torque represented a relatively worse assembly condition, and could reduce the effects of torque on stress distribution to keep in consistence with the simplification in modeling. Radius of bolts was 6 mm. Holes and bolts were assembled as neat fit. But due to manufacture limitation, there was clearance no larger than 20 μm.
As the effects of second bending on stress were not considered in this research, two steel support fixtures were fixed on top and bottom sides of specimens to decrease the bending of plates. There were several slots on the fixtures to go through wires of strain gauges. Layers of thin PTFE gasket were placed between fixture and specimens to decrease friction. Strain gauges were adhered on plate surfaces as it is shown in Figure 6. Due to the existence of bolt heads, gauges were placed 6 mm from hole edges to collect axial strain at these positions along transverse cross-section lines.

The setup of tensile experiments.
Results and discussion
Comparison between results of experiment, finite element and analytical methods was conducted on specimens with three pins as it is shown in Figure 7. Applied load was recorded from 0 to 10,000 N. The experiment was repeated three times and the typical results were used in comparison. Generally the results were in good agreement, and strain at these three positions exhibited approximate multiple relationships. Strain at P1 always got the largest value, while at P3 the value was the smallest. Finite element and analytical results seemed more similar, while a little larger than experiment results which may be caused by the rigid pin assumption.

Results of strain at three points under load.
Normal stress in X direction along three transverse lines is discussed on specimens with three pins. Finite element and analytical results are compared as it is shown in Figure 8. General stress distribution is identical. It shows strong stress concentration along these lines that the stress value near hole edges always reaches the largest value. Stress along these lines drops sharply in the range from the hole edge r to 2r, and then it slightly drops with the distance increasing.

Results of stress along transverse lines on three pin joints.
Relationships of stress along the three lines are changed according to the distance from hole edges. For positions near hole edges, similar stress value is observed on line 2 and line 3, while on line 1 stress gets quite larger value. But when it comes to the distance a little far from the hole, such as 3r, there shows multiple relationships between stress values on these lines. This phenomenon is related to superposition relationships. As it is proved in stress analysis of single pin joints, pin load stress σx_pinload shows strong concentration along the line, 27 and it is much larger than bypass pressure near hole edges. Along line 2 and line 3, bypass stress σbypass is always close to bypass pressure, while for line 1 σbypass is much larger than bypass pressure near the hole edge but decrease violently when it is far from the edge. Therefore, the stress value of line1 near hole edge is apparently larger than that of line 2 and line 3 which gets similar value, mainly consisting of σx_pinload. But for positions far from holes, stress on these lines exhibits multiple relationships. Stress on line 1 is the largest while on line 3 is the smallest.
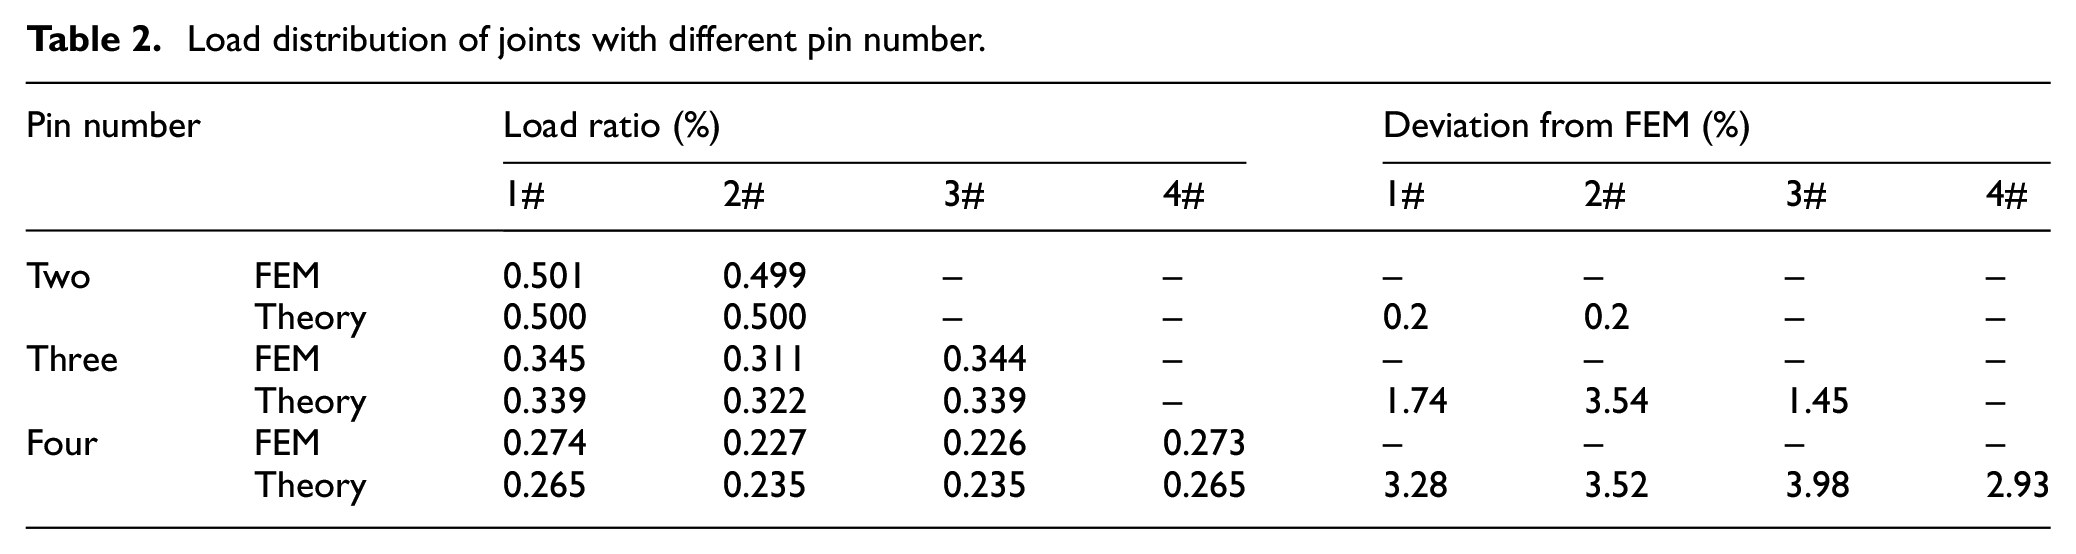
Then load and stress distribution around holes from 0° to 90° is calculated on specimens with two, three and four pins. Finite element method and analytical method are employed in analysis. The applied tensile load is 10,000 N. Load results including pin load and bypass load are expressed in unified percent form by dividing total load 10,000 N, as shown in Table 2 and Figure 9. Stress results are shown in Figures 10 to 12. Generally, stress curves in the three kinds of joints get similar trend. The value level of σy is lower than σx, and value difference between different holes is more apparent on σx results.
Load distribution of joints with different pin number.

Pin load and bypass load distribution of joints with different pin number.

Stress distribution around holes on two pin joints.

Stress distribution around holes on three pin joints.

Stress distribution around holes on four pin joints.
As it is shown in Table 2 and Figure 9, load transferred by the two pins is almost the same. Therefore, bypass load of pin 1# is half of the total applied tensile load. Stress distribution of two pin joints is shown in Figure 10. Both of σx and σy are discussed. σy around hole 1# and hole 2# is similar, as the load transferred by these two pins is the same and bypass load has little effects on σy. The maximum value of σy presents in the vicinity of 0°. Negative value is observed when angle exceeds about 22.5°. Then when it comes to 90°, the value increases to be zero. Maximum value of σx appears at 90°. Negative value exists in the vicinity of 0° which is consistent with bearing state. Values of σx show differences around these two holes. The stress value around hole 1# is higher than hole 2#. This difference is more apparent when it comes to 90°. The peak value of hole 1# is about 1.4 times as large as that of hole 2#.
For joints with three pins, it could be noticed that there are differences of the load transferred by the three pins. Pin 1# and pin 3# take more load than pin 2#, but the difference is relatively tiny. Therefore, bypass load of pin 1# is almost twice as much as that of pin 2#. Stress distribution of three pin joints is shown in Figure 11. σx and σy are also discussed here. Different from two pin case, σy shows value differences around these holes. The value of hole 1# and hole 3# is a little higher than that of hole 2#, which is related to the pin load distribution. Maximum values of all the three curves appear at 0°. For σx, maximum values appear at 90°. Peak stress around hole 1# is about one time larger than that around hole 2# and hole 3# due to larger bypass stress. Values of hole 2# and hole 3# are similar in general.
For joints with four pins, pin 1# and pin 4# shared more load than pin 2# and pin 3#. Bypass load of these pins shows approximate linear relationship. The values of pin 1#, 2#, 3# and 4# are about 73%, 50%, 27% and 0 of the total load. Stress distribution of four pin joints are shown in Figure 12. σy around four holes on plates can be classified into two kinds. Hole 1# and hole 4# get similar stress level and it is larger than that of hole 2# and hole 3#, which should be attributed to the uneven distribution of pin load. σx around these holes is similar in most of the analyzed range, but exhibits apparent differences in the vicinity of 90°. Stress value of hole 1# is the largest due to the combination of bypass stress and pin load stress. However, for the other three holes, the stress level is similar which should attribute to the similar pin load stress and small bypass stress. The peak value of hole 1# is about 1.75 times as large as that of hole 2# and hole 3#.
Comparing the load distribution of different joints in Figure 9, it could be noticed that the load transferred by each pin decreases with pin number increasing. However, as a consequence, bypass load of each pin increases. In the area where bypass stress shows weak concentration or plays a small role, this situation leads to similar stress state of different pins as it can be seen in Figures 10 to 12. But around hole 1# where bypass load is the highest and bypass stress exists concentration, the situation leads to apparent higher stress level in the vicinity of 90° near the hole edge, where is commonly the damage position.
Stress distribution around the first (1#) and last (N#) holes of joints with two, three and four pins in polar coordinate system is compared in Figure 13. It can be noticed that the increase of fastener number decreases the general stress level indeed. But the decrease is relatively small for hoop stress in the vicinity of 90° around the first hole, which weakens the benefits of fastener increase.

Stress distribution around the first and last holes of joints with different number of pins in polar coordinate system.
Conclusion
An analytical model for stress distribution of composite multi-pin joints is proposed in this paper. Finite element method and experiments are employed to verify the validation of the analytical method, and good agreement is obtained. Stress distribution along hole edges and transverse cross-section lines is analyzed for the joints with different pin number. The main conclusions are as follows:
The proposed analytical method is effective in stress analysis of composite multi-pin joints. The effects of bypass load and hole position are considered, and the stress state could be obtained conveniently when material properties and load conditions are known.
The stress around holes on multi-pin joints can be regarded as a superposition of pin load stress and bypass stress. But the effect of bypass stress is decided by the position of hole. For holes in middle position, due to the constraint of adjacent pins, bypass stress there is apparently small than that around the first hole.
Stress difference caused by pin position mainly reflects in normal stress σx. The first hole always leads to the largest σx, while the stress around other holes is similar. The value of σy generally keeps the same for all holes.
Pin number increase will lead to stress level decrease, but this effect is relatively small for hoop stress near 90° around the first hole, which is always the position of maximum value. This situation weakens the benefits brought by multi-pin joints.
Stress analysis is the foundation of damage and failure evaluation. In future research, damage criterion will be involved in this model to provide information about failure and strength for the design and applications of composite multi-pin joints.
Footnotes
Acknowledgements
The authors would like to acknowledge the editors and the anonymous referees for their insightful comments.
Handling Editor: James Baldwin
Declaration of conflicting interests
The author(s) declared no potential conflicts of interest with respect to the research, authorship, and/or publication of this article.
Funding
The author(s) disclosed receipt of the following financial support for the research, authorship, and/or publication of this article: This research is financially supported by the Fundamental Research Funds of the Central Universities CAUC Special Project (3122019071).