
Abstract
Polyethylene terephthalate (PET) foam sandwich structure is widely used in the fields of construction, aerospace and shipbuilding. We have conducted research on its hygroscopic phenomenon. Take different sizes of GFRP panels, PET foam and PET foam sandwich structure for moisture absorption tests, analyze the data on the basis of the classic Fick’s law of diffusion to obtain the moisture absorption curves of each sample. And get the diffusion coefficient of the specimen. Then, we use the multi-physics software COMSOL to model and analyze the moisture absorption properties of the specified samples. The moisture absorption curve obtained by theoretical calculation was compared with the experimental moisture absorption curve, and the results showed that the two Good agreement. Tests have proved that the moisture absorption performance of PET foam is much greater than that of GFRP panel material, and the relative moisture absorption is related to the specific surface area of the sample. In the PET foam sandwich structure, the GFRP panel can effectively inhibit the hygroscopicity of the PET foam and has an excellent protective effect on the PET foam.
Keywords
PET foam is a polymer material that is used in yachts and ships. The main component in this foam is polyethylene terephthalate. This foam has excellent flame retardant, low smoke and nontoxic (FST) properties, high-temperature resistance, excellent fatigue resistance, good mechanical properties and chemical resistance, excellent sound insulation performance and low water absorption and can better meet the specific functional needs of military or civilian ships.
Polymer foam, as a porous material, exhibits relatively apparent hygroscopic behavior when it is directly exposed to hot and humid environments (mainly through a rapid, short-term increase in weight). Although resin-based fiber-reinforced board has relatively poor hygroscopicity, it has a long lifespan. In a hot and humid environment, water molecules enter the interior of the material through defects or cracks on the surface of the board, resulting in a decrease in the bonding strength of the fiber-resin interface and hygroscopic expansion and relaxation of the polymer matrix, which affects the overall strength of the material.
Some studies state that the diffusion behavior of water in polymer materials conforms to Fick’s diffusion law from a quantitative perspective. For example, Earl and Shenoi 1 presented the short-term moisture absorption curve of PVC (polyvinyl chloride) foam in a hot and humid environment. The classic Fick’s model fitted the experimental curve well.
Legrand et al. 2 studied the hygroscopic characteristics of African mahogany. In a constant-temperature seawater environment at 40°C, the similarity in the moisture absorption characteristics between the two levels of African mahogany in the horizontal direction was used to fit the experimental data with a three-dimensional Fick’s model. The diffusion coefficients of African mahogany were obtained in different directions, and its moisture absorption characteristics were analyzed by means of numerical simulation. Avilés and Aguilar-Montero 3 studied the moisture absorption behavior of a sandwich structure with PVC foam as the middle and resin-based glass fiber reinforced board on the outside based on the classic Fick’s model and obtained its diffusion coefficient. The theoretical curve was compared with the experimental moisture absorption curve, and the two fit well.
However, for some foams that have been in a hot and humid environment for a long time, the classic Fick’s model is not applicable. The experimental curve and theoretical curve based on the Fick’s model may deviate significantly. Behavior that deviates from the Fick’s diffusion model is usually called “non-Fick behavior.” For example, Earl and Shenoi 1 found that PVC foam that has been in a hot and humid environment for a long time generally displays a moisture absorption curve with three different stages, in which only the first stage fits well with the Fick moisture absorption model and the other two stages show significant deviations. The article states that the hygroscopic expansion and stress relaxation of the PVC foam are the main reasons for this phenomenon.
Huo et al. 4 also observed three different stages in the foam moisture absorption curve when researching the moisture absorption characteristics of PU (polyurethane) foam. The article proposed a diffusion coefficient in the form of a piecewise function; the diffusion coefficient in the second stage is a time-dependent variable. The author carried out modeling analysis through numerical simulation. The theoretical curve and the experimental curve obtained fit well. Xiaoming and Weitsman 5 were used to study the effect of seawater on the performance of two kinds of PVC foam sandwich with different densities. The swelling rate of PVC foam after moisture absorption was analyzed. It was found that the moisture absorption expansion rate of the two density foam was not the same. After a period of immersion treatment, the density H100 foam expansion rate is 2.8%, and the density H200 foam expansion rate is 0.4%. It was observed that water only immersed in a small area outside the foam cell periphery, and there was no water entry in most of the central part of the bubble. The water was filled with cell elements and irreversibly destroyed the cell walls. Based on the analysis of test phenomena in document, 5 Ionita and Weitsman 6 considers that the moisture absorption behavior of PVC foam is not dominated by diffusion. The moisture absorption of foam cell wall occupies a dominant position in the process of foam moisture absorption. It is believed that when the water enters the edge of the foam material, the cell wall will be eroded by the cell generated by cutting. The internal stress generated by the hygroscopic expansion of the cell wall will eventually destroy the cell wall buckling, and the moisture will continue to enter the next cell element through the broken cell wall. In addition, for the situation that the moisture absorption curve of polymer materials deviates from the classical Fick’s model curve, many literatures also put forward their own theoretical models, For example, Bao and Yee 7 proposed a double diffusion coefficient model for water diffusion in woven/unidirectional braided hybrid composites. Whitney and Browning 8 observed that the diffusion of water in graphite/epoxy composites deviated from the classical Fick’s model. Considering the factors of matrix cracking, the time-varying diffusion coefficient was proposed. Based on the Langmuir type 9 diffusion model, Grace and Altan 10 proposed a three-dimensional hindered diffusion model, which considered the Fick diffusion and pseudo-Fick diffusion of water in the resin matrix, that is, the mutual transformation of free water and bound water, and considered the change of total chemical bond energy in the process of water diffusion.
Composite sandwich structure panels and polymer foam core materials are more sensitive to hot and humid environments, and with the increase of exposure time, the mechanical properties of the entire sandwich structure and its components may change to varying degrees. Many documents aim at different types of cores. The damp and heat aging performance of sandwich structure of the material or polymer panel was studied. For example, literature 5 found that for PVC foam that has been exposed to seawater for a long time, the entry of water will cause buckling and damage to the foam cell wall, which has a substantial impact on the overall mechanical properties of the PVC foam and the sandwich structure. Literature 11 studied the damp-heat aging of PMI foam and found that after a considerable period of immersion in water, the static performance and fatigue performance of PMI foam decreased significantly. Literature 12 focused on PVC foam and Barcelona the aging of wood in seawater environment was studied, and similar results were obtained.
The study of the moisture absorption mechanism of composite materials is the basis for understanding the effect of moisture on the mechanical properties of materials. This paper mainly conducts moisture absorption performance experiments on resin-based glass fiber reinforced boards (GFRP panels), PET foam, and PET foam sandwich structures. Based on the classic Fick’s law of diffusion to describe the hygroscopic behavior, the diffusion coefficients of multiple groups of specimens were obtained from the hygroscopic experimental curve under constant temperature at 40°C. Then, further modeling and analysis through COMSOL software could more intuitively describe the water diffusion inside the specimen.
A comparison of the results of the numerical simulation with the results of the moisture absorption experiment further verified the accuracy of the experiment.
Experimental basics
Theoretical model of water diffusion
Some literature1,2,4 have confirmed that for polymer composite panels, the moisture absorption test curve obtained based on Fick’s second law is in good agreement with the theoretical curve. Therefore, in this paper, the moisture absorption of the panel based on Fick’s diffusion model Behavior analysis.
The formula for determining the moisture content of polymer materials is:
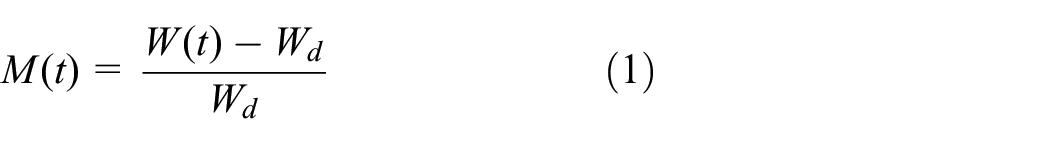
In the formula:
The hygroscopic behavior of the polymer composite boards and foam materials in the initial stage generally satisfies Fick’s second law:
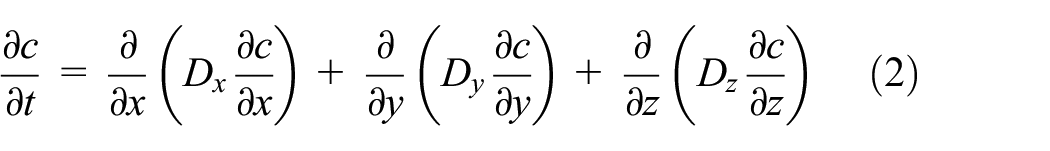
Among them:
For a thin polymer composite board (as shown in Figure 1), since its dimensions in the x and y-directions are much larger than that in the z-direction, usually only the moisture absorption in the thickness direction can be considered, so formula (2) can be simplified to a one-dimensional diffusion formula:


Geometrical dimensions of orthotropic composite plate.
For formulas (3), Springer G.S. 13 proposed a numerical solution for the effective spreading form of the three-dimensional model under short-term water absorption:

The formula for calculating the diffusion coefficient D in equation (4) is:

According to formulas (4), it is known that it the diffusion coefficient is linearly related, and the formula for calculating the diffusion coefficient is:

Therefore, the diffusion coefficient can be obtained by measuring the


Relative water content-time root curve of polymer materials.
In formula (7), if

Effective diffusion coefficient
Experimental preparation
The actual density of the high-performance PET foam used in this article is 150 kg/m3, and the reinforcing fiber used is a 0°/90° bidirectional hybrid glass fiber cloth. In order to facilitate the design of the sandwich structure, the thickness of the mixed glass fiber cloth is 1 mm. The resin used to make the panel and the PET foam sandwich structure is a low-viscosity epoxy resin, and the curing agent used is methyltetrahydrophthalic anhydride (MeTHPA).
The GFRP panel sample and PET foam sandwich structure used in the experiment were made using the VARTM process (vacuum-assisted resin transfer molding method). The principle of the process is shown in Figure 4 below.

Schematic diagram of the VARTM process principle.
The simulated seawater sample is prepared according to the ASTM D 1141-98 standard 14 Standard Practice for Seawater Substitutes. Before the seawater substitute is configured, the distilled water in which the salt is dissolved is boiled in the incubator for a certain amount of time. The effect of removing the impurities and microorganisms from water is shown in Table 1.
Simulated seawater salt concentration table.

The constant temperature needed for the experimental environment was provided by a domestic instrument company HH-W600 water bath incubator. The experimental environment temperature in this article is a constant temperature of 40°C.
Experiment
The study of the hygroscopic mechanism of composite materials is the basis for understanding the effect of moisture on the mechanical properties of the material. Therefore, hygroscopic performance experiments were carried out on the resin-based glass fiber reinforced board, PET foam, and PET foam sandwich structure. Based on the classic Fick’s diffusion law for absorbing moisture, the behavior was described. The diffusion coefficients in all directions of the panel material were obtained through the hygroscopic experiment curve at a constant temperature of 40°C.
Experimental specimens
The GFRP test specimens, PET foam test specimens, and PET sandwich test specimens used for the moisture absorption experiments were cut with a water saw, as shown in Figure 5.
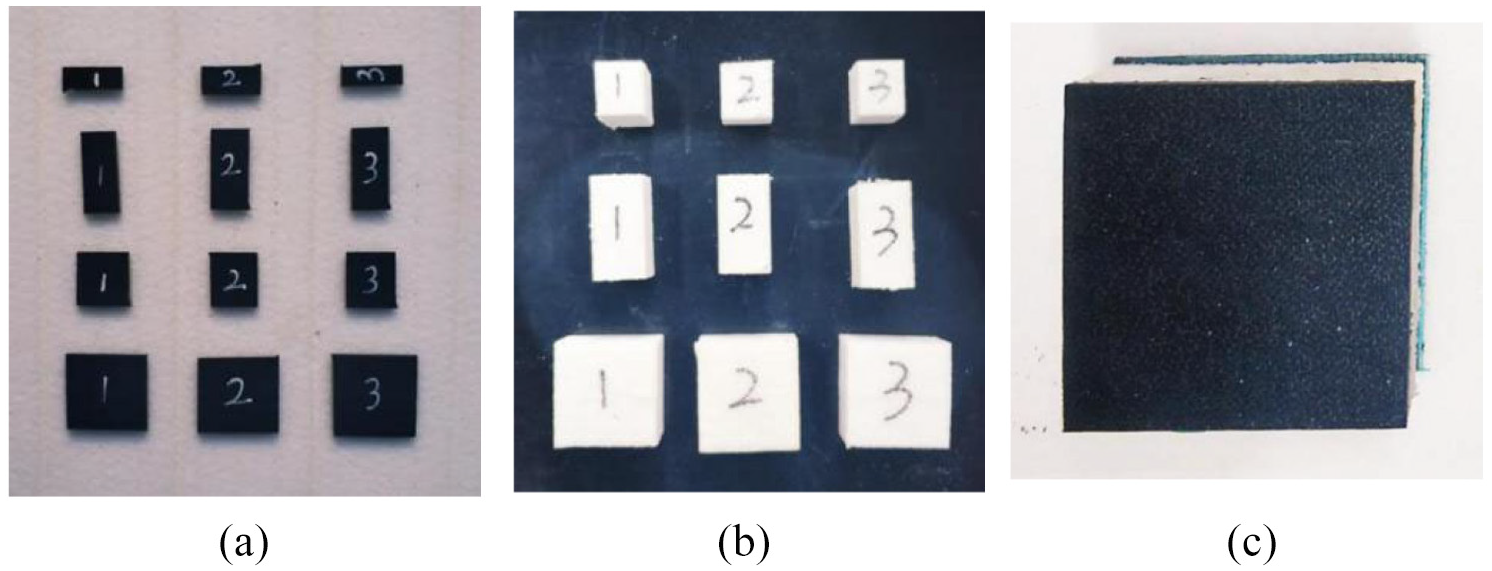
GFRP board, PET foam and sandwich structure used for the hygroscopic test: (a) GFRP hygroscopic test sample, (b) PET foam hygroscopic test sample, and (c) PET sandwich structure hygroscopic test sample.
According to the theoretical part above, the diffusion coefficient obtained from the moisture absorption curve (M-
To remove the influence of moisture in the cutting process, the test pieces were placed in a constant temperature box before being soaked and dried to a constant weight at a constant temperature of 40°C. The samples were removed and weighed. The weighing device, an electronic scale, had an accuracy of 0.01 g. The measuring instrument was Vernier calipers. Approximately 15 L of purified water was poured into the incubator. To prevent the seawater from corroding the wall of the incubator and the heating tube, the configured seawater was placed in the storage box and heated in a water bath. The temperature of the incubator was set at 40°C.
Tests
Multiple groups of water absorption experiments were performed on the GFRP panel material, PET foam, and PET sandwich structure. To reduce the error, each test piece was measured three times, and then the average value was taken. Finally, the best trend among the three test pieces in each group was selected as the experimental result.
During the experiment, the test pieces were immersed in a constant temperature seawater environment at 40°C. The samples were removed and weighed every 1–3 days. To prevent the evaporation of water during the weighing process from affecting the test results, the samples were wholly immersed in a beaker filled with water, taken out during weighing, and immediately put back after the weighing was completed. During the weighing process, medical absorbent cotton was used to wipe the nonabsorbed moisture off of the surface of the sample.
Analysis of experimental results
GFRP panel material moisture absorption experiment
The moisture absorption experiment of the panel material is actually carried out in a seawater environment at a constant temperature of 40°C. The information of the sea water environment and the incubator is in accordance with the above description. We completed the experiment and obtained the result. Four data points with relatively good trends were selected from four groups of different sizes. They are numbered X-A (28.8 mm × 11.5 mm × 4.8 mm), X-B (22.1 mm × 29 mm × 4.5 mm), X-C (38.8 mm × 19.9 mm × 5.2 mm), and X-D (41.8 mm × 40.3 mm × 4.3 mm). Figure 6 shows the moisture absorption curves of four different sizes of GFRP laminate samples in 720 h.

Short-term moisture absorption curve of GFRP panel sample: (a) sample X-A, (b) sample X-B, (c) sample X-C, and (d) sample X-D.
The analysis of the moisture absorption curves of each group shows that the relative root moisture curve of the GFRP sample at soaking times up to 720 h basically conforms to the classic Fick’s model. The moisture absorption of the GFRP panel does not exceed 5%, the moisture absorption of the GFRP panel is not more than 5%, and the smaller the GFRP panel’s size is, the higher the relative moisture absorption. Although the sample with a larger size has a larger contact surface with the external environmental moisture, the moisture absorption is lower than the mass of the sample itself, so the larger sample has a relatively low amount of moisture absorption. In addition, the moisture absorption of GFRP is slow, and it is difficult to reach saturation in the short term. Based on the results of related literature,1,4,13,15 this paper determines that the theoretical saturated moisture absorption of GFRP panels is approximately 9%, and the soaking time is longer than 50,000 h.
The effective diffusion coefficient of each sample can be calculated from the slopes of the moisture absorption curves of differently sized samples. The effective diffusion coefficients of X-A, X-B, X-C, and X-D are 5.6410−7, 3.0910−7, 3.4610−7, and 1.8310−7, respectively.
The obtained effective diffusion coefficient D-(h/l+h/w) curves of the GFRP samples of different sizes are shown in Figure 7. According to the intercept and slope of the curve on the y-axis, the thickness and vertical direction of the GFRP sample can be calculated. The diffusion coefficients in the three directions of thickness are DZ = 6.05 × 10⁻⁸ mm/s2 and DX = DY = 7.48 × 10⁻⁷ mm/s2.

The effective diffusion coefficient of differently sized samples,
From the calculated diffusion coefficient, it can be seen that the diffusion coefficient of the GFRP panel in the thickness direction is much smaller than the diffusion coefficient perpendicular to the thickness direction. This is because the surface is dense along the thickness direction, the glass fibers and the surface are perpendicular to the thickness direction, the resin’s interface range is broad, and the water can quickly enter the interior of the material through these channels.
PET foam moisture absorption experiment
The moisture absorption curves of the three groups of PET foam specimens immersed in 40°C constant temperature are shown in Figure 8 and Figure 9.

Moisture absorption test curve of PET foam sample: (a) the first group, (b) the second group, and (c) the third group.

Comparison of three groups of hygroscopic curves.
The moisture absorption curve of the PET foam soaked for 720 h shows roughly two different stages. The first stage has a short duration of 0–1.7 h. The research results in Xiaoming and Weitsman 5 and Whitney and Browning 8 show that the cells on the surface of the closed-cell polymer are opened by cutting. Water can enter the interior of the cell through free diffusion. Therefore, during the initial stage of polymer foam soaking, the material’ weight will rapidly increase. The diffusion of water in this stage agrees with the classic Fick’s diffusion model.
The second stage occurs from 1.7 to 720 h. In this stage, the moisture absorption curves of the PET foams of different sizes in the three groups of samples are consistent. The relative moisture absorption of the foam is approximately linear with the square of the time. The foam moisture absorption behavior at this stage is approximated by Fick’s law. However, the trend of the curve in the second stage is slower than that in the first stage, which indicates that the rate of water diffusion slows as it diffuses into the foam. According to the trend of the curve, the relative moisture absorption of the sample continues to increase, indicating that the PET foam sample has not yet reached saturated moisture absorption after 720 h of soaking.
Based on the observations and analysis of the three groups of PET foam moisture absorption curves, this article uses a diffusion coefficient in the form of a piecewise function based on the Fick’s diffusion model. The first stage is that up to a soaking time of 1.7 h, where the water enters the surface of the PET foam in the form of free diffusion. Inside the cells, in the second stage of soaking from 1.7 to 720 h, water diffuses from the surface cells to the inside of the PET foam. The diffusion coefficients for the three groups are calculated, as shown in the following Table 2:
Diffusion coefficient of each group of samples.
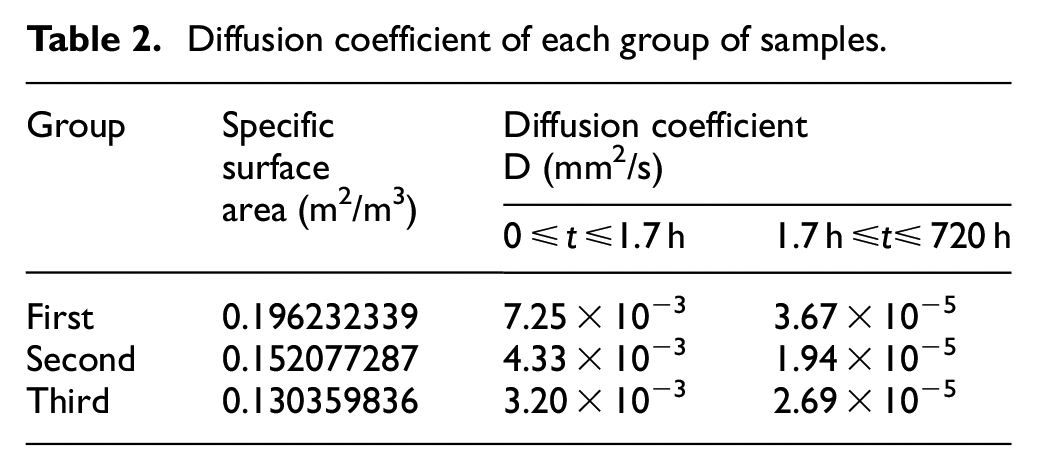
As seen from the table above, the diffusion coefficients of the three groups of samples differ greatly in the two stages. The diffusion coefficient in the first stage can be more than 100 times the diffusion coefficient in the second stage. The ratio of the effective diffusion coefficient to the sample in the first stage. There is a certain correlation between the surface areas, and the diffusion coefficients of the three groups in the first stage all increase according to the specific surface area.
Comparing the diffusion coefficient of the GFRP panel material above shows that the diffusion coefficient of the PET foam is significantly larger and the water absorption performance of PET foam is significantly better.
Hygroscopic experiment on the PET foam sandwich structure
The PET foam sandwich structure used for the moisture absorption test is taken out at different time intervals and weighed. The resulting moisture absorption curve is shown in the red curve in Figure 10 below. The moisture absorption curve obtained is shown by the red curve below. During the first 0–7 h of soaking, the moisture absorption curve trends steeply, indicating that the moisture absorption of the interlayer proliferates. This may be because moisture enters the open cells of the surface of the PET foam on the sandwich structure’s core in a freely diffusing form, resulting in a rapid increase in the moisture absorption in the short term. At 380 h, the trend of the curve is flattening, indicating that the sandwich structure’s moisture absorption rate is slowing, and the moisture absorption may tend to be saturated. It is necessary to observe and record a longer soaking time to conclude that the moisture absorption is entirely saturated.

Comparison graph of moisture absorption curves of PET foam and PET sandwich structure.
To analyze the panel’s protective effect on the PET foam during the moisture absorption process of the PET sandwich structure, the curves of the PET foam moisture absorption samples of similar size are compared. As shown by the black curve above, the PET foam curve is located above the PET sandwich structure’s moisture absorption curve. Under the same soaking time, the relative moisture absorption of the PET foam is much greater than that of the PET sandwich structure. The two curves are roughly the same. Based on the analysis of the results of the previous net GFRP board moisture absorption test, it is known that because of the slow transfer rate of moisture in GFRP, the presence of the GFRP panel in the sandwich structure effectively prolongs the direct contact time between the water and PET foam, and the moisture absorption of the GFRP panel itself is minimal. Therefore, even if the moisture completely penetrates the GFRP panel, very little moisture enters the panel and directly contacts the PET foam. The moisture absorption of the GFRP panel itself is minimal. Therefore, even if the moisture completely penetrates the GFRP panel, the amount of moisture that can enter the panel and directly contact the PET foam is very high. In the sandwich structure’s overall moisture absorption process, the moisture absorption of the portion where the PET foam directly contacts the moisture is the central part.
Numerical simulation of water diffusion
Modeling and boundary conditions
In this section, the multiphysics software COMSOL is used to conduct 3D modeling and analysis of the moisture absorption of the PET foam, GFRP board, and PET sandwich structure in the experiment. The data used for modeling in the numerical simulation process are all data from the above experiments.
The numerical simulation analysis in this chapter is mainly for the moisture absorption test in this article. By modeling the specific GFRP sample and PET foam sample in the test and combining the diffusion coefficient obtained from the test, the moisture absorption curve of the corresponding model is derived for comparison with the test moisture absorption curve. In order to analyze and verify the rationality of the diffusion coefficient and the correctness of the modeling process, and then model the moisture absorption of the sandwich structure, compare the derived data with the experimental moisture absorption curve, so as to realize the analysis and evaluation of the water content change of the sandwich structure.
The selected GFRP samples are the samples with the size of 41.8 mm × 40.3 mm × 4.3 mm in the first group, the PET foam samples are the samples with the size of 29.4 mm × 31.3 mm × 31.2 mm in the first group, and the size of the PET foam sandwich structure is 62.5 mm × 61.0 mm × 31.4 mm, The panel thickness is 3.9 mm, and the specific parameters of the sample are shown in Table 3 below. Since the two materials are orthotropic materials with symmetry, and they are completely immersed in water during the test immersion process, they are under construction. When modeling, use two symmetry planes to cut one-eighth of the sample for modeling.
Density, size and diffusion coefficient of numerical simulation sample.

After completing the modeling of the two materials, the material parameters are set through the Dilute Substance Transfer interface provided by COMSOL. Since the transfer of substances in the diffusion process only involves water, the number of substances selected is 1, and the research is carried out everywhere in the matrix. Transient changes in concentration over time. The governing equation for transferring attributes is:


The transfer mechanism is set to the mass transfer of porous media, and the other settings in the Transfer of Diluted Species interface remain the default options. When setting the boundary conditions, considering that there is no water in the entire material domain at the initial moment, the initial value of its concentration is set to 0 mol/m3, and it satisfies where the outer surface of the sample is in direct contact with the environment:

C0 is the moisture concentration in the environment, which is 5.6 × 10⁴ mol/m3 in this experiment, which satisfies the symmetry plane:

l, w, and h are the length, width, and height of the sample, respectively. The above three formulas indicate that the concentration gradient at the symmetry plane is 0. Since the diffusion coefficient of PET foam is not a constant, it is a piecewise function. When the diffusion coefficient is defined, it is realized by defining variables and piecewise functions; that is, the diffusion coefficient is defined as a quantity that changes with time. For a sandwich structure, the panel and the core material satisfies the concentration at the interface connector continuity condition selected grid ultrafine division, division results is shown in Figure 11.
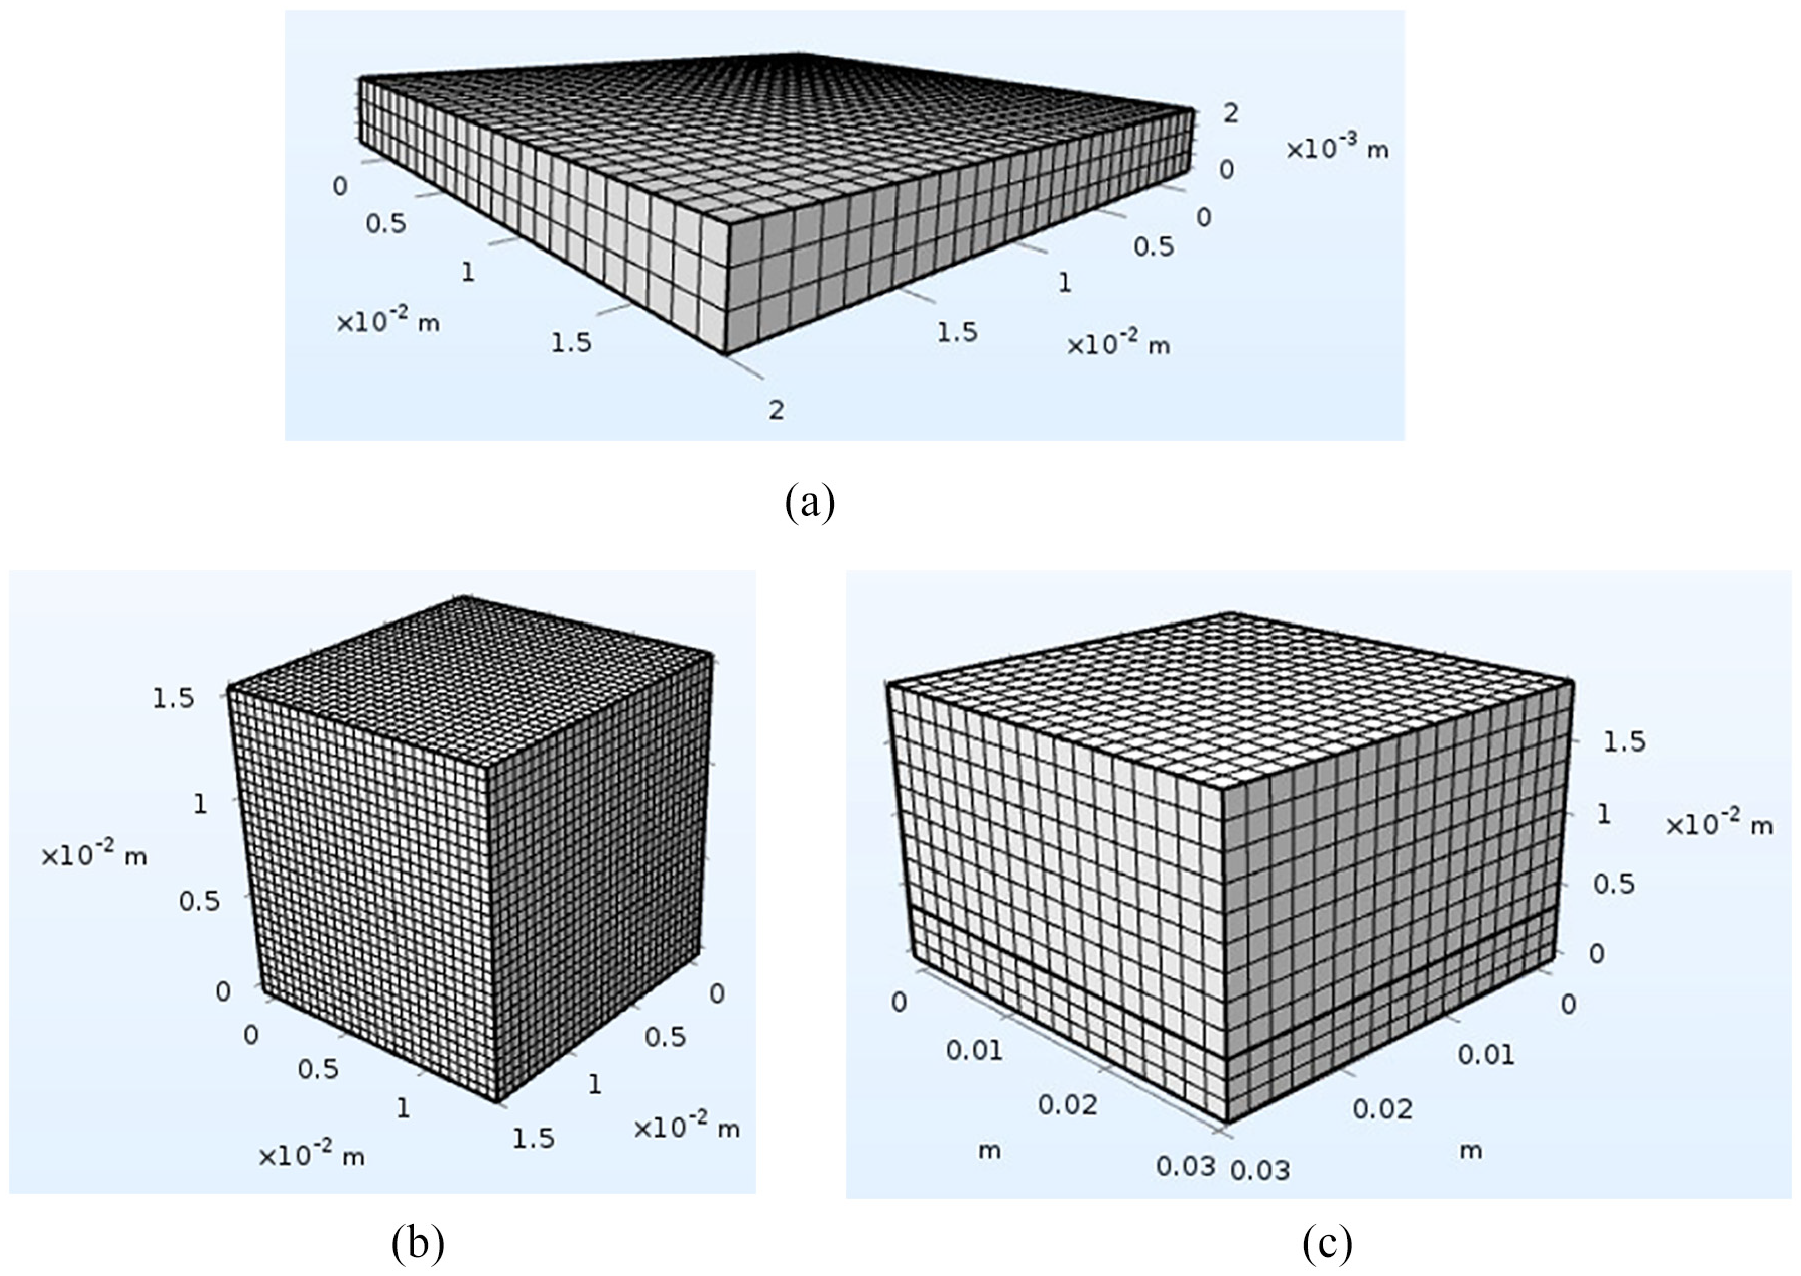
The grid division of each sample model: (a) GFRP panel sample grid division, (b) meshing of PET foam samples, and (c) meshing of PET foam sandwich structure sample.
Comparative analysis of results
The moisture concentration distribution of the GFRP samples, PET foam specimens immersed in 720 h, and PET foam sandwich specimens at 380 h immersion time are shown in Figures 12 to 14:

Moisture concentration distribution of the GFRP panel when immersed in water for 720 h.

Moisture concentration distribution of the PET foam A1 sample immersed for 720 h.
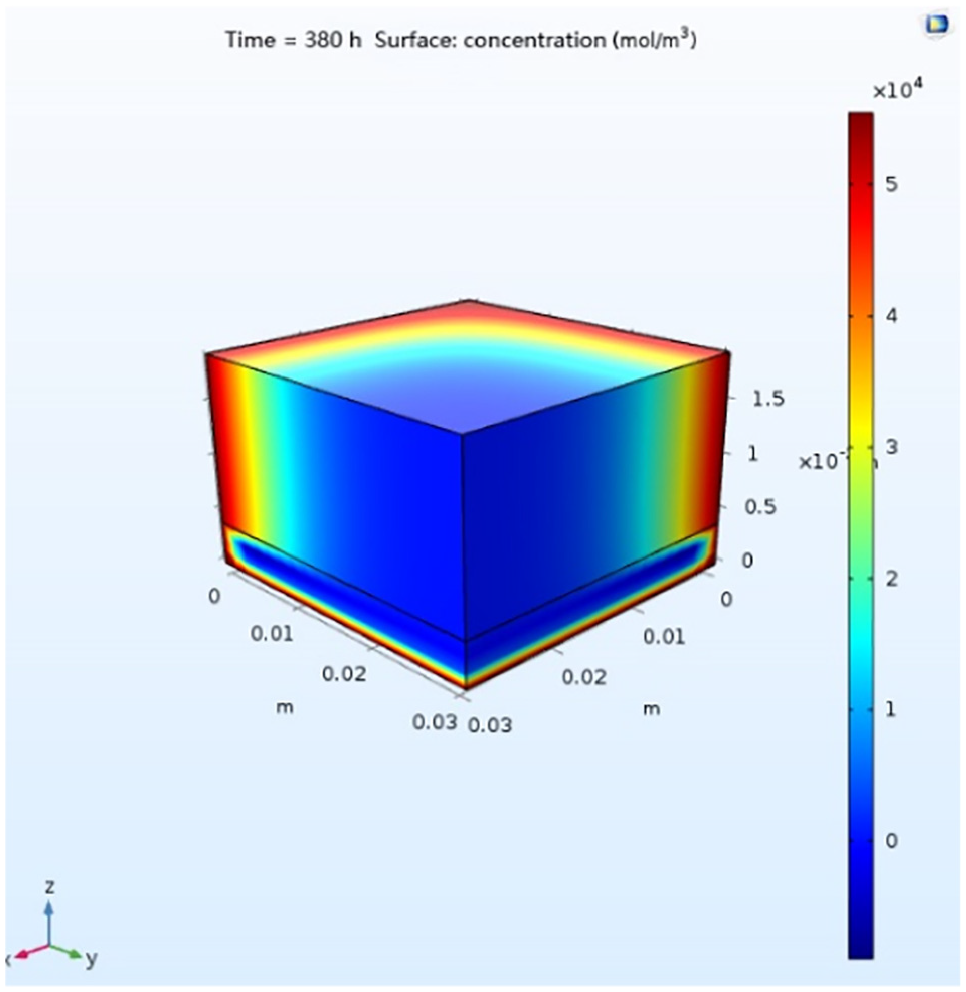
Moisture concentration distribution of PET foam sandwich structure samples immersed for 380 h.
The areas with the same color in the figure are isoconcentration areas. After the observation and analysis, the water concentration in the center of the GFRP panel and PET foam is still 0 after 720 h of soaking, indicating that the moisture absorption of the two has not yet reached saturation. The moisture content in the GFRP panel is located in the area near the outside of the sample directly contacting the water. Simultaneously, the depth of the PET foam is more significant, and the distribution of the moisture can be seen in the middle’s vicinity. In the sandwich structure, the penetration depth of the moisture in the GFRP panel is much smaller than that in in the PET foam. This can be observed at the junction of the PET foam and GFRP panel. After moisture immersion in the PET foam, the moisture content of the PET foam is much larger than its penetration depth in the panel. The moisture in the PET foam continues to diffuse in the low concentration area of the GFRP panel. Therefore, the concentration distribution appears in the vicinity of the surface core transfer, so a concentration distribution, as shown in Figure 14, appears in the area near the core-core junction.
The GFRP panel material can significantly inhibit the water absorption of PET materials. Therefore, the use of this sandwich structure can effectively prevent PET foam from absorbing too much water in seawater, making better use of its lightweight and high strength characteristics.
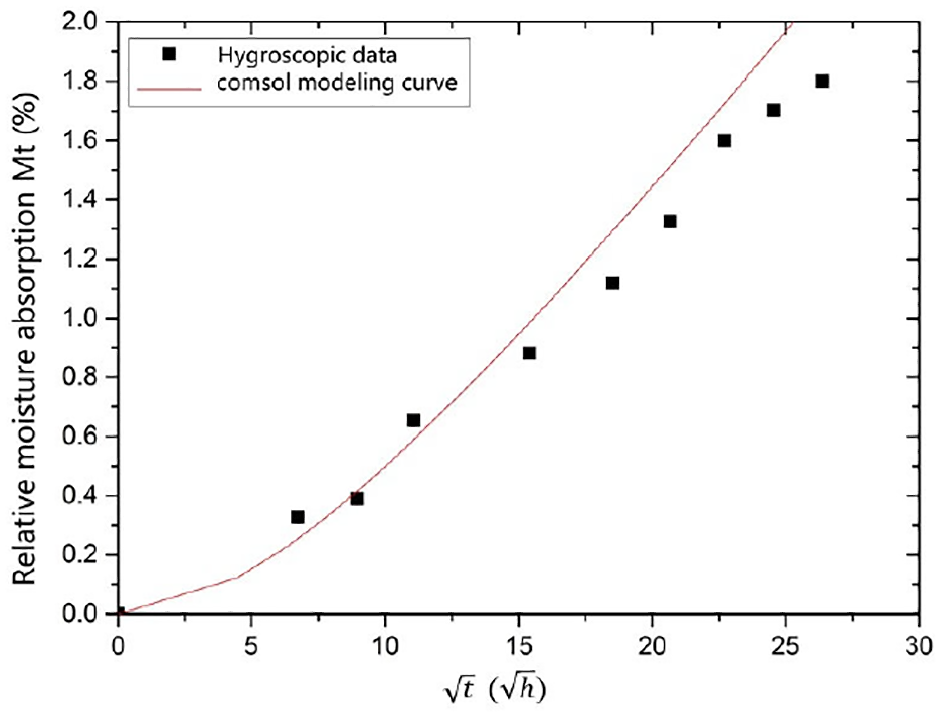
After defining the space integration for all regions of the model, the total water concentration in the sample can be output by defining the water concentration C of the integration object, and the theoretical relative moisture absorption Mt of each group of samples is shown in Figures 15 to 17 red curve below, above. As shown in the middle red curve, the trend of the experimental data points is roughly consistent with the theoretical curve, indicating that the diffusion coefficient obtained through the experiment is reasonable and the numerical simulation results are in line with the experimental results.
Comparison of experimental data and numerical simulation curve of GFRP sample.

Comparison of experimental data and numerical simulation of PET foam A1 sample.

Comparison of experimental data and numerical simulation of PET foam sandwich structure.
Conclusion
This article mainly focuses on the sandwich structure with PET foam as the core material and epoxy resin-based glass fiber reinforced board as the panel. The following researches are carried out: under the condition of 40°C constant temperature seawater environment, different sizes of GFRP panels, PET foam, PET The foam sandwich structure sample was subjected to moisture absorption test to obtain the moisture absorption curve of each sample, and the Fick diffusion model was given to calculate the diffusion coefficient of the PET foam and GFRP panel, and the multiphysics software COMSOL was used to model and analyze it. Through these works, we have reached the following conclusions.
The moisture absorption rate of the GFRP panel material is slow, and it does not reach the saturation state in the short term. The moisture absorption amount does not exceed approximately 5%, and the moisture absorption amount is small. The diffusion coefficient of the GFRP material is related to the moisture absorption direction of the test piece. The three-dimensional modeling and analysis of the GFRP panel were carried out through COMSOL, and the theoretical moisture absorption curve and the experimental curve fit well.
The moisture absorption performance of the PET foam material is much better than that of the GFRP panel material. The amount of moisture absorption can reach approximately 80%, and the amount of moisture absorption is large. The PET foam absorbs moisture in two stages. The diffusion coefficient in the first stage is much larger than that in the second stage. The diffusion coefficient of the second stage reaches more than a hundred times the diffusion coefficient of the GFRP panel material.
The moisture absorption process of the PET sandwich structure is similar to the moisture absorption process of the PET foam materials. The moisture absorption capacity of the PET foams is the main factor. The GFRP panel material blocks the direct contact of the PET foam with seawater, thereby inhibiting the moisture absorption effect of the sandwich structure and playing a protective role. Combined with the COMSOL software simulation analysis, we can see the diffusion process of seawater in the sandwich structure. The penetration depth of water in the GFRP panel is far less than that in the PET foam, and the moisture in the PET foam continues to diffuse in the low concentration area of the GFRP panel.
Footnotes
Handling Editor: James Baldwin
Declaration of conflicting interests
The author(s) declared no potential conflicts of interest with respect to the research, authorship, and/or publication of this article.
Funding
The author(s) disclosed receipt of the following financial support for the research, authorship, and/or publication of this article: Thanks to Fundamental Research Funds for the Central Universities [Grant No. 3072020CF0210] for financial support.