
Abstract
Advanced multiple injection strategies have been suggested for compression ignition engines in order to meet the increasingly stringent emission regulations. Experiments and simulations were used to study effects of the main-injection mode (times), the post-injection proportion, and timing on combustion and emissions in a heavy-duty diesel engine at high load and constant low speed. The results reveal the following. The NOx emissions of 1main+1post, 2main+1post, and 3main+1post injections are all lower than those of single injection; the higher the number of main-injection pluses, the lower the NOx emissions. Enough main-post injection interval is needed to ensure post and main injections are relatively independent to entrain more fresh air to decrease the soot. Over-retarded post-injection timing tends to increase the soot due to the lower in-cylinder temperature. The combined effects of formation and oxidation determine the final soot. To gain the best trade-off of NOx and soot, compared with single injection, for the three multiple injections, the lowest soot emissions are gained at post-injection proportions of 15% and post-injection timings of 25°, 30°, and 35° CA ATDC, with soot reductions of 26.7%, −34.5%, and −112.8%, and NOx reductions of 5.88%, 21.2%, and 40.3%, respectively, for 1main+1post, 2main+1post, and 3main+1post injections.
Keywords
Introduction
The diesel engine has been widely used and studied due to its high thermal efficiency and low carbon dioxide (CO2) emission. However, the nitrogen oxides (NOx) and soot trade-off is a serious challenge for researchers in a direct-injection diesel engine. With increasingly stringent emission regulations, researchers have to adopt a series of techniques to reduce the exhaust emissions. 1 Alternatively to the aftertreatment systems development, numerous advanced injection and combustion strategies have been suggested for compression ignition engines to meet the stringent emission regulations with minimal sacrifice in the fuel economy. The Hountalas’s research 2 shows that post injection can significantly increase the soot oxidation rate in the late stage of combustion, promote diffusion combustion, and reduce the soot. However, the result is conditional, which is related to the post injection timing (or main-post injection dwell) and proportion. In recent years, a number of studies has been widely conducted on multiple injection strategy.
In a heavy-duty diesel engine, the effects of injection strategies on emissions were investigated by many researchers,3–11 it was found that small post injection mass with a short main-post injection interval produces less smoke; 6 dramatic soot reduction without a NOx penalty can be achieved by injecting enough fuel in post injection at an appropriate EGR rate; 8 there is a trade-off relation between carbon monoxide (CO), hydrocarbon (HC), and NOx emissions with crank angle intervals increasing, lowest particulate matter emissions appear at middle post injection timing; 9 proper post injection may help in soot oxidation; 10 more CO formation and less HC emission are obtained during multiple injection combustion process, and simultaneous reductions of 58.7% and 25%, respectively, for NOx and soot can be achieved. 11
A new concept of variable injection pressure of multiple injections was proposed by Poorghasemi et al., 12 and it was found that increasing post injection pressure can reduce the soot emission significantly while the NO emission is in control. Double and single Wiebe function for multiple injection mode diesel engine combustion modeling was developed and validated by Maroteaux et al. 13 Benajes et al. 14 found that in the lowest swirl ratio case, a suitable injection strategy based on multiple injections provides similar results of soot oxidation process (and therefore, the emissions) as high swirl ratio case.
To extend operation to high load working range, a control concept of high density-low temperature diesel combustion (HD-LTC) 15 was proposed in the authors’ former work. It relied on the high charge density by employment of 2-stage supercharging rising boost pressure up to 0.4–0.5 MPa, on moderate low oxygen concentration by using EGR and on low compression temperature by retarding intake valve closing timing (IVCT). According to the authors’ previous study, 15 without using aftertreatment devices, the lowest NOx emissions obtained are about 1.21 g/kWh, below the Euro 5 standard (2 g/kWh); the lowest soot emission obtained is about 0.003 g/kWh, below the Euro 5 standard (0.02 g/kWh). The Euro 6 emission standards can be realized by advanced in-cylinder purification measures combined with aftertreatment devices. However, the improvement of in-cylinder purification measures helps to relieve the pressure of aftertreatment. And Liu et al. 16 also found that at indicated mean effective pressure (IMEP) of about 1.1 MPa, using “main-post injection” strategy can reduce soot emissions substantially and reduce NOx emissions slightly with optimized post-injection timing and portion.
However, for HD-LTC at high load and low engine speed, the injection duration is shortened, and the NOx emissions are worsened. 17 In order to solve this problem, in this paper the authors innovatively proposed a multiple injection strategy after the top dead center (TDC), which is expected to reduce NOx emissions, but its effects on soot emissions need to be further studied. As a result, influence of injection strategy on the combustion and emissions at high load and constant low speed without aftertreatment system is studied experimentally and numerically in this paper. Due to the high pressure at TDC caused by boost and IVCT, the pilot injection before TDC will burn before TDC and further increase the pressure at TDC, influencing the maximum in-cylinder pressure limit, as a result, the multiple injection mode in this paper only refers to main injection and post injection after TDC, not involving pilot injection before TDC.
Experimental set-ups and CFD model
Experimental set-ups
The engine used in the investigation is a single-cylinder engine modified from a heavy duty six-cylinder engine. The schematic diagram of the test engine and the experimental set-ups are shown in Figure 1. 18 The IVCT is adjusted by the variable valve timing system. Injection strategies (including the fuel injection times, timing, mass, etc.) can be adjusted randomly by the electronically controlled high-pressure common-rail fuel supply system. The Horiba 7100 gas analyzer is used to measure engine-out emissions including NOx et al. The AVL 415 smoke meter is used to measure soot emission. The important engine data and injection system information are given in Table 1. Table 2 shows the parameters which were fixed for all injection cases.
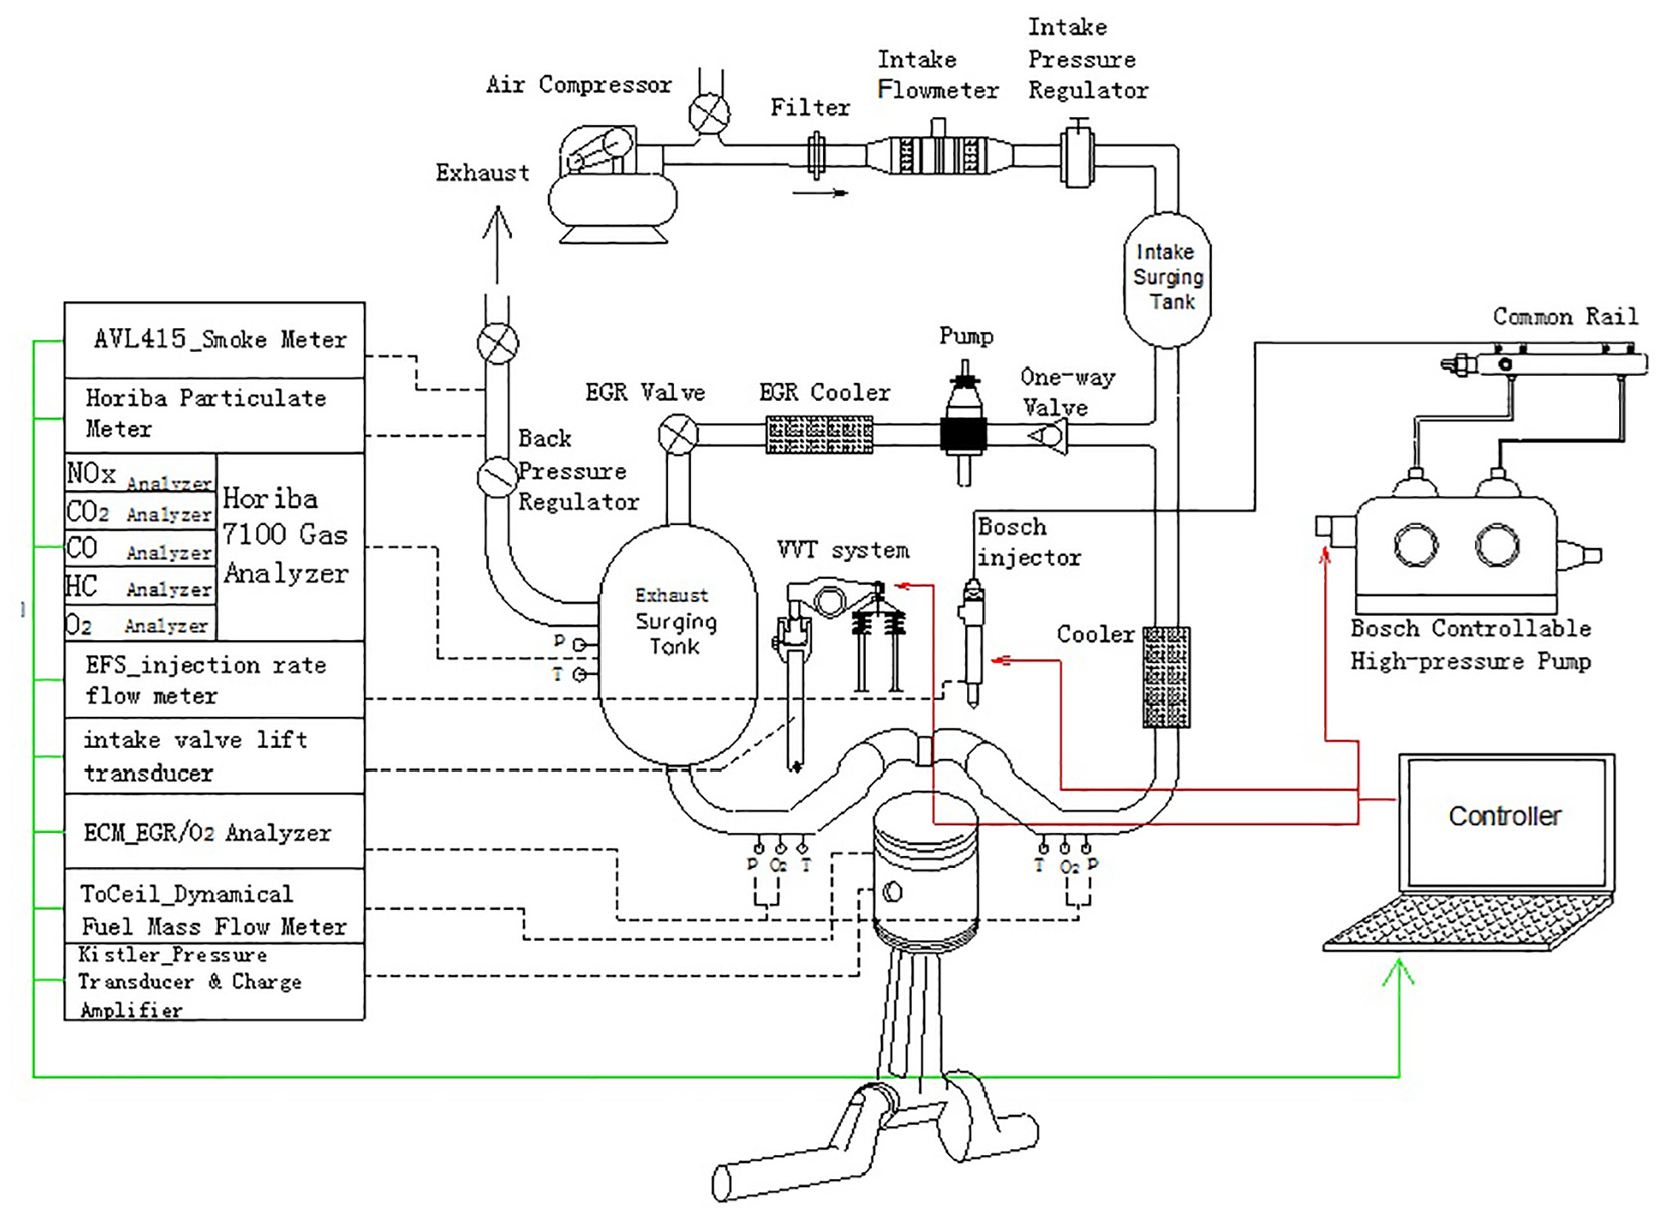
Schematic of experimental equipment. 18
Engine specification and operating parameters.

Computational conditions for studied cases.

The gross indicated thermal efficiency (ITEg) 19 is defined as
in which, Wg is gross indicated work per cycle, work delivered to the piston over the compression and expansion stroke only. Qfuel is the total fuel heat. mf is the total mass of fuel inducted per cycle. LHV is the low heat value of the fuel used in this paper, is 42,652–kJ/kg.
The combustion efficiency (ηc) 19 is defined as
in which, Q is the actual heat which the fuel is released.
CFD model set-ups and verification
Simulations were performed with CFD software Fire. The sub-models applied in the calculation are shown in Table 3. The K-zeta-f turbulence model was applied to model turbulent mixing. The KHRT 20 model was applied to simulate diesel spray break-up process. The Bai and Gosman 21 model was applied to simulate droplet-wall interactions. Furthermore, the double-delay autoignition model 22 was used to model diesel autoignition. The combustion model was the extended coherent flame model in three zones (ECFM-3Z) 23 which offers an additional level of refinement and simulates subgrid turbulent mixing between air and the fuel. The extended Zeldovich mechanism of NOx 24 was introduced. Both the thermal NO and the prompt NO mechanisms were considered. The kinetic model 25 was employed for soot modeling.
Submodels used in the calculations.

All the model constants for spray, combustion and emissions prediction remain unchanged for all the cases. Since the diesel injector has eight equally spaced nozzle holes, a sector mesh with an eighth of the full geometry was used to model one spray plume, as shown in Figure 2. The calculation starts from intake valve closing timing (−90° CA ATDC) and ends at exhaust valve opening timing (126° CA ATDC).

The computational mesh at TDC.
Figures 3 and 4 show comparisons of the calculated and measured in-cylinder pressure (Pcyl), rate of heat release (ROHR), and emissions, respectively. As shown, the calculated Pcyl, ROHR, and emissions are in reasonable agreement with the measured ones, which illustrates that the combustion and emissions models chosen are suitable for the calculations in this paper. The major differences in Pcyl and ROHR, are due to the LHV of the fuel used in the simulation is a little higher than that of the one used in the experiment. The measured soot emissions and the calculated values are of the same order of magnitude.

Comparison of calculated and measured in-cylinder pressure and ROHR.

Comparison of calculated and measured NOx and soot emissions.
All the results discussed in the section “Results and discussion” are the computational results.
Results and discussion
The first multiple injection strategy: 1main+1post injections
Figure 5 shows the injection rate profile for the first multiple injection strategy: 1main+1post injections with varied post injection mass fraction (Frac-P) and fixed post injection timing (SOI-P). y1-(x)y2 represents y1% of fuel injected during one main injection pulse, y2% of fuel injected during the post injection pulse, x represents the SOI of the post injection pulse, x = 30, 35, 40, 45, 50, and 25° CA ATDC.

The injection rate profiles for 1main + 1post injection cases.
Figure 6 shows effect of SOI-P and Frac-P on the soot emissions, the ITEg and the combustion efficiency versus the NOx emissions trade-off for 1main+1post injections, compared with single injection. As shown, the NOx emissions using 1main+1post injections are in the range of 1.2–1.45 g/kWh, all lower than those using single injection. The ITEg and the combustion efficiency using 1main+1post injections are both slightly lower than those using single injection. For 1main+1post injections, with increasing Frac-P and fixed SOI-P, the NOx emissions, the ITEg and the combustion efficiency all reduce, while the soot emissions increase significantly. With retarding SOI-P and fixed Frac-P, the NOx emissions change slightly; the ITEg and the combustion efficiency both reduce, while the soot emissions increase dramatically. Generally, to reduce the soot and NOx emissions simultaneously to the greatest extent possible, the optimal case is the one with SOI-P of 30° CA ATDC and Frac-P of 15%, whose NOx and soot emissions decrease by 11.3% and 6.71%, respectively, compared with single injection.

Effect of SOI-P and Frac-P on (a) soot emissions, (b) ITEg, and (c) the combustion efficiency versus NOx emissions trade-off for 1main + 1post injections, compared with single injection.
When the SOI-P is further advanced from 30° CA ATDC to 25° CA ATDC with constant Frac-P as shown in Figure 7, the NOx emissions increase and the soot emissions decrease. When the SOI-P is 25° CA ATDC, the soot emissions first decrease and then increase with increasing Frac-P, and the valley bottom of soot emissions appears at the Frac-P of 15%. Overall, to reduce the soot emission to the greatest extent possible, the optimal case is the one with SOI-P of 25° CA ATDC and Frac-P of 15%, whose NOx and soot emissions decrease by 5.88% and 26.7%, respectively, compared with single injection. The possible reasons will be explained following.

Effect of Frac-P and SOI-P of 1main + 1post injections on soot versus NOx emissions trade-off.
Figure 8 shows Frac-P of 1main+1post injections on the cumulative heat released, the in-cylinder average temperature (T), NO and soot evolution histories with constant SOI-P of 25° CA ATDC, compared with single injection. As shown in Figure 8(a), for 1main+1post injections, the cumulative heat released and the T after the end of main injection are both lower than those of single injection, and the larger the Frac-P, the lower the cumulative heat released and the lower the T. As a result, when the injection mode is changed from single to 1main+1post injections, the NO emission decreases, and with increasing Frac-P, the NO emission decreases more significantly, as shown in Figure 8(b), despite the T of 1main+1post injections exceeds that of single injection after 30° CA ATDC.

Effect of Frac-P of 1main+1post injections on (a) accumulated heat released and T and (b) NO and soot evolution histories with constant SOI-P of 25° CA ATDC, compared with single injection.
As shown in Figure 8(b), when the injection mode is changed from single to 1main+1post injections, the net soot generation changes from single peak to double peaks, the first peak decreases dramatically, the larger the Frac-P, the lower the first peak. When the Frac-Ps are 10% and 15%, the second net soot generation peaks and the subsequent net soot productions are always lower than those of single injection, leading to the decrease of the final soot emissions; when the Frac-P is 20%, the net soot generation of post injection exceeds that of the single injection, resulting in a slight increase in the final soot emission, as also shown in Figure 7. Correspondingly, as shown in Figure 9, with increasing Frac-P, the soot concentration formed by main injection decreases at 25° CA ATDC, the soot formed by post injection increases dramatically at 30° CA ATDC. At 35° CA ATDC, the soot formed by both injections continues to decrease. At 50° CA ATDC, due to the optimized soot distribution with Frac-P of 15%, its soot oxidation rate is enhanced, leading to the lowest soot emission. In conclusion, proper Frac-P of 15% is beneficial to optimize the soot distribution formed by different injection pluses, helps to decrease the final soot emission.
Effect of Frac-P and SOI-P on soot concentration field using 1main + 1post injection strategy.
With constant Frac-P of 15%, effect of SOI-P of 1main+1post injections on combustion processes, NO and soot evolution histories is shown in Figure 10. As shown in Figure 10(a), with retarding SOI-P, the cumulative heat released and the peak T caused by the post injection are both delayed and reduced. As shown in Figure 10(b), with retarding SOI-P from 25° CA ATDC to 30° CA ATDC, the NO emission decreases significantly, however, with further retarding SOI-P, the NO emission changes slightly. The possible reason is that the decreased T caused by the delayed combustion phase due to the delayed SOI-P decreases the NO formation rate; the effect is getting smaller and smaller because the local temperature has reached the freezing temperature of NO. With retarding SOI-P, the peak net soot caused by post injection is delayed, and the final soot emission increases significantly because the decreased T caused by the retarded SOI-P is not conductive to the complete oxidation of soot formed previously.

Effect of SOI-P of 1main + 1post injections on (a) accumulated heat released and T and (b) NO and soot evolution histories with constant Frac-P of 15%.
The second multiple injection strategy: Splitting the main into two identical injections (2main+1post injections)
Figure 11 shows the injection rate profile for the second multiple injection strategy: splitting the main into two identical injections, 2main+1post injections with fixed main injection interval of 4° CA, varied Frac-P and fixed SOI-P. y1(4)y1-(x)y2 represents y1% of fuel injected in each main pulse, 4 crank angle degree dwell between the two adjacent main injection pulses, x represents the SOI of the post injection pulse and y2% of fuel in the post pulse. x = 30, 35, 40, 45, 50, and 25° CA ATDC.

The injection rate profiles for 2main + 1post injection cases.
Figure 12 shows effect of SOI-P and Frac-P on the soot emissions, the ITEg and the combustion efficiency versus the NOx emissions trade-off for 2main+1post injections. As shown, the NOx emissions of 2main+1post injections are in the range of 1.0–1.25 g/kWh, all much lower than those using single injection, and almost all lower than those using 1main+1post injections shown in Figure 6. The ITEg and the combustion efficiency using 2main+1post injections are both lower than those using single injection. With increasing Frac-P and constant SOI-P, the NOx emissions, the ITEg and the combustion efficiency all decrease. With retarding SOI-P and fixed Frac-P, the NOx emissions change slightly; the ITEg and the combustion efficiency both decrease. When the Frac-Ps are 10% and 15%, the soot emissions increase significantly with retarding SOI-P, and when the Frac-P is 20%, the change of soot emissions is complex. As shown in Figure 12(a), when the SOI-P is 30° CA ATDC, with increasing Frac-P, the soot emissions first decrease and then increase, and the valley bottom of soot appears at the Frac-P of 15%. As a result, the optimal case of 2main+1post injection mode is the one with SOI-P of 30° CA ATDC and Frac-P of 15%, whose NOx emissions decrease by 21.2%, soot emission increases by 34.5%, compared with single injection. The possible reasons will be explained following.

Effect of SOI-P and Frac-P on (a) soot emissions, (b) ITEg, and (c) the combustion efficiency versus NOx emissions trade-off for 2main + 1post injection strategy, compared with single injection.
Figure 13 shows effect of Frac-P and SOI-P on soot concentration field using 2main+1post injection strategy. As shown, when the SOI-P is 30° CA ATDC, at 25° CA ATDC and 30° CA ATDC, with increasing Frac-P, the soot formed by main injection decreases. At 35° CA ATDC, with increasing Frac-P, the soot formed by post injection increases. At 40° CA ATDC, with Frac-P of 20%, the soot formed by post injection comes to the chamber wall, which is difficult for soot to be oxidized. As a result, under competition effects of formation and oxidation, the final soot emissions are the lowest with Frac-P of 15%. In conclusion, proper Frac-P of 15% is beneficial to optimize the soot distribution formed by different injection pluses, helps to decrease the final soot emission.

Effect of Frac-P and SOI-P on soot concentration field using 2main + 1post injection strategy.
When the SOI-P is further advanced from 30° CA ATDC to 25° CA ATDC with constant Frac-P as shown in Figure 14, the NOx and soot emissions both increase. This is because the main-post injection interval is too small, only 2.5–4° CA, the soot formed by the post injection is not separated from that of the main injection, which leads to an increase in the net production of soot in the anoxic zone. As shown in Figure 13, at 30° CA ATDC, the soot formed by post injection also comes to the chamber wall and into the soot zone formed by main injection, which is not beneficial to entrain fresh air and oxidize the soot formed. Thus, enough main-post injection interval is needed to ensure post and main injections are relatively independent to entrain more fresh air to decrease the final soot emission.
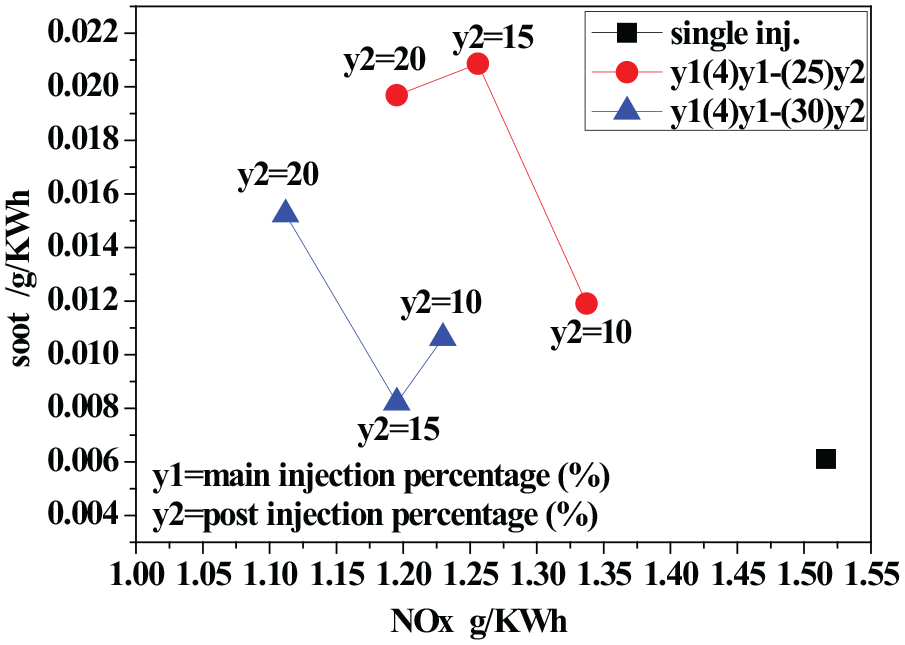
Effect of SOI-P and Frac-P of 2main + 1post injections on soot versus NOx emissions trade-off.
With constant Frac-P of 15%, effect of SOI-P of 2main+1post injections on combustion processes, NO and soot evolution histories are shown in Figure 15. As shown in Figure 15(a), compared with single injection, the cumulative heat released of the 2main+1post injections is retarded and reduced; the T of the 2main+1post injections before post injection is dramatically decreased, however, the peak T formed by the post injection exceeds the T of the single injection. With retarding SOI-P, the cumulative heat released and the peak T caused by the post injection are both retarded and decreased. As shown in Figure 15(b), compared with single injection, the NO emission of the 2main+1post injections significantly reduces due to the decrease of the T before post injection, while the contribution of the T after post injection to the NO formation is much smaller due to the late combustion phase. And the NO emission changes slightly with retarding SOI-P after 30° CA ATDC. As shown in Figure 15(c), as the SOI-P is retarded after 30° CA ATDC, the soot emission is gradually worsened, because the low T caused by the retarded SOI-P is not high enough to oxidize the soot formed completely, only left to the exhaust, which verifies the results in Figure 12(a). To sum up, the optimal case of 2main+1post injections is the one with SOI-P of 30° CA ATDC and Frac-P of 15%.
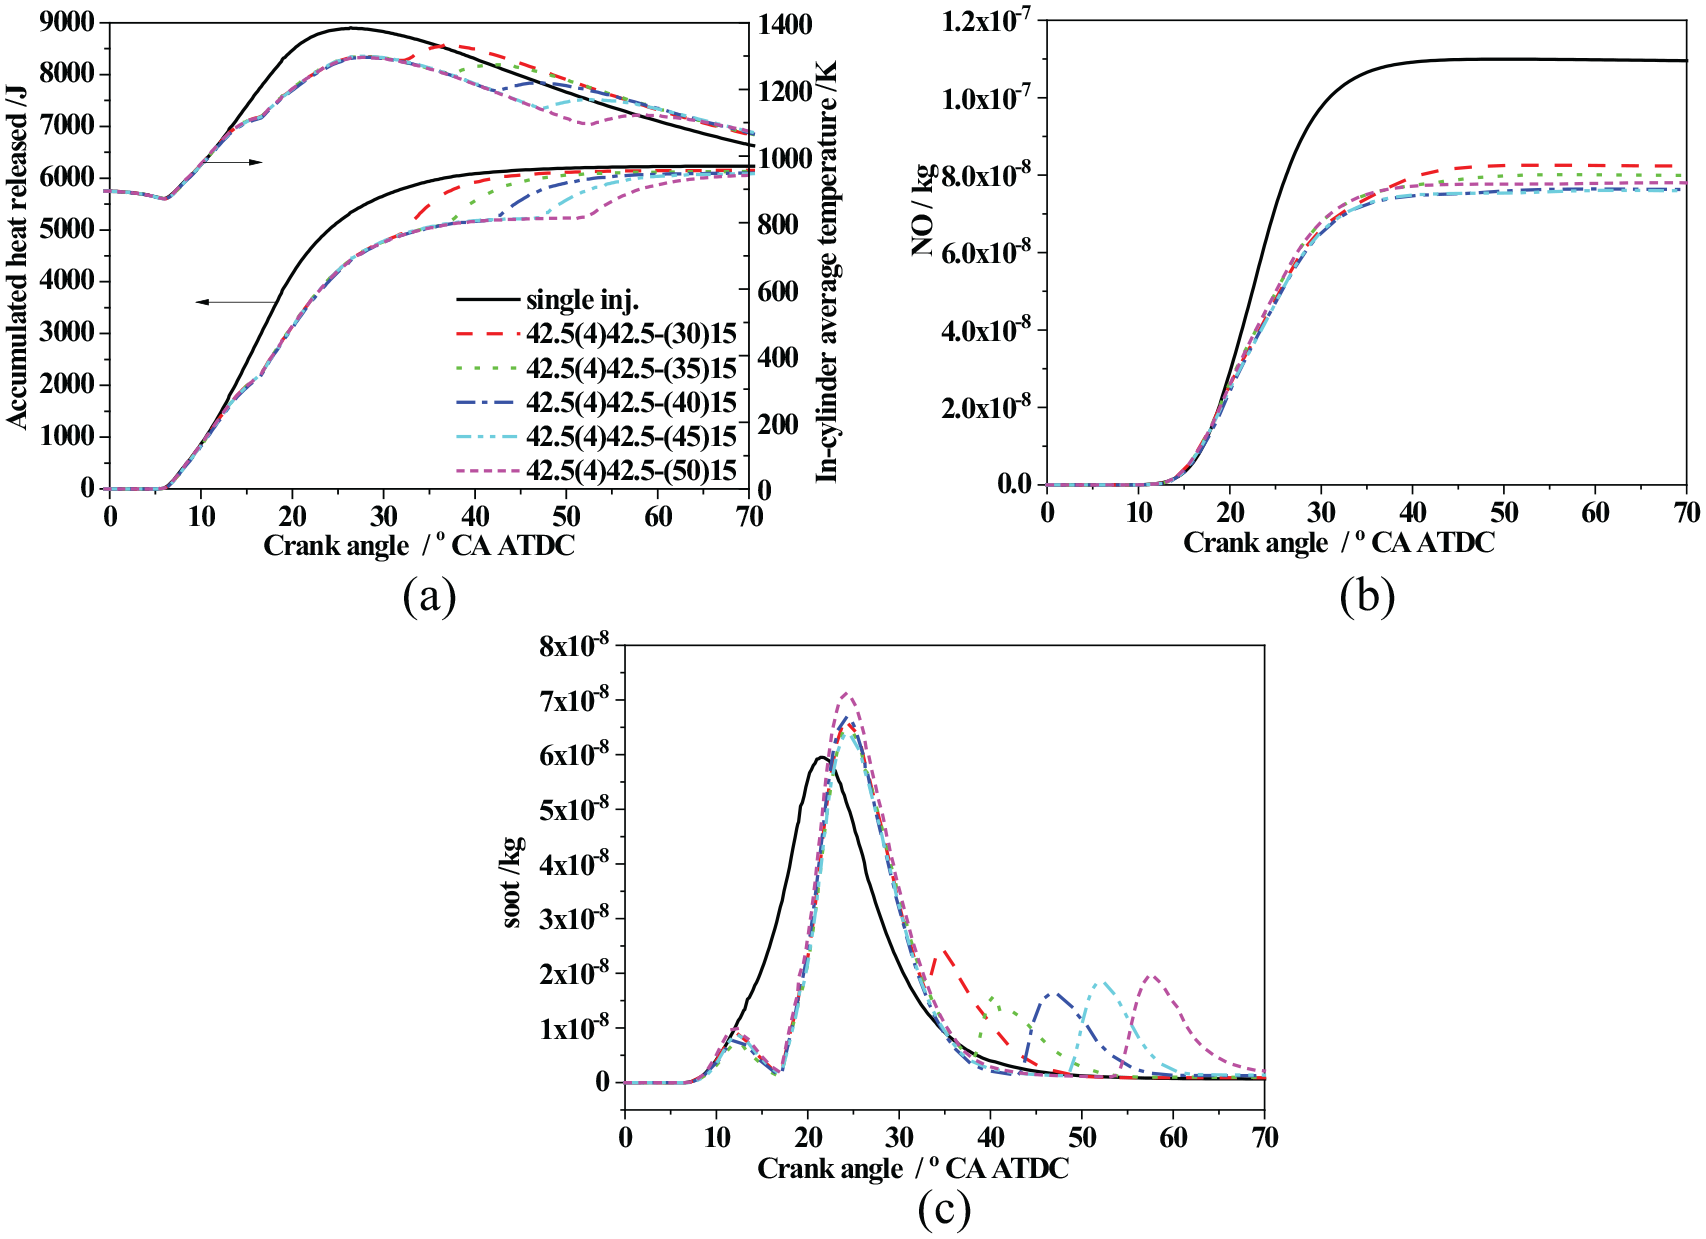
Effect of SOI-P of 2main + 1post injection strategy on (a) accumulated heat released and T, (b) NO, and (c) soot evolution histories with constant Frac-P of 15%, compared with single injection.
The third multiple injection strategy: Splitting the main into three identical injections (3main+1post injections)
Figure 16 shows the injection rate profile for the third multiple injection strategy: splitting the main into three identical injections, 3main+1post injections with varied Frac-P and fixed SOI-P. y1(4)y1(4)y1-(x)y2 represents y1% fuel injected in each main pulse, 4° CA dwell between the two adjacent main injection pulses, x represents the SOI of the post injection pulse and y2% fuel in the post pulse. x = 30, 35, 40, 45, and 50° CA ATDC. As seen from Figure 16, the end of main injection is already beyond 25° CA ATDC, as a result, the SOI-P cannot take 25° CA ATDC.

The injection rate profiles for 3main + 1post injection cases.
Figure 17 shows effect of SOI-P and Frac-P on the soot emissions, the ITEg and the combustion efficiency versus the NOx emissions trade-off for 3main+1post injections. As presented, the NOx emissions using 3main+1post injections are in the range of 0.8–1.0 g/kWh, all much lower than those using single, 1main+1post, and 2main+1post injections, shown previously; so as the ITEg and the combustion efficiency. For 3main+1post injections, with retarding SOI-P and fixed Frac-P, the NOx emissions decrease slightly, the ITEg and the combustion efficiency both decrease, the soot emissions first decrease and then increase, forming a “V” type distribution versus the NOx emissions, and the valley bottom of soot appears at the SOI-P of 35° CA ATDC. With increasing Frac-P and fixed SOI-P, the NOx emissions, the ITEg and the combustion efficiency all decrease. Generally, the soot emission is lowest with SOI-P of 35° CA ATDC and Frac-P of 15%, which is the optimal case. Its NOx emissions decrease by 40.3%, soot emission increases by 112.8%, compared with single injection.

Effect of SOI-P and Frac-P on (a) soot emissions, (b) ITEg, and (c) the combustion efficiency versus NOx emissions trade-off for 3main + 1post injections, compared with single injection.
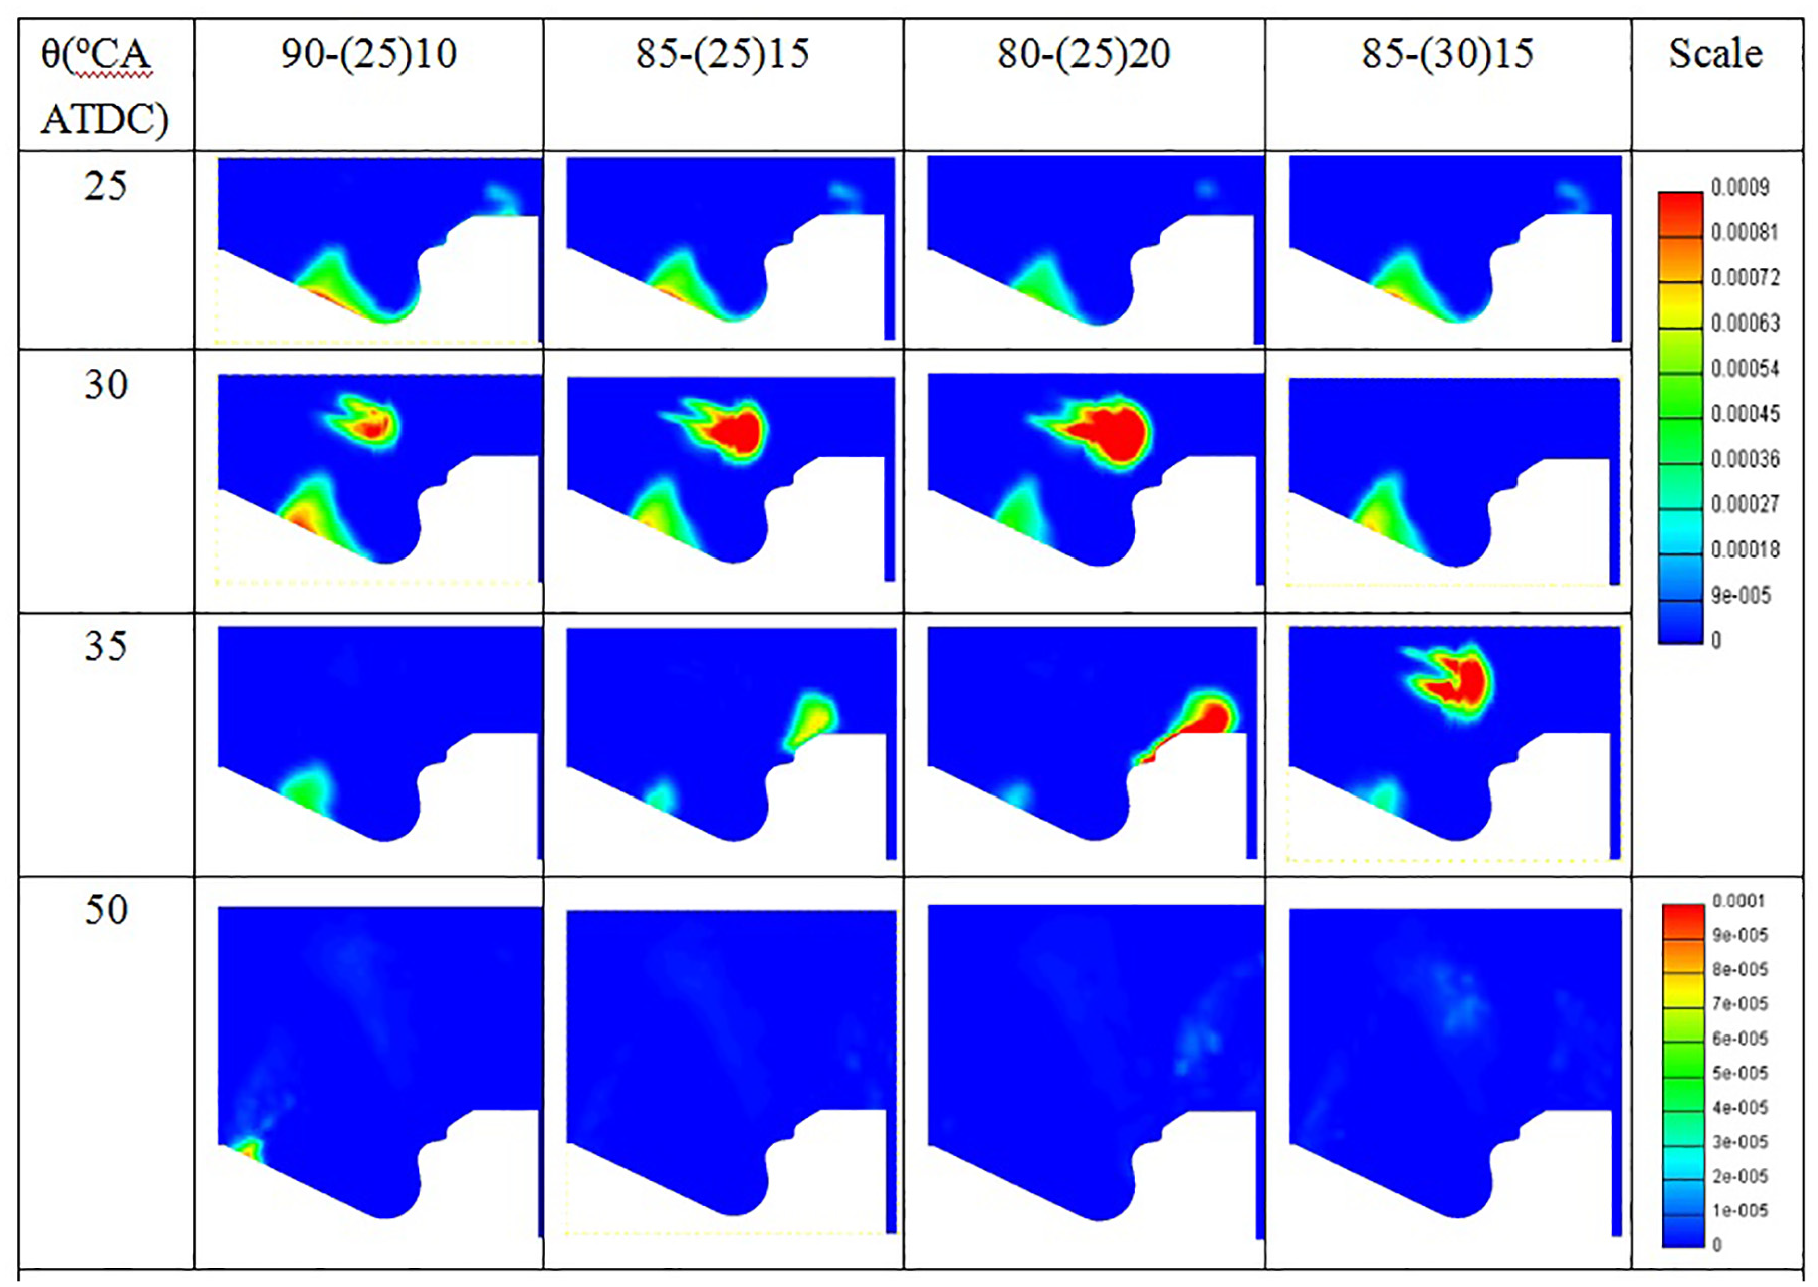
As already shown in Figure 17(a), with increasing Frac-P but constant SOI-P of 35° CA ATDC, the soot emission first decreases and then increase. As shown in Figure 18 of the corresponding soot concentration field, with increasing Frac-P, at 30° CA ATDC and 35° CA ATDC, the rich soot concentration formed by main injection reaches the chamber wall and its amount decreases; at 40° CA ATDC, the soot amount formed by post injection increases. Under combined effects of formation and oxidation, the final soot is lowest with Frac-P of 15%. In conclusion, proper Frac-P of 15% is beneficial to optimize the soot distribution formed by different injection pluses, helps to decrease the final soot emission.

Effect of Frac-P on soot concentration field distribution using 3main + 1post injection strategy compared with single injection.
With constant Frac-P of 15%, effect of SOI-P of 3main+1post injections on combustion processes, NO and soot evolution histories is shown in Figure 19. As shown in Figure 19(a), compared with single injection, the T before post injection is dramatically decreased; the accumulated heat released and the peak T are both retarded and decreased using 3main+1post injections, despite the T formed by post injection exceeds the T of the single injection later. With retarding SOI-P, the accumulated heat released and the peak T are both retarded and decreased. As a result, as shown in Figure 19(b), compared with single injection, the NO emission of the 3main+1post injections is dramatically reduced; with retarding SOI-P, the NO emission decreases slightly.
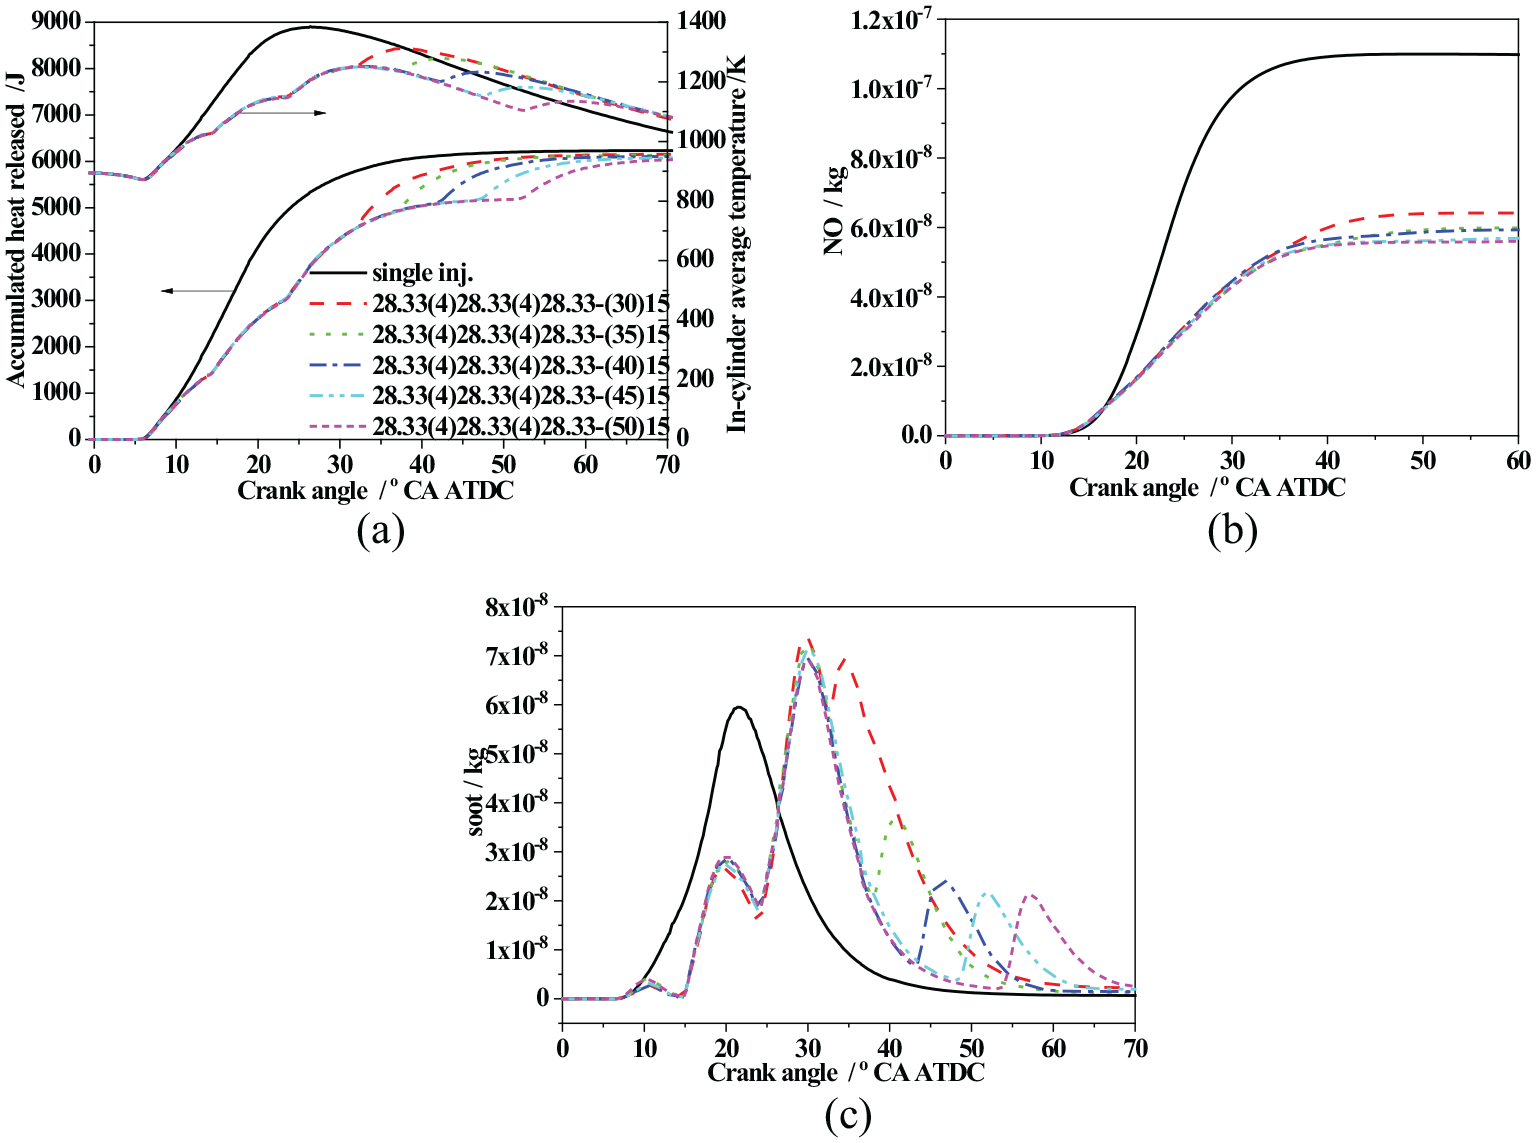
Effect of SOI-P of 3main + 1post injection strategy on (a) accumulated heat released and T, (b) NO, and (c) soot evolution histories with constant Frac-P of 15%, compared with single injection.
As shown in Figure 19(c), compared with single injection, the last soot peak formed by the post injection is decreased with retarding SOI-P. Especially, when the SOI-P is 30° CA ATDC, due to the too short main-post injection interval, only 2.5–4° CA, the soot peak generated by post injection is very high and its final soot emission is higher than that of 35° CA ATDC. In conclusion, enough main-post injection interval is needed to ensure post and main injections are relatively independent to entrain more fresh air to decrease the final soot emission. With retarding SOI-P after 35° CA ATDC, the T is lower and the oxidation of soot is restricted. Under combined effects of formation and oxidation, the soot emission first decreases and then increase with retarding SOI-P, and the lowest soot emission is gained with SOI-P of 35° CA ATDC. In conclusion, over retarded SOI-P tends to increase the soot emission due to the lower in-cylinder temperature. The combined effects of formation and oxidation determine the final soot emission.
Conclusion
Experiments and simulations were used to study effects of the main-injection mode (times), the post-injection proportion and timing on the high density-low temperature combustion and emissions in a heavy-duty diesel engine at high load and constant low speed. The following conclusions can be reached:
The NOx emissions of 1main+1post, 2main+1post, and 3main+1post injections are all lower than those of single injection; the higher the number of main-injection pluses, the lower the NOx emissions. However, the ITEg and the combustion efficiency of the three multiple injections are lower than those of single injection.
For fixed multiple injections, with increasing Frac-P and constant SOI-P, the NOx emissions, the ITEg and the combustion efficiency all reduce. With retarding SOI-P and constant Frac-P, the NOx emissions change slightly; the ITEg and the combustion efficiency both reduce.
Enough main-post injection interval is needed to ensure post and main injections are relatively independent to entrain more fresh air to decrease the final soot emission. Over retarded post-injection timing tends to increase the soot emission due to the lower in-cylinder temperature. The combined effects of formation and oxidation determine the final soot emission. Proper post-injection proportions of 15% is beneficial to optimize the soot distribution formed by different injection pluses, helps to decrease the final soot emission.
To gain the best trade-off of NOx and soot, compared with single injection, for the three multiple injections, the lowest soot emissions are gained at post-injection proportions of 15% and post-injection timings of 25, 30, and 35° CA ATDC, with soot reductions of 26.7%, −34.5%, and −112.8%, and NOx reductions of 5.88%, 21.2%, and 40.3%, respectively, for 1main+1post, 2main+1post, and 3main+1post injections.
Footnotes
Appendix
Handling Editor: James Baldwin
Declaration of conflicting interests
The author(s) declared no potential conflicts of interest with respect to the research, authorship, and/or publication of this article.
Funding
The author(s) disclosed receipt of the following financial support for the research, authorship, and/or publication of this article: This work was supported by the Natural Foundation of China through its youth project funding (grant number 51806097) and the Open Subject of State Key Laboratory of Engines of Tianjin University (grant number K2018-08).