
Abstract
Fault diagnosis of rolling bearings is of great significance to ensure the production efficiency of rotating machinery as well as personal safety. In recent years, machine learning has shown great potential in signal feature extraction and pattern recognition, and it is superior to traditional fault diagnosis methods in dealing with big data. However, most of the current intelligent diagnostic methods are based on the ideal conditions that bearing data set and label information are sufficient, which are often not always available in engineering practice. In response to this problem, this paper proposes to use probabilistic mixture model (PMM) to approximate the data distribution of the bearing signal, and then use Markov Chain Monte Carlo (MCMC) algorithm to sample the probabilistic model to expand the fault data set. In addition, Semi-supervised Ladder Network (SSLN) can achieve the effect of supervised learning classifier with only a few labeled samples. Based on Case Western Reserve University (CWRU) Bearing Database, the recognition accuracy of the proposed PMM-SSLN model can reach 99.5%, and the experimental results show that this model is applicable to the case where both bearing data set and label information are insufficient.
Introduction
Rolling bearings are the most important and most vulnerable component of the rotating machinery and widely used in machinery industry. 1 Thus, fault diagnosis of rolling bearings not only improves the production efficiency and the service life of the equipment, but also can timely detect and troubleshoot faults to prevent serious accidents. With the rapid development of the industrial Internet, the scale of the mechanical equipment group is expanding, and the monitoring points of the monitoring system are increasing, which makes the monitoring data in the whole field of mechanical fault diagnosis increase explosively. Efficiently mining of the rich information contained in big data has become the focus and challenge of the research. 2
The traditional signal processing methods of rolling bearing include time domain analysis, frequency domain analysis and time-frequency domain analysis. Doguer and Strackeljan 3 investigated an approach that suitable time domain features are selected by the higher derivatives of the time acceleration signal and some parameters characterizing the randomness of the peak positions. Frequency domain analysis converts the signal from the time domain to the frequency domain, which gives more accurate frequency components of the signal components. Zhang et al. 4 presents an improved local cepstrum method to analyze vibration signals of rolling element bearing, and the method has strong ability to resist noise and detect the early fault. The frequency domain analysis shows great limitations in the face of non-stationary signals. In contrast, time-frequency analysis can describe the time-varying frequency characteristics of the signal. Wavelet trans-form (WT) can automatically adapt to the requirements of time-frequency signal analysis, and the time-frequency analysis method based on WT has proved its effectiveness in the face of non-stationary signals. 5
Traditional time-frequency analysis techniques rely on complex signal processing techniques and fault diagnosis experience. In addition, the increasing amount of data brings the difficulties and challenges of fault diagnosis. In recent years, machine learning has become a powerful tool for big data analysis and is widely used in machinery fault detection and diagnosis. 6 Jian et al. 7 proposed a one-dimensional fusion neural network (OFNN), realizing the identification of bearing health under different load conditions. Liu et al. 8 presented a novel bearing fault diagnosis with RNN in the form of an autoencoder, and this method has high robustness and classification accuracy. Haidong S et al. 9 combined deep wavelet auto-encoder (DWAE) with extreme learning machine (ELM), diagnostic accuracy can reach 95% through experiments on CWRU motor bearing database.
However, these studies are based on the assumption that there is sufficient valid data and label information, which is inconsistent with the characteristics of monitoring data in engineering practice. The following two weaknesses are as follows:
In engineering practice, rolling bearings are in the process of normal operation for a long time, so the scarce fault data are inherent features in the field of rolling bearing fault diagnosis. However, it is necessary for machine learning to have sufficient samples for each label. 10
The equipment accumulates massive data during long-term operation, but only a few data are known for their health status. But supervised learning requires a large amount of labeled data, which is likely to waste useful information of the unlabeled ones. In the face of such massive unlabeled data, manual labeling is time-consuming.
To overcome the above weaknesses, this paper pro-poses PMM-SSLN framework based on Probability Mixture Model and Semi-supervised Ladder Network. This paper takes into account the data characteristics of rolling bearings in engineering practice, the dataset is expanded through sampling the probability model established by the bearing data, and then uses SSLN for training.
PMM is one of the most commonly used tools for clustering and density estimation,11–13 which can approximate any unknown distribution with multiple components. No matter how complicated the data distribution is, the local characteristics of the data can be described by adding components, the component here is an independent probability distribution. Compared with a single model, it is more flexible and adaptable. SSLN is a pure semi-supervised learning method proposed by Ramus et al.14,15 Based on the traditional unsupervised learning network structure, horizontal lateral connections are added between the encoder and decoder of each layer to achieve compatibility with supervised learning. 16 It can greatly reduce the cost of labeling bearing samples, and use unlabeled data to improve the performance of the classifier.
The contributions of the paper lies in the following two aspects:
PMM is applied to approximate the data distribution of complex bearing signal, and then MCMC algorithm is adopted to sample the model. In this way, large amounts of fake data with the same distribution can be generated to assist in training the neural network. This method can provide a new idea for handling small sample size problem in the intelligent diagnosis of rolling bearings.
This paper uses SSLN that is pure semi-supervised learning to train the expanded data set. This method can fully exploit the information hidden by the unlabeled data and can achieve the effect of a supervised learning classifier with only a small amount of labeled data. This solution improves the utilization of bearing signals, and thereby improve the accuracy of diagnosis.
The reminder of this paper is organized as follows: the mathematical model of monitored data is introduced in section “Mathematical model of monitored data,” estimation and data reproduction from the probabilistic model is introduced in section “Estimation and data reproduction from PMM”; section “Fault diagnosis using semi-supervised ladder network” introduces fault diagnosis using SSLN; section “Simulations and experiments” introduces simulations and experiments; section “PMM-SSLN model experiment setup and results” and “Conclusion” gives the conclusions and proposes open questions.
Mathematical model of monitored data
Probabilistic model of observed data
The collected data from rolling bearings including noise can be regarded as stochastic signal, which cannot be described by a fixed mathematical relationship. Each observation only represents one of its possible results in the variation range, and the variation is subject to statistical law. As a statistic point of view, the data can be considered to be a random variable which obeys a certain probability distribution.
Figure 1 shows the scatter diagram of

The scatter diagram of the bearing data in the time domain.
PMM is a linear weighted combination of a finite single density function. It can be generalized to the following form:
Suppose the bearing data set

Where
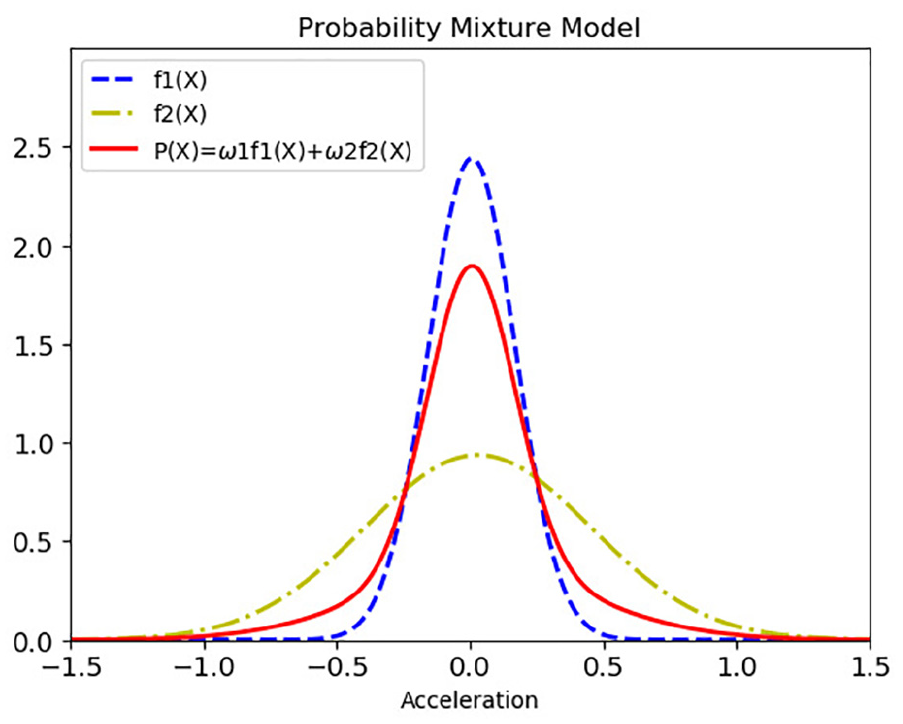
A schematic diagram of PMM based on the bearing data.
Research routine
The rolling bearing fault diagnosis method based on PMM-SSLN Model consists of three steps:
Data acquisition and augmentation of the bearing signal model:
First collect bearing signals from the experimental device, and use PMM to fit the distribution of bearing data, in order to establish the probability models for bearing data under different working conditions. Then sample the probabilistic models by MCMC algorithm to ensure that each category of bearing data is sufficient.
Model training with Semi-supervised Ladder Network:
After obtaining sufficient training data, SSLN is trained by using small amounts of labeled data and massive unlabeled data. Complete the training after reaching the set number of iterations.
Fault identification:
Input the data set to be tested and finally output the diagnosis result.
The specific process is shown in Figure 3.
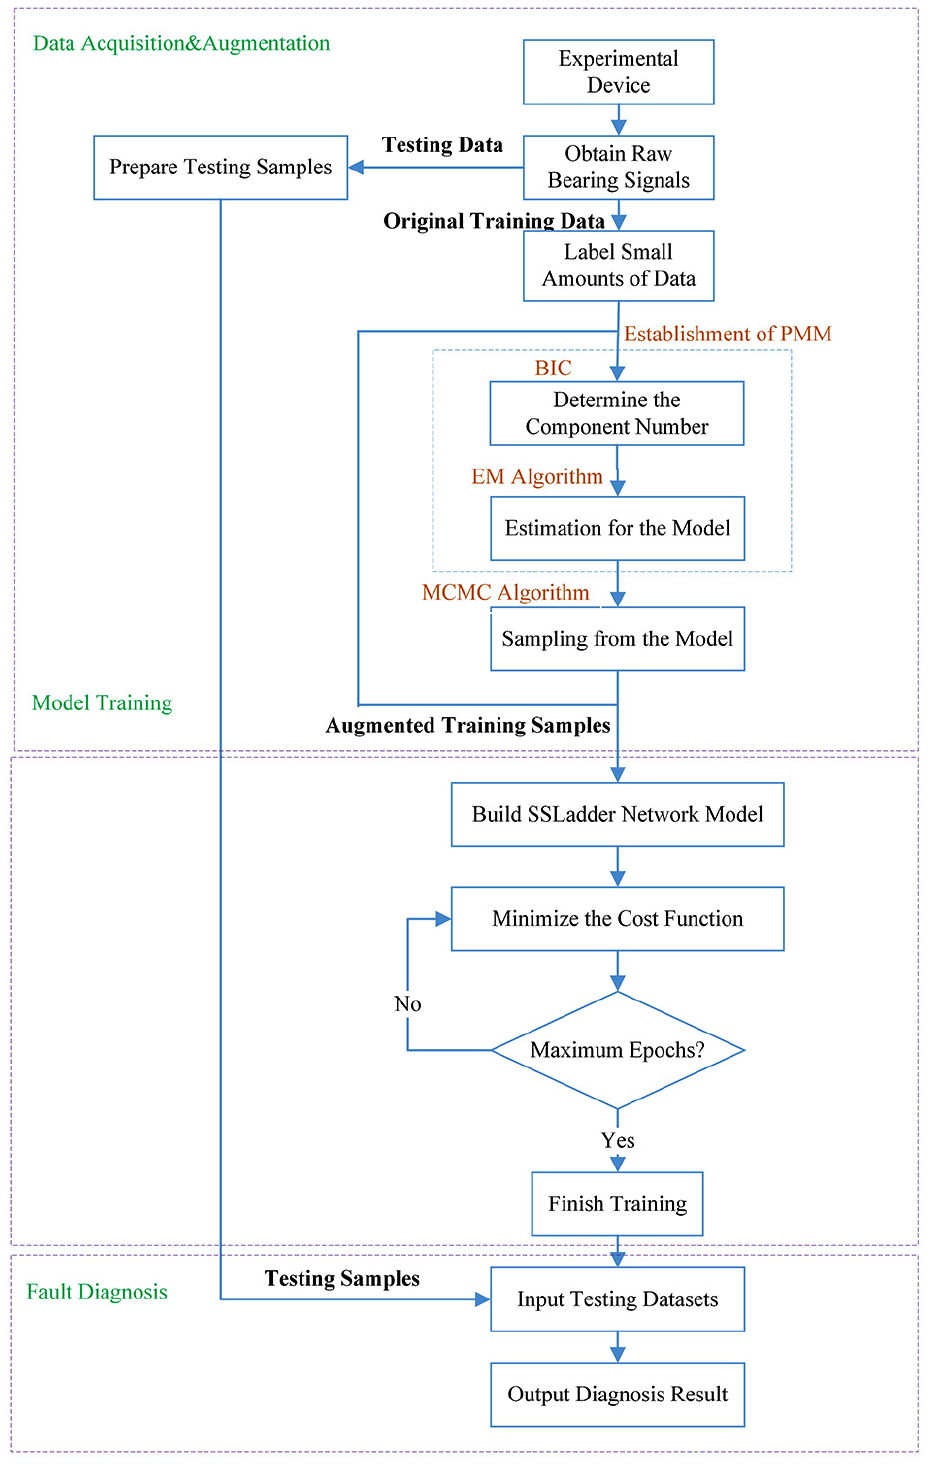
The flow chart of the proposed PMM-SSLN Model.
Estimation and data reproduction from PMM
Information criterions for determining the component number
The first parameter that needs to be estimated is the number of components


where
It can be seen from equations (2) and (3) that the preferred model should be the one with the smallest values of AIC and BIC. The distinction between the two kinds of information criteria lies in the different penalty factors. The penalty factor of BIC takes into account the number of samples to prevent the model from over-fitting due to the large amount of samples. With the large sample size (
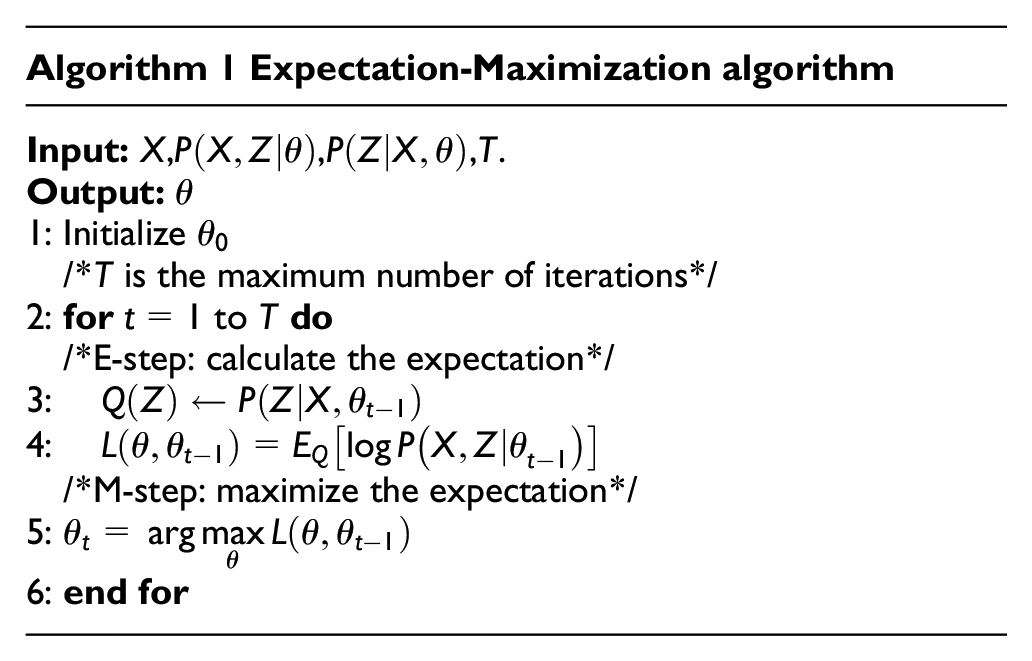
Expectation-maximization algorithm for parameter estimation
After determining the number of components
Expectation-Maximization Algorithm
20
is a method to find the maximum likelihood function of the model with parameters. For the bearing data set

The purpose of EM algorithm is to find the maximum likelihood solution of equation (4). Introduce the hidden distribution


Where

It can be proved that the likelihood function is monotonically increasing, that is, EM algorithm will finally converges to its maximum value. This maximum is the parameter estimation of PMM. In this way, the probability density function of the bearing data is obtained, and more data can be generated for data augmentation by means of the corresponding sampling method. The pseudo code of EM algorithm is as follows:
MCMC algorithm for reproduction of bearing data
The bearing data generation process is a mechanical discrete event system, and it can be considered as the process of sampling the established distribution model. Expanding the training data set by sampling has the advantages of easy implementation and low cost. This paper attempts to use the method of sampling PMM to improve the learning performance of deep learning networks. In order to sample on the specified probability distribution
The M-H algorithm introduces a transfer distribution

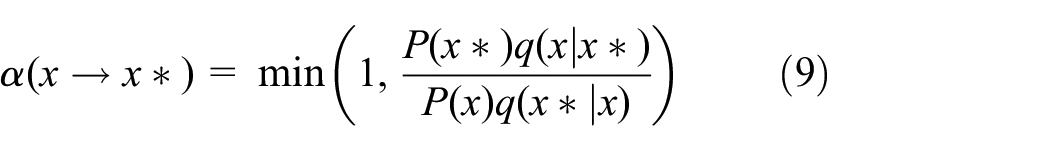
Where
It can be proved that the M-H algorithm satisfies the fine balance condition:

When the detailed balance condition is satisfied, it can be guaranteed that the stationary distribution that eventually converges is the target distribution

Fault diagnosis using semi-supervised ladder network
The proposed data augmentation method solves the problem of insufficient data sets, so that SSLN has sufficient training data. In addition, the health information of bearing data in engineering practice is also insufficient. In the face of these huge amounts of data, labeling the health information of the bearings takes time and effort. SSLN is a derivative algorithm of the autoencoder. It adopts the structure of ladder network to realize the compatibility of unsupervised learning and supervised learning. This semi-supervised learning method can make full use of a large amount of unlabeled data, which is consistent with the high labeling cost in the field of fault diagnosis. Therefore, this paper uses SSLN as a fault diagnosis model of bearing signals.
Structure of ladder network
Semi-supervised learning is essentially a combination of unsupervised learning and supervised learning. Unsuper-vised learning requires that all input information be reconstructed as much as possible. As shown in Figure 4, autoencoder network is a typical unsupervised learning method.
22
The compressed representation of input signal

Structural comparison of autoencoder and ladder network. Where “^” indicates the variable of the corrupted decoding process, and
Structure of SSLN
SSLN is a semi-supervised network that combines ladder network and supervised learning. Now suppose there are

A structural illustration of the L-layer ladder network. The corrupted encoding path shares the same mappings
In the corrupted encoding path, Gaussian random noise is added on each layer to enhance the robustness of the network. The output


Where

The decoding path uses the result of the encoding process to decode the unlabeled data. Due to the addition of the lateral connection, each hidden layer of the decoding path not only obtains the information of the previous layer, but also obtains the information of the corrupted encoding path in the same layer and restores the lost information. The specific expression is as follows:


Where
Except that no noise is added, the clean encoding path has the similar structure to the corrupted encoding path. The specific expression is thus:


The unsupervised denoising cost function


Where
On the basis of autoencoder, SSLN retains and improves the unsupervised cost. Thus the structural information can be extracted that comes from a large amount of unlabeled bearing data, which makes the decoding process more reconstructed. In addition, the addition of the supervised cost makes the network become a semi-supervised learning network and extract the features of the labeled samples. What’s more, the introduction of lateral connections improves the classification effect of the upper layer without reducing the reconstruction performance of the decoder. These advantages ensure that SSLN has outstanding characteristics in the application of bearing fault diagnosis.
Simulations and experiments
Rolling bearing experimental data description
The experiment in this section uses the most commonly used vibration signal analysis method. The data comes from Case Western Reserve University Bearing Data Center. The experimental setup is shown in Figure 6. The test stand consists of a 2 hp motor, a torque transducer and a dynamometer. The bearing to be tested is a deep groove ball bearing, and electro-discharge machining (EDM) is used to set the faults on the inner ring, ball and outer ring of the bearing to be tested.

Case Western Reserve University bearing experimental device.
Single point faults are introduced into different components of the test bearing with fault diameters of 0.007, 0.014, 0.021, and 0.028 inches. The accelerometer is used to collect the rolling bearing at the driving end, and the sampling frequency is 12 kHz. Each bearing is tested under different loads (0, 1, 2, and 3 hp), and the motor speed changes between 1730 and 1797 rpm. In order to highlight the identification ability of the fault identification method, this section selects minor faults, that is, bearing data with a fault diameter of 0.007 inch. The experimental data set is shown in Table 1. The data set is divided into 4 categories and 16 sets of data. The data is processed so that the length of a single sample is 1024, and finally each group has 108 pieces of data. Each group of data is randomly divided into 81 training data and 27 testing data.
The CWRU rolling bearing dataset information.

SSLN experiment setup and results
The experiment in this section builds SSLN based on fully connected layer network. The dimension of each layer of the encoding path is set to [1024, 1000, 500, 250, 250, 100,4], and the weight of the unsupervised loss item of each layer is set to [1000, 10, 0.1, 0.1, 0.1, 0.1, 0.1]. The learning rate is set to 0.02, the batch size is set to 32, and the maximum number of iterations is set to 8000.
In the training set, 32 pieces of data are randomly selected and labeled, and the remaining 1264 pieces of data are regarded as unlabeled data. Each experiment has 32 pieces of labeled data and the same test set, and 0, 316, 632, 948, 1264 pieces of unlabeled data are added in order to train the model. The training results are shown in Figure 7. When there is no unlabeled data, the encoding path of SSLN is used for supervised learning with only 32 pieces of labeled data. The accuracy rate is only 25.9%, which is equivalent to the random probability. It can be seen that the lack of label samples has a great impact on the classification effect of supervised learning. This is because a large amount of unlabeled data cannot be used, resulting in a lack of data in the training set and over-fitting in neural network training.

Influence of the amount of unlabeled data on accuracy.
The accuracy rate of semi-supervised learning when adding unlabeled data has been significantly improved. In addition, the accuracy rate is gradually increasing after gradually increasing the number of unlabeled samples. It can be inferred that the increase in the number of unlabeled data helps to improve the accuracy of SSLN fault recognition. After adding all the unlabeled data, the accuracy rate finally reached 71.8%, but still could not achieve a high recognition rate. Limited by the size of the data set, the next section continue to expand the training set through data enhancement methods.
PMM-SSLN model experiment setup and results
Based on the previous section, this section designs PMM-SSLN model to improve the fault recognition accuracy of SSLN in the case of small data sets. This section takes the inner ring fault under no external load as an example. As shown in Figure 8, the frequency distribution histogram of the fault data can be obtained. It can be roughly seen from the figure that the data distribution is dense in the middle and sparse on both sides that is similar to the Gaussian distribution. However, it does not necessarily follow a single Gaussian distribution. This experiment selects one-dimensional Gaussian Mixture Model (GMM) for probabilistic modeling of bearing data. This means that each component in PMM represents the probability density function of the Gaussian distribution. Because of the large sample size, BIC criterion is used to determine the number of components. This not only ensures the accuracy of the model, but also makes the model have a certain generalization ability, which can predict the data that is not observed.

The frequency distribution histogram of the inner ring fault data.
It can be seen from Figure 9 that the value of BIC has a minimum value. After that, as the number of components increases, the BIC value slowly rises and eventually tends to be stable. It can be concluded that the fitting effect to the model reaches the best when

BIC for determining the number of GMM.

Comparison of the fitting effect between GSM and GMM.
After establishing GMM for the observed data, much pseudo data can be generated through M-H sampling. The acceptance rate of M-H sampling is relatively high, therefore it can converge to a stable distribution more quickly. These pseudo data can be considered to have a certain similarity and homology with the original data in terms of probability. The threshold value of the number of state transitions needs to be set to ensure that the distribution of output data has converged to a stable distribution, which is set to 100,000 here. The generated data is set to three times the original samples, and its frequency distribution histogram is shown in Figure 11. It can be seen that the generated data set can fit the distribution of the established GMM, which means the sampling data and the original data are very close in probability distribution.

GMM of the original data and histogram of the generating data.
Then the generated data is divided into three groups, and each group is corresponded to the original data one by one according to the size order. Moreover, the generated data has the same time label as the original data. This solution allows the generated data to retain the timing information of the original signal as much as possible. The comparison between the original signal and the generated signal in the time domain is shown in Figure 12.

Time domain diagram of the inner ring fault’s original signal (a) and generated signal (b).
Use the proposed data augmentation method to expand the bearing data in each state in Table 1 to 324 pieces, and eventually 16 × 324 pieces of 1024-dimensional bearing signals can be obtained. The labeled samples are the same as the previous experiment, and the rest are unlabeled data. SSLN is trained with the expanded training set, and the parameter settings of which are consistent with the previous section. In order to further prove the effectiveness of the PMM-SSLN model, Support Vector Machines (SVM) and Semi-supervised Support Vector Machines (S3VM) are introduced as comparison models. Meanwhile, the same expanded data set was used in experiment 3. Combining the experiments in the previous section, six comparative experiments can be listed as shown in Table 2.
Classification results of three methods in the CWRU bearing dataset.
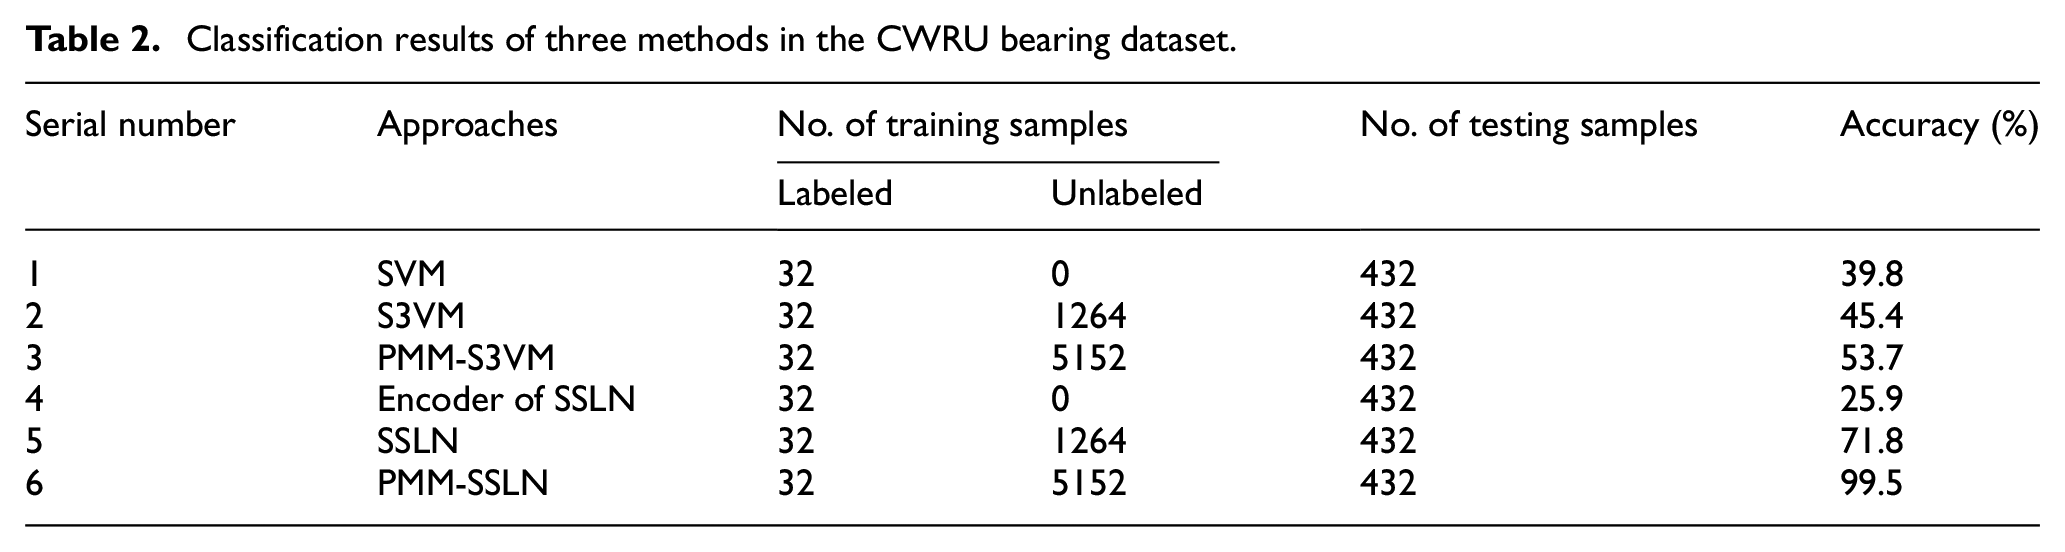
It can be seen that the recognition accuracy of PMM-SSLN model can eventually reach 99.5%, which is significantly improved compared to the other five methods. The SVM model which belongs to shallow learning models has a higher accuracy than the encoder of SSLN when using a small amount of label data. But when the size of the training data set increases, the diagnostic accuracy of the SSLN model is significantly improved compared to the SVM model. This proves that SSLN has advantages in extracting information from a large number of training samples, and the method of data enhancement can significantly improve the recognition accuracy of SSLN. Moreover, it is concluded that SSLN only requires few label data, but requires large amounts of unlabeled data for training. This is consistent with the fact that the health status of most bearing signals is unknown in practical engineering applications. Moreover, the proposed data enhancement method can ensure the sufficient of unlabeled data, and further improve the diagnostic ability of SSLN. It can be seen that PMM-SSLN model proposed in this paper can solve the problem of small data volume and scarcely labels in the fault diagnosis of rolling bearings.
Conclusion
This paper proposes an intelligent fault diagnosis method based on probabilistic mixture model and Semi-supervised Ladder Network. In the case of limited valid data, the probabilistic model of the corresponding bearing data can be established through PMM, and then the data augmentation can be performed through MCMC sampling. Due to the strong expressive ability of PMM and the fast training speed of EM algorithm, this method can quickly capture the empirical distribution of rolling bearing data under different complex working conditions. Furthermore, PMM has a good generalization ability, and will not harm the prediction of unobserved data caused by over-fitting. On the other hand, there is a problem that the labeling cost of rolling bearings is high in industrial applications. SSLN that has the feature extraction capability of unlabeled data requires small amounts of labeled data to train the model. Experimental results show that the PMM-SSLN model proposed in this paper can solve the problem of lack of valid data and label information in industrial applications, and the final accuracy rate reaches 99.5% in the CWRU bearing dataset. Our future work includes further improvement of the model to better solve the problem of data imbalance, and to realize the identification of compound faults of rolling bearings.
Footnotes
Handling Editor: James Baldwin
Declaration of conflicting interests
The author(s) declared no potential conflicts of interest with respect to the research, authorship, and/or publication of this article.
Funding
The author(s) disclosed receipt of the following financial support for the research, authorship, and/or publication of this article: Anhui Province Key Project (No. 18030901039, No. 201903c08020008, and No. 201903a05020064); Fundamental Research Funds for the Central Universities (Grant no. JZ2019YYPY0017, JZ2020YYPY0247)