
Abstract
The explosion of a building generates plenty of debris that flies far away. The flying debris is hazardous because it contains large amounts of kinetic energy. Therefore, determining the safety distance from the debris is essential. However, debris ricochet that collides onto the ground affects the safety distance because the ricochet phenomenon is influenced by the condition of the medium. In this study, experiments and finite element analysis were performed to investigate the ricochet based on the water content of sand. From a direct shear test, the internal friction angle and cohesion of sand were obtained based on the water content. The effects of internal friction angle and adhesion on the yield stress and ricochet were investigated. The results indicated that as the water content increased, the internal friction angle increased and then decreased, and the cohesion continued to decrease. The yield stress was proportional to the internal friction angle and inversely proportional to adhesion. Therefore, lower yield stress resulted in deeper penetration of debris, leading to higher energy loss, which increased the kinetic energy loss factor. Thus, the condition of the medium should be considered for setting a proper safety distance suitable for the surrounding environment of the building.
Introduction
When a building or ammunition blows up, a large amount of debris is generated and scattered in all directions. When the debris hits the ground, it stops, rolls, or bounces. The bounced debris increases the travel distance of the debris. The phenomenon in which an object bounces after colliding with a medium is called ricochet. The ricocheted building debris is hazardous when it collides with other objects because it has sizable kinetic energy. Therefore, to be safe from debris, the travel distance and safe distance of the debris must be accurately set. As ricochet is an essential factor that increases the travel distance of debris, it is necessary to have an accurate understanding to calculate the exact travel distance.
England was the first country to study and apply the ricochet phenomenon. The ricochet phenomenon was used to increase the range of a projectile in naval battles of the 16th and 17th centuries. In World War II, dams that were difficult to approach were detonated using ricocheting bombs.1,2 Since then, ricochet research has been conducted on water and solid mediums. Experiments were conducted to measure the critical angle at which the projectile ricochets were not generated, and empirical formulas were made to predict the critical angle according to various initial conditions of the projectile.3,4 Ricochet on solid mediums is more complicated than that on water. However, solids composed of small grains of different sizes, such as sand and mud, are not homogeneous. Hence, they tend to be different from ricochet on water.5,6
In forensic science, ricochet is an essential part because it is used to reconstruct the circumstances of a shooting by tracking the range and path of a ricocheted bullet.7,8 It is possible to find out where the ammunition was fired out by predicting the trajectory of the ricocheted bullet at the crime scene. The debris from building blasts have been studied through experiments and simulations9,10 to analyze a safe distance from the debris. The minimum inhabited building distance from debris in Europe is 400 m, 11 and that in the United States is 381 m. 12 The definition of the minimum inhabited building distance or minimum safety distance refers to the distance beyond which the blast can cause injuries, but not death. If there is a large amount of TNT, the debris can fly farther than 400 m and can cause great damage even beyond the minimum safety distance. Therefore, to avoid the risk of injury completely, and to predict the exact travel distance of debris, the exact initial conditions of the debris were studied according to the structure and material of the building along with the gunpowder condition. Ricochet affects the travel distance of debris. Ricochets are not only affected by the initial conditions of debris but also by the type, composition, and surrounding environment of the medium.13–15 However, while studying debris travel distance and explosion programs, ricochets are calculated using simple equations that do not consider the type and properties of the medium.9,16,17 Moreover, little research has been conducted on the travel distance of ricocheted debris, considering the type and condition of the medium. Therefore, the study of ricochet in various kinds and conditions of media is essential to analyze the accurate travel distance of the debris.
Therefore, in this study, water content of sand was selected as the main criteria to analyze the behavior of ricochets. The water content of sand varies depending on precipitation and humidity. The change in internal friction angle and cohesive strength according to the variation in water content was measured through a direct shear test. Additionally, a low-speed ricochet experiment was performed based on the water content of sand. The internal friction angle was used in finite element analysis (FEA), and analyzed under the same initial conditions of the low-speed ricochet experiment. The ricochet behavior of the steel spheres was compared with the experimental results. Furthermore, in high-speed ricochet analysis, the change in behavior of a projectile after ricochet was examined based on the internal friction angles.
Direct shear test of sand as a function of water content
Direct shear test
In this study, direct shear tests were conducted to analyze the properties of sand as a function of water content. The direct shear test examines the mechanical properties of sand. First, the sand sample was placed into a brass box that was divided into two parts. Then, a constant vertical load was applied to the sand. Under the vertical load, the lower box or upper box should move horizontally to measure the mechanical properties of sand. The shear resistance increases as the vertical load increases. Figure 1 presents a direct shear test apparatus and arrangement. Using the Mohr Coulomb failure criteria, the internal friction angle and cohesion of sand can be obtained. Equation (1) shows the Mohr–Coulomb failure criterion, and Figure 2 shows the relationship between shear stress and normal stress in the Mohr–Coulomb failure criterion. 18

where τ is the shear stress, c is the cohesive strength, σn is the normal stress on the failure plane, and ϕ is the internal friction angle. The average shear stress for the vertical load was obtained, and a trend line was drawn for the average shear stress value for three vertical loads. Using this process, the internal friction angle and cohesion strength of sand were calculated as a function of water content. The vertical loads used in this test were 0.5 kg/cm2, 1 kg/cm2, and 1.5 kg/cm2. The water content in sand was set as 3%, 6%, 9%, 12%, 15%, 18%, 21%, and 24%. The reason why the water content was set up to until 24% is that if the water content exceeds 24% in the ricochet experiment, the ricochet did not occur when the incident angle was 20°. And the reason for measuring the water content at 3% intervals was that too many experiments should be performed at 1% intervals of the water content. However, if performed at 3% intervals, the appropriate number of experiments and the value of the internal friction angle according to the water content could be obtained effectively.

Direct shear test apparatus and arrangement.

Mohr–Coulomb failure criterion.
Direct shear test results
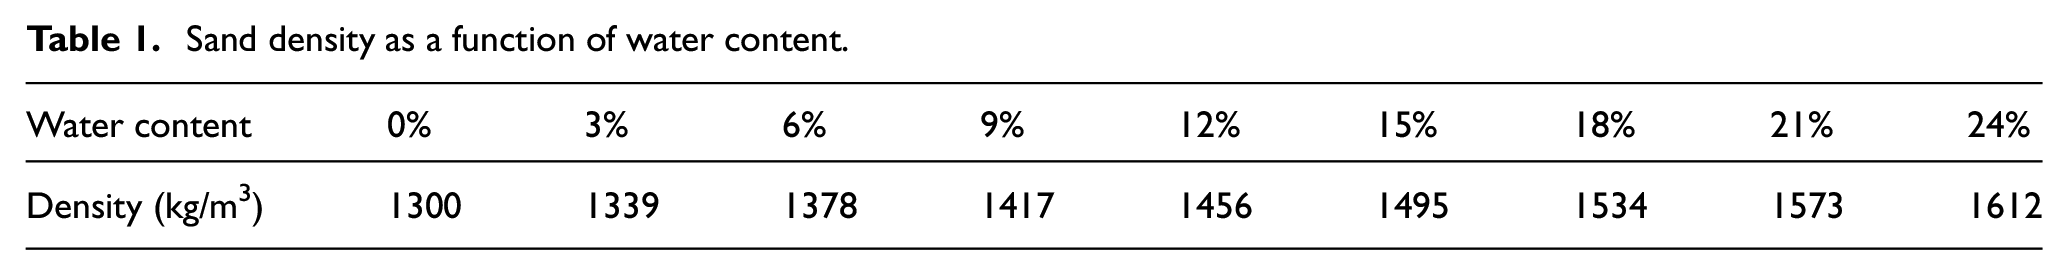
Direct shear tests were conducted to determine the internal friction angle and cohesion of sand for various combinations of three vertical loads and eight different sand water content ratios. The Mohr–Coulomb failure criterion was used to analyze the trend lines according to the water content to determine the internal friction angle and cohesion. Figure 3 shows the internal friction angle and cohesion based on the water content. The internal friction angle increased to 37.3° when the water content was 15%, and then decreased. The density of sand changes with the water content. The change in sand density as a function of water content is shown in Table 1.

Internal friction angle and cohesive strength for various sand water content.
Sand density as a function of water content.
Ricochet
Ricochet equations
When an object collides with a medium, a repulsive force (FL) is generated, which is expressed as shown in equation (2).19,20

where CL is the lift coefficient, ρm is the density of the medium, U is the velocity of the object, Sc is the contact area between the object and the medium, and f(α, β) is a dimensionless function that contains the angular dependence of the repulsive force. Figure 4 illustrates the process when an object collides with the medium. ε is the penetration depth of the object. The most relevant factor in the presence or absence of a ricochet of an object is the repulsive force in a direction perpendicular to the surface of the medium. Equation (3) defines the repulsive force along the z-axis of an object. Equation (3) can also be expressed as shown in equation (4). It can also be represented by equations (5) and (6).


Schematic view of the impact process of a sphere projectile.
Equation (5) defines the repulsive force, and equation (6) provides the effective friction coefficient. In other words, if the repulsive force along the z-axis is greater than the energy loss due to the friction between the debris and the medium, the object will ricochet. Therefore, the penetration depth of the object and the contact area with the medium are essential factors in the ricochet process because they affect the repulsion and energy loss.
Simple ricochet equations
The ricochet equation used in DeThrow II, a program that calculates the trajectory and distance of the exploded debris, are simple equations based on the empirical formula. 9 Equation (7) shows the empirical formula proposed by Xu et al. 9 The velocity and angle after ricochet can be calculated using the incident velocity and angle.
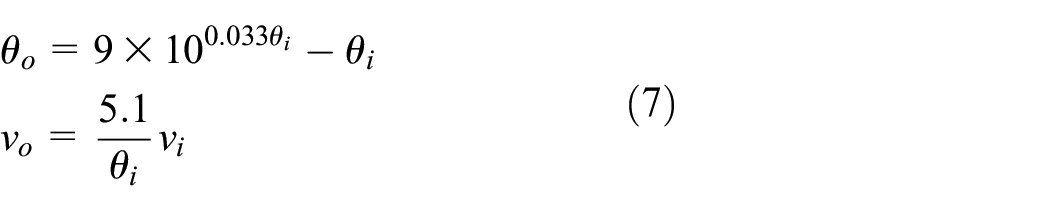
where θo is the ricocheted angle, θi is the incident angle, vo is the ricocheted velocity, and vi is incident velocity.
Ricochet experiments for various water content of sand
Several instruments were used in this study to investigate the ricochet phenomenon of projectiles as a function of sand water content. In many previous ricochet studies, projectiles were launched using a gas cannon or high-speed shooting gas gun.14,15 They could launch projectiles faster than 150 m/s using gas. However, in Korea, it is complicated to obtain permission from the authorities to use gas launching devices. Therefore, in this study, an air tacker was used to launch steel sphere projectiles using a constant air pressure of 6 bar. In most ricochet studies, sphere projectiles are selected to perform ricochet experiments. The sphere projectile could be launched with constant initial conditions with air tacker because it hits the center of the sphere even if it hits anywhere on the sphere, so the firing speed and angle were almost constant. However, it was very difficult to hit the center point or the same point all the time when using polygonal projectiles. Therefore, in most cases, rotation occurs when the polygonal projectiles were launched because, so it was very difficult to fire with the same initial conditions. The air tacker was equipped with an angle changing device for changing the incidence angle. The incident angles used in this experiment were 15°, 20°, and 25°. The water content in sand used in this experiment was calculated using equation (8). 21

where w is the water content, Ww is the weight of water, and Ws is the weight of sand. To prepare the sand having different water content, the sand was dried for 24 h in a desiccator before measuring the weight. Water equivalent to the sand weight was poured and mixed with the sand and kept in a closed container for 16 h. The sand was checked with a sand moisture meter (PMS-714, Lutron) to ensure that the sand has the correct water content. The error range of water content in sand was between −0.3% and +0.3%. When the sand was ready for the experiment, it was transferred to an acrylic sandbox measuring 270 mm × 170 mm × 60 mm (length × width × depth).
The projectile used in the ricochet experiment was a 10 mm diameter steel sphere made from AISI 4340 steel that weighed 4.08 g. This steel was chosen as the debris material because various types of steel and concrete debris are generated when a building explodes, and AISI 4340 steel is used by most industries for applications requiring higher tensile/yield strength. The sphere shape was almost nonexistent in the exploded debris. A spherical projectile was used because it was complicated to launch a cube or a polyhedron structure under the same conditions. However, as hitting a sphere could be a point-contact launching, it was easier to launch a sphere at a constant launch speed than a cube or a polyhedron structure.
A 600 fps high-speed camera was used to analyze the ricochet phenomenon. The recorded images were edited and analyzed for speed and angle after the debris had ricocheted. Figure 5 shows a simplified illustration of the experimental ricochet device.

Experimental setup for studying ricochet on sand.
In this experiment, two variables were selected: incidence angle and water content of sand. The incident angles were 15°, 20°, and 25°, and the water content of sand were 3%, 6%, 9%, 12%, 15%, 18%, 21%, and 24%. The initial speed of the steel sphere was 32 m/s. The ricochet experiment was performed three times per condition, and the following procedure was used:
The air pressure was controlled by using an air compressor to discharge the steel sphere.
The incident angle was adjusted by using the angle-controller of the air tacker.
The sand was prepared as per the given water content for the test.
The experimental sand was transferred to the sandbox, and the water content was measured appropriately using the sand moisture meter. The experiment was conducted when the sand water content was considered to be ideal for the experiment.
The steel sphere ricochet was recorded using a high-speed camera. The speed and angle of the ricocheted steel sphere were calculated from the recorded video.
Ricochet FEA
Nowadays, various explosion studies are being conducted through FEA because it is time-consuming and expensive to do real explosion tests and examine existing models critically. The initial conditions of the debris are also being studied using FEA with explosion theories.22–25 Obtaining the exact initial conditions of debris makes it easier to set the safety distance of the debris. Therefore, the initial condition of the debris and safety distance was also studied. In a previous study, the ricochet of debris was investigated using a simple formula that did not consider the condition of the medium or surrounding environment.9,16,17
In this analysis, the change in the ricochet behavior of the steel sphere was analyzed based on the medium conditions. The shear resistance of a medium is a significant factor that affects the ricochet behavior of debris. The factors influencing the sand shear resistance include void ratio, sand composition, temperature, strain, cohesion, structure, internal friction angle, and water content. 26 The factors affecting the shear resistance are interrelated. Thus, changes in one element affect other elements. This is important because dynamic analysis programs cannot consider the water content of the sand. Hence, if possible, other properties that vary with water content should be inputted. Therefore, in this study, the density and internal friction angle of sand, which were obtained through direct shear testing, were considered as a function of water content. Thus, the effect of internal friction angle and density of sand on the steel sphere behavior can be evaluated, thereby making it possible to analyze the validity of the effect of water content.
FEA modeling
The controlling equation of the explicit solutions
The FEA program used in this study is ANSYS Explicit Dynamics. It is a suitable program for analyzing material deformation and failure that occurred in a short time, such as debris impacting the ground. Explicit solutions can solve complex nonlinear contact problems that are difficult to deal with implicit solvers. According to the D′ Alembert principle, implicit dynamics equations can be expressed as equation (9). 27
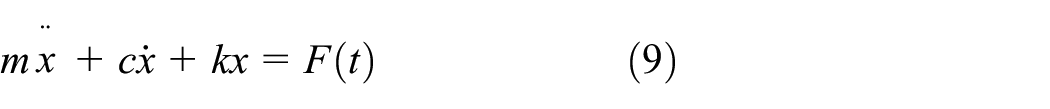
where m is mass matrix, c is the damping matrix, k is the stiffness matrix, and F(t) is the load vector. At any given time, t, equation (9) can be through of as a set of static equilibrium equations that also take into account inertia forces and damping forces. The Newmark method is used to solve these equations at discrete time points. The time increment between successive time points is called the integration time step. However, the collision of debris is a nonlinear problem, so there is more to consider. The explicit solution is obtained using a series linear approximations, so each time step may have many equilibrium iterations and requires inversion of the nonlinear dynamic equivalent stiffness matrix. The basic controlling equations solved by an Explicit Dynamics analysis express the conservation of mass, momentum and energy in Lagrange coordinates. These, together with a material model and a set of initial and boundary conditions, define the complete solution of the problem. Equation (10) is expressed for mass according to initial volume and density.
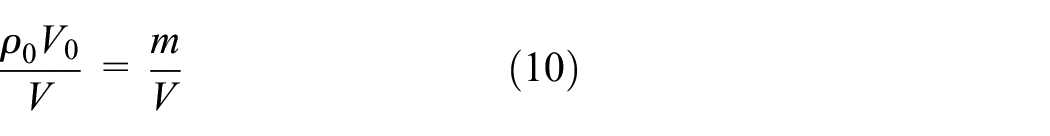
where ρ0 is the initial density of material, V0 is the initial volume of the material, m is the mass, and V is the volume. For Lagrange formulations, the mesh moves and distorts with the material it models, so conservation of mass is automatically satisfied. The density at any time can be determined from the current volume of the zone and its initial mass. Equation (11) indicates the partial differential equations that express momentum’s conservation relates to the stress tensor’s (σij) acceleration.

where ρ is the density, b is the component of the body acceleration. Conservation of energy is expressed as equation (12).

where εij is strain tensor.
The finite element discretization of the explicit solutions
The explicit solution approach is preferred in the solution of problems of wave propagation and short-duration impact response. The temporal discretization uses the central difference formulas as equation (13). 28

A typical step in the solution consists of applying the equations of motion at time n to determine the accelerations as equation (14).

where Fext is the external load vector and Fint is the internal load vector. Using the finite difference formulas of equations (12) and (13), the new velocities and positions are expressed in equations (15) and (16).


Material properties of steel
The AISI 4340 steel used for the steel sphere had a density of 7850 kg/m3, Poisson ratio of 0.29, and shear modulus of 74 × 109 Pa. The yield stress was 4.7 × 10⁸ Pa and tensile strength was 74.5 × 10⁷ Pa.
Material properties of sand
One of the most critical things in this study was to model the sand as close as possible to actual sand. However, most FEA programs cannot consider the value of water content directly. The same is true for ANSYS Explicit Dynamics. Therefore, the values of internal friction angle obtained from the direct shear test were applied to the analysis instead of the water content. The density change as a function of water content was also involved. The Drucker-Prager model was used as sand in ANSYS Explicit Dynamics. This model is expressed as equation (17).

where σY is the total yield stress, σp is the pressure yield stress, σρ is the density yield stress, and Fs is the variation of shear modulus. The three tabular data required for the Drucker-Prager model are shown graphically in Figure 6(a), which shows the yield stress according to the internal friction angle and sand pressure. The Mohr–Coulomb and Tresca theories are suitable for the ricochet analysis on sand, depending on the internal friction angle because the internal friction angle changes according to the water content of sand. 29 In Figure 6(b), the black line and the line marked with a circle indicates shear modulus based on density variation. In Figure 6(b), the blue line and the line marked with a triangle show the yield stress as a function of density variation. These three data are set values based on dry sand, but the change in water content can be applied to the analysis by changing the internal friction angle and density. σp (pressure yield stress) was affected by the internal friction angle. However, the internal friction angle of sand and yield stress is proportional to each other. When the density of sand changes, F (shear modulus) and σρ (density yield stress) also changes. Therefore, the variation in the water content of sand affects σY (total yield stress), and the change in yield stress affects the sand strength, which in turn affects the penetration of the object.

Sand properties in FEA: (a) MO granular pressure hardening. (b) MO granular variable shear modulus and compaction path.
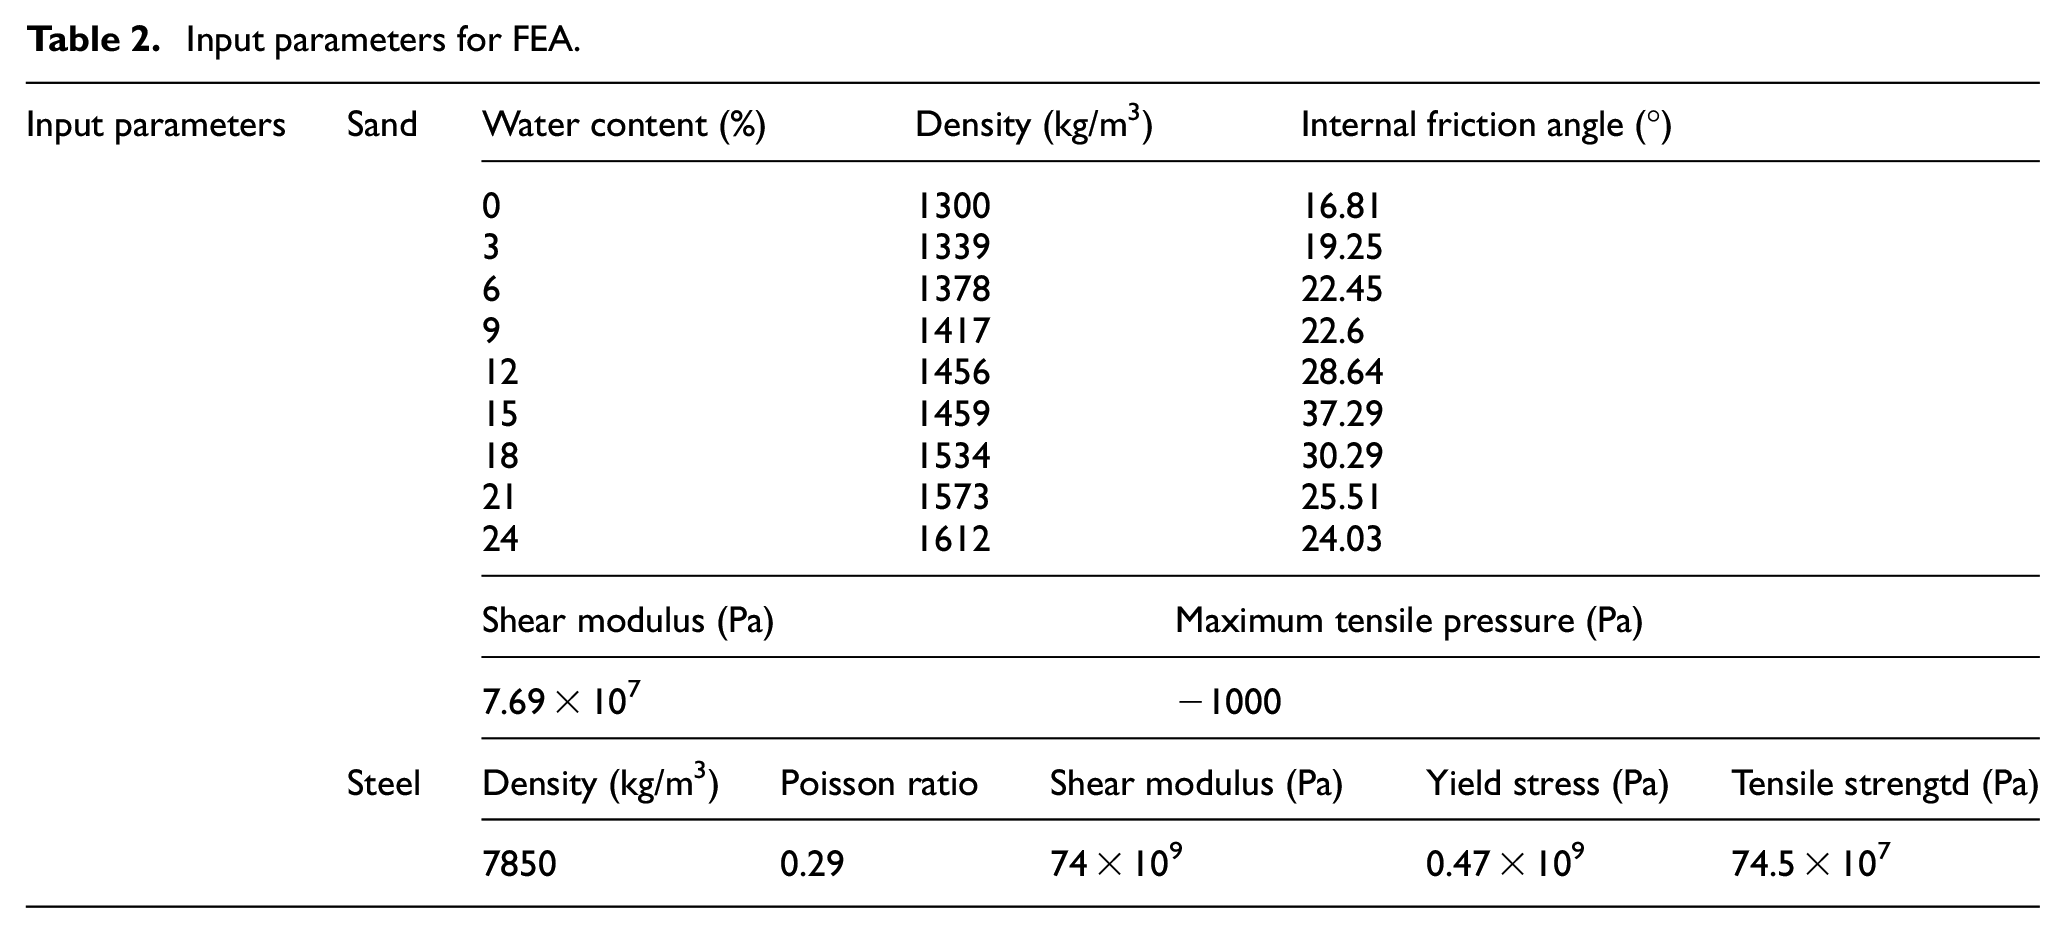
To ensure accurate analysis, the sand should be assumed as grains. However, the grain sizes of sand were tiny, ranging from 0.015 mm to 0.075 mm, making it very time-consuming and expensive to perform the analysis. Therefore, sand was assumed to be a continuum because it is made up of tiny grains and flows like fluid. Hence, the appropriate analytical model is the Arbitrary Lagrangian Eulerian. The fluid-structure interaction algorithm from ANSYS was used to model the interaction between the solid object and sand. 14 The Lagrange model was used for the steel sphere, while the Euler model was used for sand. The steel sphere was a rigid body, and sand was a deformable body. Table 2 shows the overall input parameters used in this FEA.
Input parameters for FEA.
Projectiles and sand modeling
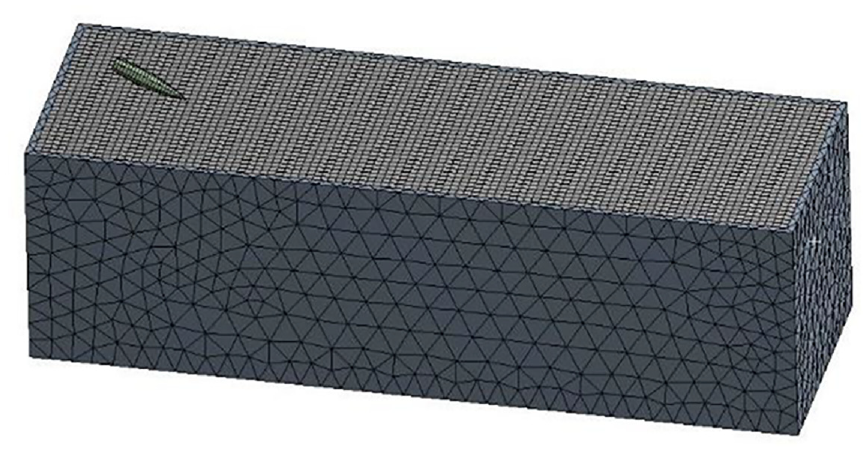
Everything was modeled with the same dimensions and materials as the actual experiments. Figure 7 shows a diagram of the steel sphere, sand, and sandbox used for the analysis. The diameter of the steel sphere was 10 mm. The steel sphere and sand were meshed by hexahedral elements. The size of the sand was 0.6 m × 0.3 m × 0.15 m (length × width × depth), and had a mesh size of 0.008 m. The number of sand elements was 63,865. The incident angles of the steel spheres were 15°, 20°, and 25°, and the discharge speed was 32 m/s. The coefficient of friction between sand and steel was 0.35. The friction coefficient between steel and sand varies depending on several factors. Among them, the friction coefficient changes according to the roughness of steel. The steel sphere used in this study was a ball bearing with a surface roughness of approximately 1.5 µm. 30 When the surface roughness of steel was approximately 1.5 µm, the friction coefficient with sand was approximately 0.2~0.35.31,32 Therefore, 0.35 was selected as the friction coefficient between steel and sand in this study.

Steel sphere, sand, and sandbox modeling.
Comparison of ricochet analysis and experimental results
For the experimental and FEA results, the speed and angle after ricochet were compared. Then, the speed and angle after ricochet obtained from equation (7) used in the DeThrow II Program were compared with the experimental and FEA results. Figure 8 compares the speed and angle after ricocheting as a function of water content obtained through experiments and FEA when the incident angle was 15°. In Figure 9, the speed and angle after ricocheting are compared as a function of water content based on the data obtained through experiments and FEA for the incident angle of 20°. When the incident angle was 25°, ricochet did not occur in the experiment and analysis. In both figures, the dotted lines represent the speed and angle after ricochet obtained using equation (7). As the medium conditions were not considered, it was calculated as a constant value regardless of the water content. When the incident angle was 15°, a similar tendency was observed in the experiment and FEA. The difference between the experimental and FEA results was not significant. However, the ricocheted speed varied depending on the water content. Nevertheless, the results of the simple ricochet equations represented constant values even when the water content changed. When the incident angle was 20°, the ricocheted speed in the experiments and FEA represented similar values and tendencies. However, there was a large error between the FEA and the experiment. When the water content was 12%, the most considerable difference was approximately 4.4°. For other water content samples, it was within 3.3°. The speed and angle after ricochet obtained using simple ricochet equations were calculated to be higher than the experimental and FEA results.

Ricocheted speed and angle observed in FEA and experiments for the 15° incident angle.

Ricocheted speed and angle observed in FEA and experiments for the 20° incident angle.
Figure 10 is an edited photograph of the actual experiment of the behavior of the steel sphere after ricocheting according to the water content. The incident angle was 15°. All three figures show the behavior of the sphere between 0.013 and 0.026 s after the initial impact. When the water content was 15%, the steel sphere moved the farthest, and when the water content was 3%, it moved the shortest. This was the same result as the FEA result.

Ricocheted speed comparison for 3%, 15%, and 24% of water content.
FEA of Ricochet at high-speed
In this study, although a high-speed ricochet test was not performed, a high-speed ricochet test of a 25 mm projectile performed in another study was referred. In the high-speed ricochet study, particular properties of sand and ammunition were not indicated, except sand density. The weight of the 25 mm APEX projectile was 0.222 kg. 33 Therefore, it was assumed that the 25 mm projectile material was steel with a density of 7850 kg/m3, and the weight was equivalent to the actual 25 mm APEX projectile. The ricocheted angle was not mentioned. Therefore, the sand properties used in the FEA of this study does not indicate that it was perfectly suitable for high-speed ricochet analysis. However, it was possible to compare which was more consistent with the experimental result by comparing the values obtained from the high-speed ricochet analysis considering the water content ratio and the results from the simple ricochet equations. The initial conditions available from the high-speed ricochet study were the incident speed of 589 m/s and incident angle of 12.5°. The sand density was 1670 kg/m3. Figure 11 is a model of a 25 mm projectile, sand, and sandbox. The 25 mm projectile was a rigid body, and the projectile and sand were meshed using hexahedral elements. The sand dimensions were 1 m × 0.3 m × 0.3 m (length × width × depth). The mesh size of the sand was 0.008 m. The number of sand elements was 180,500. The sand properties were same as those of low-speed ricochet analysis, except for density. Figure 12 shows the ricocheted speed of the 25 mm projectile as a function of water content. The red dotted line shows the actual result of the experiment. In the actual ricochet experiment, the projectile bouncing speed was 440 m/s. The black dotted line shows the ricocheted speed through the FEA using variable water content. The blue dotted line shows the value obtained through simple ricochet equations. It can be observed that as the internal friction angle of the sand increased, it became consistent with the speed of the actual projectile.
25 mm projectile, sand, and sandbox modeling.

Ricocheted speed of 25 mm projectile obtained from the experiment, FEA, and simple ricochet equations.
Discussion
In this study, the change in physical properties of sand as a function of water content, and the speed and angle of the steel sphere after ricochet were studied.
When the water content of sand changes, the internal friction angle of sand also changes, as shown in Figure 13, 34 because of the relationship between water content and adhesion. The friction force or friction coefficient is related to the internal friction angle that affects the shear stress of sand. When the moisture content of sand increased, the friction or friction coefficient also increased. However, when it was more than ∼15%, the friction was reduced because the lubrication became more significant than the adhesion of sand. Hence, results with similar tendencies were obtained from the direct shear test. Thus, the internal friction angle increased until the water content was 15% and then decreased. Moreover, the cohesion decreased as the water content increased. Generally, excessive water content degrades sand cohesion. Figure 14 shows the cohesion and adhesion between sand grains based on the water content. 35 And most of the sand reaches its maximum internal friction angle when it reaches the ‘limit water content.’ The ‘limit water content’ depends on the type and condition of sand. Compared with other studies, the tendency of the results of the change in the internal friction angle according to the water content in this study is almost the same as in other studies. 36

Effect of sand moisture content on the apparent coefficient of friction.
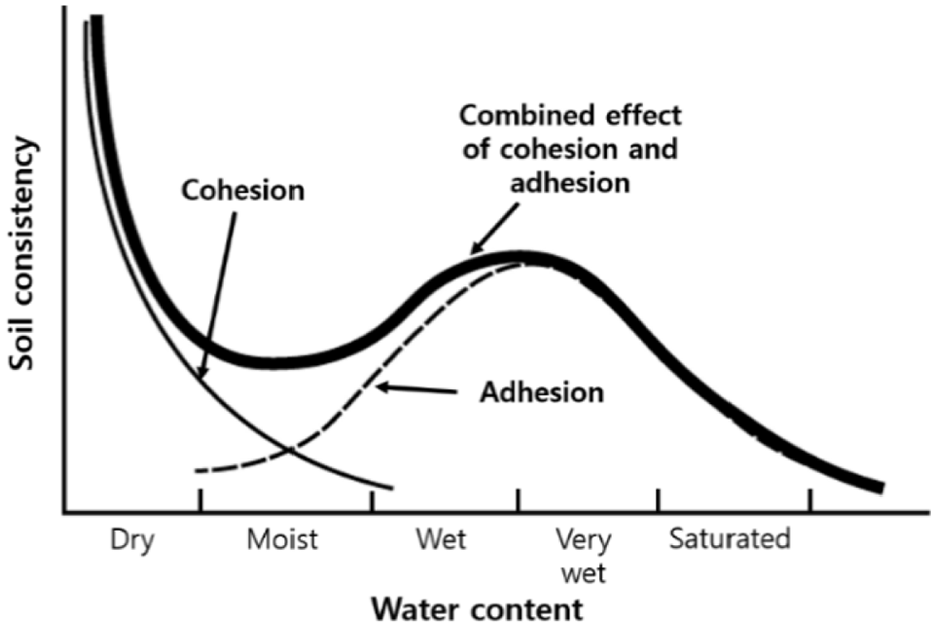
Variation in sand consistency due to water content–contribution of cohesion and adhesion.
The internal friction angle of sand is one of the factors affecting the shear resistance of sand, and when the internal friction angle of sand changes, the projectile behavior after ricocheting varies. 26 Therefore, if the water content changed, the speed and angle of ricocheted projectile would change even under the same initial conditions, as shown in Figures 8 and 9. When the water content was 15%, the reason for the highest speed after ricocheting was related to the internal friction angle of sand. When the yield stress was high, the resistance became more significant in the sand compared to the low yield stress sand, so the penetration depth was reduced. Moreover, the friction with sand was reduced, and the reduction of the effective friction coefficient from equations (3) to (6) made the repulsive force greater. Hence, there was hardly any energy loss after ricocheting in a medium having high yield stress and shear stress. By comparing Figures 3, 8, and 9, it can be observed that the internal friction angle of sand and the ricocheted speed are inversely related under all conditions. When comparing the simple ricochet equations used in the DeThrow II Program with the experimental and analyzed values in this study, it can be confirmed that the result values were similar when the incident angle was 15°. However, it can be observed that the speed after ricocheting cannot be predicted accurately due to the change in water content. In the high-speed projectile ricochet experiment, it can be confirmed from Figure 12 that the ricocheted speed according to the increase in internal friction angles was similar to the actual experimental value. There was a considerable difference from the speed obtained through simple equations. This means that for predicting the behavior of debris after ricocheting, not only the initial conditions of the debris but also the type and condition of the medium must be considered. In particular, depending on the weather characteristics, such as precipitation and humidity, the behavior of the debris may change.
When the angle of incidence was 20°, it can be observed that the error rate was larger than that for 15° because the steel sphere was penetrated deeper in the inhomogeneous sand, the difference in kinetic energy lost in each experiment occurs more than when the incident angle was 15°. Some shortcomings of the simple equations were that they could not consider the changes in sand properties and were unable to predict the critical angle. The critical angle of debris could be varied depending on the type and condition of the debris and medium. At an actual angle of incidence of 25°, the steel sphere did not ricochet. However, when calculated using simple ricochet equations, the speed after ricocheting was 6.5 m/s, and the angle was 35.1°. This suggests that the error rate increases as the simple ricochet equations approach the critical angle. When the angle of incidence was 20°, the steel sphere penetrated deeper into the sand. Unlike the homogeneous sand used in the analysis, the interior of the experimental sand may not be homogeneous. Particularly, as sand was mixed with water, the density and internal friction angle of sand parts that would not mix well may not be uniform. It can be observed that these points did not make the ricocheted angle of the steel sphere uniform, and the standard error was also greater as the incident angle increases. In future studies, the ricochet of the incident angle close to the critical angle needs to be studied.
Conclusion
In this study, the ricochet of a steel sphere on sand was investigated experimentally and numerically for various water contents. The conclusions of this study are as follows:
- When the water content in sand increases, cohesion decreases, whereas adhesion increases and then decreases. The internal friction angle of sand is proportional to adhesion. Additionally, the water content of sand increases the density of sand. The internal friction angle of sand is proportional to the yield stress of sand, and the density of sand is proportional to the yield stress and shear modulus. Therefore, when the water content changes, the change in yield stress and strength of the sand affects the debris ricochet behavior.
- To predict the behavior after ricocheting accurately, it is necessary to apply not only the debris initial conditions but also the diversity of the sand properties. The ricochet of debris is affected by yield and shear stress. When the yield stress increases, the strength increases, and when the shear stress increases, the resistivity increases. These characteristics interfere with the penetration of debris and reduce the penetration trajectory in the medium. Moreover, it reduces the energy lost due to friction with the medium and increases the repulsive force of the debris, allowing it to ricochet at a higher speed. Therefore, even under the same initial conditions of the debris, the debris behavior after ricocheting varies as a function of water content of sand.
These results indicate that the medium properties can be changed depending on the surrounding environment of the building being blown up. However, most studies on the travel distance of debris do not consider the type and properties of the medium. Therefore, to predict the distance traveled by debris from blasting accurately, the type and condition of the medium must also be considered.
Footnotes
Handling Editor: James Baldwin
Declaration of conflicting interests
The author(s) declared no potential conflicts of interest with respect to the research, authorship, and/or publication of this article.
Funding
The author(s) disclosed receipt of the following financial support for the research, authorship, and/or publication of this article: This work was financially supported by the Foundation Research Program (grant no. UD170027GD) through the Agency for Defense Development grant funded by the Defense Acquisition Program Administration.