
Abstract
In order to overcome the defect that the general shaking table test can’t clarify the scale relationship between the prototype structure and the scale model in the damaged area based on the fully similar laws, we derived a method that can analyze the relationship between the prototype structure and the scale model in the damaged area based on non-fully similar lows and verified it. We selected the appropriate material (the emulation concrete material, ECM), which has a good scale relationship with the prototype material in the elastic stage, the crack appearance stage, and crack propagation stage (damage stage). We proposed some similar ratios to reveal the similar relationship between the prototype structure and the scale model in the elastic stage, the crack appearance stage, and the crack propagation stage. Especially, we proposed two similar ratios: cr and hr (deduced by the fracture toughness similarity requirements and the fracture energy similarity requirements, respectively) which can well reflect the similar relationship between the prototype structure and the scale model in the damaged area. In order to verify these ratios, we compared the results of the prototype structure numerical simulation with those of the shaking table test of the scale model. The results show that hr has higher accuracy for predicting the relationship between the prototype structure and the scale model in the damaged area.
Introduction
Earthquake safety of dams is a matter of increasing concern in south-west China, where earthquakes are frequent and of high-intensity. Real behaviors of dams under strong earthquakes need to be predicted for an aseismic design, but few dams have experienced strong earthquakes. The prediction of seismic responses of dams depends mainly on two methods: shaking table experiments and numerical simulations.
In terms of experiments on a shaking table for scaled dam models, Ghobarah and Ghaemian 1 conducted an experimental study of small-scale models of a concrete gravity dam considering hydrostatic, hydrodynamic, and seismic loads. Donlon and Hall 2 performed a series of shaking table tests on small-scale models of a concrete gravity dam to examine the nature of crack formation in a gravity dam. Ghaemmaghami and Ghaemian 3 studied the dynamic cracking of a small-scale model of a concrete buttress dam on a shaking table. Aldemir et al. 4 devised a seismic pseudo-dynamic testing method for a small-scale model of a concrete gravity dam. Phansri et al. 5 discussed the shaking table tests for small-scale models of a concrete gravity dam to simulate the propagation mode of seismic cracks. Wang et al.6,7 conducted an experimental study in their seismic analysis of a high gravity dam with reinforcement on a shaking table with water. Niwa and Clough 8 carried out an experimental study of a seismic nonlinear damage mechanism for an arch dam on a shaking table. Zhou et al. 9 performed a series of dynamic experiments out on a concrete arch dam on the shaking table to simulate earthquake vibration, in which water was ignored. Wang and Li 10 conducted a dynamic overloading model test on a shaking table for an arch dam to investigate its behavior under strong earthquake action. Yang 11 studied the dynamic response and damage failure process of a high arch dam under an intensive seismic load with shaking table model tests. In these experiments on a shaking table, most of them were within the elastic range of the material. Moreover, the number of experiments for concrete gravity dams is greater than for concrete arch dams. This is mainly because the foundation size is limited due to the capacity of the shaking table, although the interaction between the arch dam and the foundation is crucial, and leads to the interaction between the dam and the foundation not being modeled properly. Another important weakness of the shaking table test for the dam is that the scale relationship between model material (i.e., plaster) and prototype material (i.e., concrete) is similar in the elastic stage, but not in the crack development stage (in other words, in the damaged softening behavior stage), it is difficult to find a fully similar material for the softening behavior (that is, in the crack propagation stage of concrete and ECM, the tensile strength drop dramatically) between the scaled model and the prototype. Thus, the general shaking table test can’t clarify the scale relationship between the prototype structure and the scale model in the damaged area based on the fully similar laws. Since there is no certain similar criterion in the crack appearance stage and the crack propagation stage, the scale model in shaking table model tests cannot be used to reveal the damaged area of the prototype structure, the relationship of the crack appearance stage and the crack propagation stage between the scaled model and the prototype structure must be found.
In terms of the numerical simulation of a dam subjected to ground motion, Hariri-Ardebili and Kianoush 12 investigated the damage analysis of an arch dam numerical model. Ren et al. 13 simulated crack propagation in an arch dam. Long et al. 14 implemented a damage numerical simulation for an arch dam. Omidi and Lotfi 15 , Xu et al., 16 and Du and Tu 17 developed the contraction joint element for their arch dam numerical model. Wang 18 and Lin and Hu 19 conducted a numerical study on radiation damping in an arch dam-water-foundation rock system. Hariri-Ardebili et al. 20 also analyzed the earthquake input excitation mechanism for a dam-water-foundation rock system. It is unavoidable that simplification of the numerical simulation and approximation in many parameters is inevitable. The general shaking table test can only reveal the scale relationship between the prototype structure and the scale model in the elastic stage. But they cannot reveal the scale relationship of the prototype structure and the scale model in the damaged area.
In terms of the comparative analysis of the scale model in shaking table tests and the prototype structure in the numerical calculation, Philippe et al. 21 and Zhong et al. 22 numerically simulated the seismic destructive mode of a gravity dam and an arch dam by using a damage constitutive model, then dynamic experimental analysis was conducted on a shaking table. Hariri-Ardebili and Seyed-Kolbadi 23 conducted numerical simulations and dynamic experiments on the shaking table to compare the seismic cracks of gravity dam and arch dam. These results show that the damaged area between scaled models and prototypes of dams is different. At present, the research on the similarity criterion in the stage of crack appearance stage and crack propagation stage are still in its infancy, and there are few related studies. Since it is difficult to use the fully similar laws to reveal the scale relationship of the damaged area between the prototype structure and the scale model, the non-fully similar laws (the strain scale εr≠ 1) can be used for research. 24 In terms of the non-fully similar laws, Prasad and Towhata 25 conducted a shaking table test of the structure-ground foundation interaction (when the design gravity acceleration similarity ratio is not 1) by using the non-fully similar laws. However, the non-fully similar laws for revealing the scale relationship of the damaged area between the prototype structure and the scale model still need to be studied.
The main objective of the present work is to investigate the similarity criterion for the material softening behavior between the scale model and the prototype. In this regard, based on the non-fully similar laws, we try to find the scale relationship of the damage regions between scaled models and prototypes of arch dams subject to strong ground motion. For this purpose, we design a shaking table test and conduct a numerical simulation for the Dagangshan arch dam in China.
The research ideas underpinning this article are as follows: firstly, we proposed some similar ratios between the prototype structure and the scale model in the damaged area based on non-fully similar laws. Then the shaking table experiments and the numerical simulation are conducted to verify these ratios. Finally, the results of the prototype structure numerical simulation and the shaking table test of the scale model in the elastic stage, the crack appearance stage and crack propagation stage are analyzed, and those ratios are compared and analyzed.
The shaking table test
Experimental model material-the emulated concrete material
As a material of the scaled model, the emulated concrete material (ECM) has early strength, with a uniaxial strength at 72 h reaching 70–90% of the strength after 90 days. The mix proportions of the ECM are shown in Table 1. The ECM also has a low strength, low elastic modulus, and hardens rapidly, moreover, the ECM has similar physic-mechanical properties (such as linear elasticity, breakage brittleness, stress-strain curve, cumulative damage curve, and fracture characteristics) to common concrete. 26 Considering that the compressive strength is significantly higher than the tensile strength for both common concrete and ECM, only the tensile mechanical properties relative to ECM are considered (Figure 1). In order to avoid the scale relationship between the model constitutive and the prototype constitutive, we normalized the stress-strain relationship of the material in Figure 1(c): the tensile stress-strain relationship of ECM is similar to C25-C40 concrete, and hydraulic concrete is in this strength range. The elastic module E (with the curing age) of ECM is shown in Figure 3(b)). The aggregate sizes of ore powder, barite powder, and barite sand are 0.05 mm to 2.5 mm. The particle size distribution of ECM fits a grade-2 distribution. The aggregate sizes of ore powder, barite powder, and barite sand are 0.05 mm to 2.5 mm. The density of the ECM is 2700 kg/m3 to 2900 kg/m3. Mechanical experiments were conducted on a series of 100 mm × 100 mm × 100 mm EDM standard test blocks which were cured for 24 h. The compressive strength and tensile strength of the test blocks were 0.45 MPa and 0.0175 MPa, respectively.
The mix proportions (by mass) of standard emulated concrete material.


The mechanical properties of ECM and concrete: (a) tensile stress-strain curves of ECM, (b) tensile strength with the age of ECM, and (c) normalized tensile stress-strain curves of ECM and concrete.
Development of damage similarity theory
A dynamic experiment of small-scale dam models needs to satisfy the following similarity requirements between the scaled model and prototype structure in the elastic stage of the structural.3,5,26
The similarity between inertial force and elastic restoring force is

The similarity between inertia and gravity is

The similarity between elastic restoring force and gravity is

where T, L, ρ, E and ε are time, length, mass density, elastic modulus and strain, respectively. The subscript r represents the ratio (scaled model/prototype structure) of these parameters in the prototype structure and the scale model. If any two of equations (1) to (3) satisfy the conditions, the third formula will be established automatically. The model material and the prototype material need to satisfy the three basic similar laws, so it is impossible to use the same material as the prototype for shaking table test.2,27
As shown in Figure 2, we must satisfy the following similarity requirements that the materials of the prototype and the scaled model simultaneously begin to suffer damage.

where εp, εu, σp, and gf are the peak tensile strain, the ultimate tensile strain, the peak tensile stress (the tensile stress strength), and the fracture energy density of the materials of the prototype and the scale model. The superscripts p and m indicate the prototype and the scale model, respectively. In general, the strain scale εr is not equal to 1, which leads to the development of the non-fully similar laws.

Stress-strain relationship of prototype and model based on non-fully similar laws.
Through physically similar conditions, it can be found that

Substituting equations (4) and (5) into equation (3), it can be obtained that

Because Lr and ρr are constants during the experiment, the using time of the scale model, and the peak tensile stress (the tensile stress strength) (σp)r of the material of the scaled model can be determined by the use of equation (6).
In order for the prototype structure and the scale model to appeared the crack under the same peak acceleration, the scale relationship between the strength and elastic modulus of the prototype structure and the scale model must be consistent. We maintained the ECM to the age shown in Figure 3(c)) and conducted a model test, this can make the prototype structure and scale model have the scale relationship in the elastic stage and the crack appearance stage. Er, εr, and Tr can also be determined as shown in Figure 3.


where a is the acceleration, and f is the frequency.

The method for determining the age of experimental materials based on the non-fully similar laws.
It is worth noting that the above method can only ensure that the prototype and the scaled model begin to suffer damage simultaneously, but it cannot ensure the damage evolution similarity requirements. Generally, the fracture toughness KIC and the stress intensity factor KI are used to determine the concrete’s evolution of cracking.2,10 Thus

This can be rewritten as

Where c is the crack length or the characteristic length of the crack distribution area. Cr is the ratio of the crack length between the scale model and the prototype structure. In the case of the crack length of the scale model, the crack distribution region of the prototype structure can be determined according to equation (10).

in which
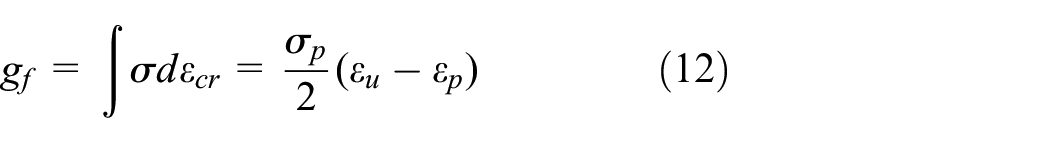
where the fracture energy density gf is the area of the triangle indicated by the arrow in the material softening region as shown in Figure 3. εcr is the cracking strain, and h is the width of the region containing distributed micro-fracture. When (σp)r is determined, (G f )r and (εu-εp)r are also determined. Thus
Then, we can determine the width of the microfracture distribution region of the prototype by use of equation (13).
The scaled experimental model of the Dagangshan arch dam
The Dagangshan concrete arch dam is on the middle reach of the Dadu River, Sichuan Province, China. The highest length of the dam is 210 m, and the crest length is 622 m. The dynamic dam model experiment was conducted by using the shaking table facility at the State Key Laboratory of Coastal and Offshore Engineering at Dalian University of Technology, China. The shaking table (digitally controlled) can input three-dimensional (horizontal + vertical + pitch.) excitation. The working area of the shaking table is measures 4 m × 3 m, and the maximum load capacity is 10 t, while the maximum horizontal and vertical acceleration are 1.0 g and 0.7 g, respectively. The operating frequency range is 0–50 Hz. The control mode is digital control. The shaking direction is “horizontal + vertical +patch”. More details are given in literature 26.
Using the ECM as the scaled experimental material, the geometric scale Lr is 1:273. The width, height, and simulated ground thickness of the scale model are 2 m, 0.77 m, and 0.2 m, respectively. The mass of the scale dam model is 9 t. The simulated foundation width is three times the thickness of the dam bottom. The scale dam model and the schematic diagram of the position of the instrument in the model are shown in Figure 4. The dam and the mountain body of the scaled experimental model are made of the ECM and C30 concrete, respectively. It is worth noting that a rigid foundation is simulated in this experiment because the Young’s modulus and the strength of C30 concrete are almost 300 times than of ECM. The Poisson’s ratio of the ECM and concrete are 0.2 and 0.18, respectively. The damping ratio of the ECM and concrete are 0.026 and 0.051, respectively. The other material parameters of the ECM and concrete are summarized in Table 2. Considering that the main forms of damage of concrete and the ECM are both tensile, the tensile strength and the tensile fracture toughness of the ECM are only considered in the scaled experimental model. The density scale is ρr = 1.188. Thus, the tensile stress strength scale is (σp)r = ρrLr = 0.00435. The age of the ECM is thus 20 h and the Young’s modulus of the ECM is measured thereat. By calculating the Young’s modulus scale Er, the strain scale εr is obtained. To satisfy the similarity requirements, the cement content can be reduced to decrease the fracture toughness of ECM. By calculating the fracture toughness scale (KIC) r, the fracture energy scale (G f )r and (εu-εp)r, the crack length scale cr and the width of the micro-fracture distribution scale hr (cr = 0.00879, hr = 0.00906) are also obtained as shown in Table 2. Moreover, the scale of the relative characteristic length (cr/Lr = 2.40) and the relative characteristic width (hr/Lr = 2.47) of the damaged region can be determined. The time scale (Tr), the time increment scale ((dT)r) and the frequency scale (fr) are 0.033, 0.033, and 30.17, respectively. The acceleration scale (ar) is = 1. The acceleration single loading direction is along river. The design response spectrum of the prototype of the Dagangshan concrete arch dam is adopted as the standard spectrum based on the Chinese code for seismic design of hydraulic structures in hydropower projects (NB 35047-2015,2015), which is converted into that of the scale dam model by the time scale (Tr). 28 Then, the input dynamic history of the scaled dam model is generated by the design response spectrum of the scaled dam model. Loading involved is a step-by-step incremental loading the input dynamic history until the destruction of the scaled dam model occurs as shown in Table 3. The experimental instruments are the “DSPS” data signal acquisition and processing system, the “PXI-1044” acquisition system, the “SI-425” demodulator, the “AR-5F” acceleration sensor, the laser position measuring instrument, and the fiber grating sensor.

The scale experimental model on a shaking table: (a) dagangshan arch dam, (b) the scale model and the sensor layout, and (c) the acceleration of the scale model along the river.
The material parameters of ECM and concrete.

The acceleration maximum of the shaking table and the scale dam model.

The “WC” denotes working conditions, “max.” and “min.” are the maximum and minimum accelerations respectively, the “α” is the acceleration amplification factor, the direction along river is “+” and the opposite direction is “–”.
The results of the shaking table test
Table 3 and Figures 5 to 7 show that the acceleration amplification factors at the top of the arch crown are approximately 10 under increasing WCs (the “WC” is the working conditions): from Table 3, when the peak acceleration of the vibrating table reaches 0.591 g (the 10th WC), the acceleration amplification factor at the top of the dam decreases to about 7.
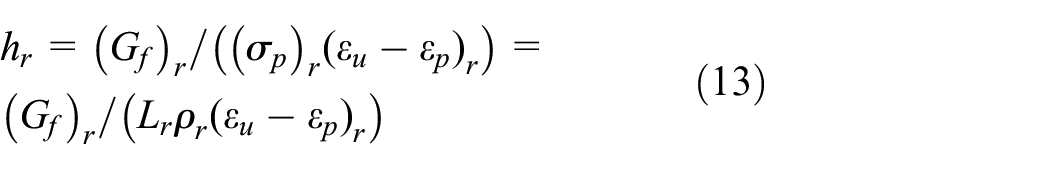
The acceleration distribution at the top of the dam: (a) facing downstream and (b) facing upstream.

The acceleration and relative displacement at the top of crown cantilever with WCs: (a) acceleration and (b) relative displacement.
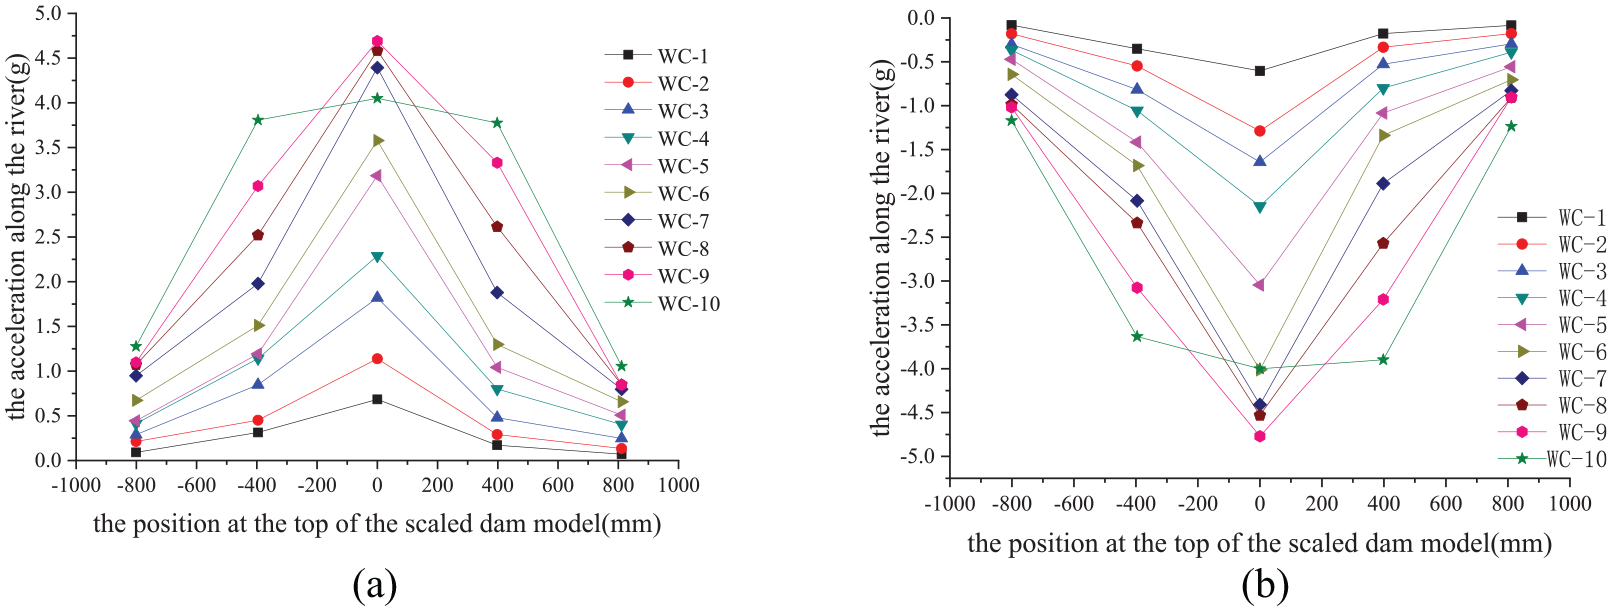
The strain distribution at the top of the arch dam: (a) tensile strain and (b) compressive strain.
Figure 5 shows the acceleration distribution at the top of the dam. It can be seen that the acceleration of the arch crown is the largest, and the acceleration on both sides decreases in turn. The acceleration of the dam increases linearly in the first 6th WC. When the peak acceleration of the shaking table increases from 0.43 g (the 7th WC) to 0.53 g (the 9th WC), the acceleration of the arch crown on the dam crest increases slowly, which indicates that the dam has entered the elastic-plastic working state. When the seismic wave is loaded to 0.591 g (the 10th WC), the maximum acceleration is less than the acceleration when loaded to 0.53 g (the 9th WC), indicating that the dam body has begun to fail the failure state from the 9th WC.
Figure 6(a) shows the acceleration at the top of crown cantilever with WCs. The acceleration of the first 9th WC increases gradually. When the seismic wave is loaded to the 10th WC, the maximum acceleration value is less than the 9th WC acceleration, which indicates that when the seismic wave is loaded to the 9th WC, micro-cracks appear in the top arch crown area, and the dam body begins to enter the failure stage. Figure 6(b) shows the relative displacement at the top of crown cantilever with WCs. The relative displacement of the first 6th WC is very small (less than 1.5 mm) and increases linearly. The relative displacement of the 7th WC is 4.45 mm, which increases rapidly compared with the previous 6th WC. When the seismic wave is loaded to 9th WC, the relative displacement of the crown of the dam crest decreases slightly, indicating that the dam body enters the failure stage from 9th WC.
Figure 7 shows the strain distribution at the top of the arch dam. The strain at the arch crown of the dam crest is the largest, and the strain toward the dam abutment decreases in turn. The tensile stress and compressive stress of the first 9th WC gradually increase with the similar distribution. When the seismic wave was loaded to the 10th WC, the stress redistribution appeared, indicating that the dam body has appeared macroscopic cracks and entered the failure stage.
Figure 8 shows the distribution of the natural frequency of the dam. After the 7th WC, the natural frequency has a clear downward trend, indicating that invisible micro-cracks have appeared at this time. The above results indicate that in the peak acceleration range from 7th WC to 9th WC, invisible micro-cracks converge to form visible macro-cracks.

The natural frequency of the scaled experimental model with WCs.
Figure 9 verifies the results of Figures 5 and 6: it shows that visible macro-cracks have appeared at the top of the arch crown and in the region of the right and left bank abutment. Moreover, these visible macro cracks have formed penetration cracks. It is worth noting that the damaged region in the scaled experimental model of the arch dam is not the real damage relative region due to the non-fully similar laws for the softening behavior between the scaled model and the prototype. It still needs to be converted into the real damage region by the scale of the characteristic length thereof (Section 3.4).

Damage distribution of the scaled model: (a) the view from upstream. Upstream face. Right bank abutment and (b) the view from downstream. Downstream face. Left bank abutment.
Numerical simulation
Nonlinear damage constitutive model for concrete
The elastic-plastic damage model in the software ABAQUS 29 for concrete is

in which

where
The yield criterion is
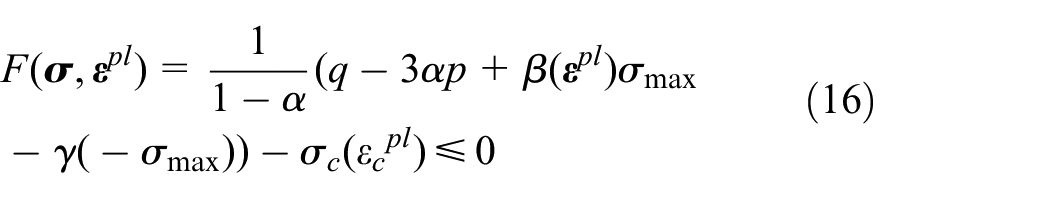
in which

where α is flow potential eccentricity; γ represents the ratio of the second stress invariant on the tensile meridian; σmax, p, and q are the principal tensile stress, the hydrostatic pressure, and Mises equivalent stress, respectively;
The function of non-associated flow potential was proposed by Lubliner et al. 30 and modified by Lee and Fenves 31 is adopted:

where Q is the non-associated flow potential, which is adopted based on Drucker-Prager hyperbolic function. σt0 is the peak of uniaxial tensile stress. ξ is the ratio initial equi-biaxial compressive yield stress to initial uniaxial compressive yield stress. ψ is the dilatancy angle in the p-q plane. The plastic dissipation energy density, damage dissipation energy density, and recoverable energy density are shown in Figure 10. More details and parameters are in literature 32 and 33.

Response of concrete to uniaxial tensile loading.
Input earthquake excitation
The viscous-spring artificial boundary condition (VSABC) 29 is used as the input model. The parameters of springs and dashpots of node m on the VSABC are given by


where n and s refer to the normal and tangential direction of the boundary plane, K is the elastic stiffness of the spring, C is the viscous damping, λ and G are the Lamé constants, cp is the propagation velocity of the P-wave, cs is the S-wave velocity, ρ is the mass density, and R is the distance from the wave source, which takes the approximate value of the perpendicular distance from the center of the structure to the nodes of artificial boundary. a0 = 1.2 and b0 = 1. The equivalent stress exerted on the node m can be expressed as

where u(xm, ym, zm, t) and σ(xm, ym, zm, t) denote the displacement and stress fields at the node m in the artificial boundary model, and σ0(xm, ym, zm, t) is the stress field caused by the free wave field in semi-infinite space. We have verified the correctness and effectiveness of the procedure in the elsewhere,34,35 more details can be in literature 35.
The prototype numerical model of the Dagangshan arch dam
As shown in Figure 11, the prototype numerical model of the Dagangshan arch dam is analyzed. The key parameters of describing the concrete in the arch dam are listed in Table 2. In addition, the density, the Young’s modulus, and the Poisson’s ratio of rock foundation are 2590 kg/m3, 18.85 GPa, and 0.258, respectively. The failure parameters of arch dam concrete are as follows: the dilatancy angle ψ is 36.31°, the flow potential eccentricity α is 0.10, the ratio of initial equi-biaxial compressive yield stress to initial uniaxial compressive yield stress ξ is 1.18. The ratio of the second stress invariant on the tensile meridian γ is 0.68. The other damage parameters are wc = 1 and wt = 1. The model capabilities in the simulation of concrete under monotonic and cyclic uniaxial tensile loadings are confirmed by the response to (load Figure 12). According to the results of the shaking table test, the peak acceleration of the arch dam that has suffered visible damage is 0.591 g. As ar is 1, the peak acceleration of the prototype numerical model is also 0.591 g. The input dynamic history of the scale model is generated by the design response spectrum of the Dagangshan arch dam. The characteristic length of each dam element is 0.3 m.

The prototype finite element model of the Dagangshan arch dam.

Single element uniaxial test: the damage constitutive model: (a) tensile monotonic test and (b) tensile cyclic test.
The modal results
Table 4 and Figure 13 give the natural frequency and vibration modes of the Dagangshan arch dam. Figure 13 shows that the arch vibration of the dam is the main mode of vibration. Table 4 also shows that most of the relative errors of fsc and fpn are within 5%. The results show that accurate natural frequencies can also be obtained by the scaled experimental model of arch dam designed based on the non-fully similar laws.
The natural frequencies of the scaled experimental model and the prototype numerical model.


First fives modes of vibration of the prototype numerical model: (a) 1st-order, (b) 2nd-order, (c) 3rd-order, (d) 4th-order, and (e) 5th-order.
The damage
When the damage factor exceeds 0.8, it is generally believed that macro cracks have occurred. To compare the damage distribution results of the prototype numerical model and the scaled experimental model, only damage factor results greater than 0.8 are shown. Figure 14 shows that the macro-cracks have appeared at the top of the arch crown and in the region of the right and left bank abutment. These regions are the same as in the scaled experimental model. Figure 15 shows that the relative characteristic length of the macro cracks region by the scaled experimental model is approximately 2.5 times that in the prototype numerical model on the upstream and downstream surfaces: because of the scale of the relative characteristic length scale factors of the damage region (cr/Lr = 2.40, hr/Lr = 2.47), the results verify the proposed scale factors of the non-fully similar laws. Comparing the relative characteristic length scale factors of damage regions cr and hr, hr is closer to the experimental and numerical results. Thus, the indicator hr is recommended to represent the conversion of the macro-cracking region between the scaled model and prototype.
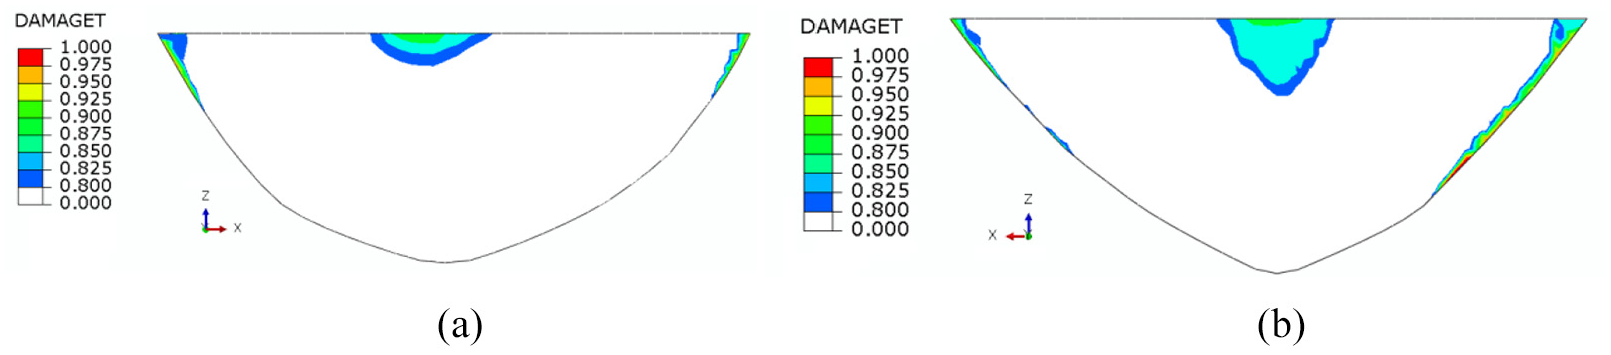
Damage distribution of the prototype numerical model: (a) upstream face and (b) downstream face.
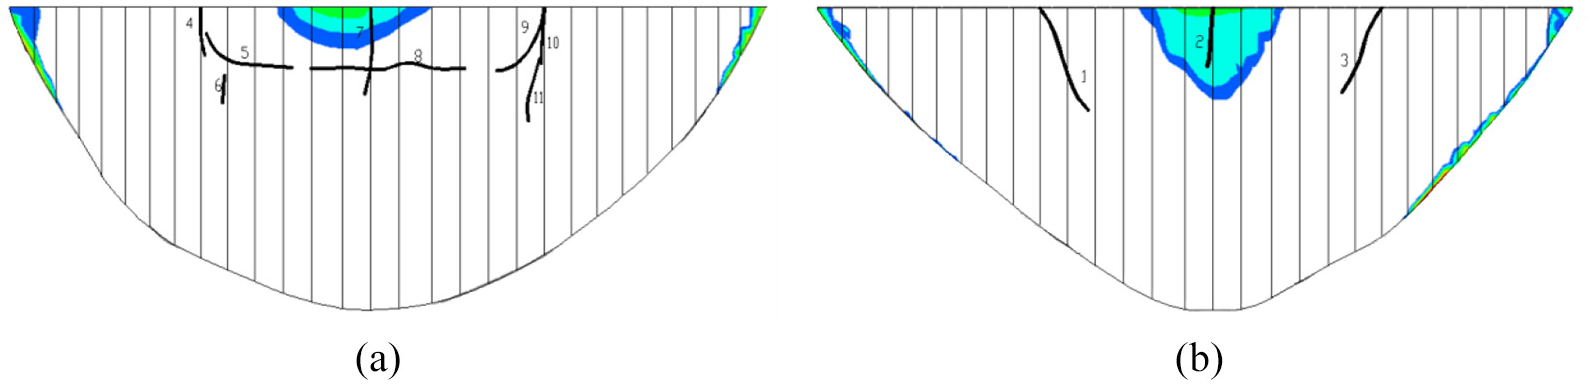
The comparison of damage distributions of the prototype numerical model and the scaled experimental model: (a) upstream face and (b) downstream face.
Conclusion
Through the shaking table model tests and numerical simulation of the Dagangshan concrete arch dam, we draw the following conclusions.
The ECM is a suitable material for the scaled experiment model of arch dams. It has similar physical-mechanical properties (such as linear elasticity, breakage brittleness, stress-strain curve, cumulative damage curve, and fracture characteristics) compared to common concrete.
The previously invisible micro-cracks appeared in the Dagangshan concrete arch dam when the peak acceleration reaches 0.4265 g, and the invisible micro-cracks of the Dagangshan concrete arch dam converge to form visible macro cracks at 0.4265 g and 0.591 g. The damage of the model is due to tensile stress in the arch.
Accurate natural frequencies can also be obtained by the scaled experimental model of arch dam designed using non-fully similar laws. Most of the relative errors are within 5%. The vibration of the arch of the dam is the main mode of vibration of the Dagangshan concrete arch dam.
The relative characteristic length scale factors of damage regions cr and hr can show the relationship of the macro cracks region between the scaled model and the prototype, and hr has a smaller error.
Overall, this study provides a reasonable basis for further research into non-fully similar laws.
Footnotes
Handling Editor: James Baldwin
Declaration of conflicting interests
The author(s) declared no potential conflicts of interest with respect to the research, authorship, and/or publication of this article.
Funding
The author(s) disclosed receipt of the following financial support for the research, authorship, and/or publication of this article: This research was funded by the National Key R & D Programme of China (2017YFC0404900).