
Abstract
In order to solve the problem that there is no effective evaluation method for the precision degradation state of inertial test turntable, a prediction model for the position precision degradation trend of test turntable was proposed based on the Hidden Markov Model (HMM) algorithm and Particle Filter (PF) algorithm. The initial parameter of the PF algorithm was optimized by the Particle Swarm Optimization (PSO) algorithm. The vibration signal was selected as the research data, which could be obtained from an velocity test of turntable precision degradation. Firstly, the original vibration signal was denoised by Ensemble Empirical Mode Decomposition and Principal Component Analysis (EEMD-PCA) algorithm, and the signal with fault characteristic was extracted for signal reconstruction; Secondly, a HMM model could be trained by using the statistical characteristic values as observation matrix, and the diagnosis of early position precision degradation and the health state indexes could be obtained. Finally, a prediction model of the test turntable precision degradation could be established by using PF algorithm, and the Remaining Useful Life (RUL) of the test turntable precision could be calculated. When the 50th group data were taken as the prediction starting point, the predicted remaining useful life was 21 years, and the actual measured result was 17 years, which are close to each other. Comparing the model calculation results and the test measurement results, it is shown that the model could effectively and accurately predict the change trend and remaining useful life of the test turntable precision.
Keywords
Introduction
With the continuous improvement of the precision of inertial components and inertial system, the requirement of the test equipment is becoming higher and higher. The precision and performance improvement of the tested components are affected and restricted by the position precision of test turntable. 1 At the same time, the long-term use of the test turntable can easily lead to excessive degradation in precision. The existing measurement precision methods are too cumbersome, and it is difficult to measure due to the environmental factors. Therefore, it is a new attempt to find a modeling method that focuses on describing the precision degradation of the test turntable. At present, there are two main modeling ideas, 2 one is to establish mathematical model based on the physical structure of the turntable; Yu et al. 3 analyzed the dynamic characteristics of electro-hydraulic engagement of a large-scale CNC turntable, and considered that the comprehensive reverse clearance of the worm gear drive system is one of the key factors affecting the indexing precision and dynamic characteristics. However, it is difficult to establish a mathematical model that can accurately and comprehensively reflect the precision change of the turntable.
The other is to build the model by the intelligent algorithm based on the vibration signal and other data driven. 4 Compared with the mathematical model, the intelligent algorithm does not need to decompose the structure of the turntable. And the vibration signal and other data are used as observation values to explore the information contained in the data that reflects the state change of turntable, so as to transform it into the evaluation of the turntable state. Benkedjouh et al. 5 used wavelet transform for noise reduction and feature vector extraction, and used Support Vector Machine (SVM) to establish remaining useful life prediction model. Lu et al. 6 used Wavelet Energy Entropy (WEE) and Empirical Mode Decomposition (EMD) for noise reduction and feature vector extraction in the study of large-scale slewing bearings, and used Principal Component Analysis (PCA) to reduce the dimension of multi-dimensional feature vectors, and finally, a least squares support vector machine is used to establish a degradation prediction model. However, the trend information of the turntable’s precision change is often very weak in the vibration signal, and it is easy to be covered by the white noise generated by the surrounding environment. Žvokelj et al. 7 used Ensemble Empirical Mode Decomposition Multi-scale Principal Component Analysis (EEMD-MSPCA) to reduce noise and extract feature vectors of the slewing ring, which provided a way to solve the problem of weak signal. On this basis, Feng et al. 8 made improvements and established EEMD-PCA algorithm, which overcomes the shortcomings that it is difficult to obtain empirical parameters in noise reduction. Wang et al. 9 introduced the Hidden Markov Model (HMM) into the life prediction of gearbox, and the method identified some difficult to observe states more effectively. Wang and Hao. 10 combined PCA and HMM in the diagnosis and detection of bearings.
In view of the above problems, combined with the structural characteristics of the inertial single-axis test turntable series system, the HMM algorithm was used to mining the information of both observable states and hidden states. And the HMM algorithm model trained by vibration signal was proposed to diagnose the precision degradation and establish the health state index. Particle Filtering (PF) algorithm optimized by Particle Swarm Optimization (PSO) was used as a prediction model to calculate the remaining useful life of the single axis test turntable precision degradation. And the results before and after optimization and the results of other optimization method were compared and analyzed. At the same time, the photoelectric autocollimator was used to periodically measure the position precision of the test turntable in the process of the velocity test to verify the effectiveness of the model in this research.
Construction of precision degradation prediction model
Hidden Markov model (HMM)
Hidden Markov model (HMM) is based on Markov assumption, immovability assumption and output independence assumption.
11
The core idea of HHM algorithm is to infer the hidden state from the observable state. There are five parameters to describe the HMM algorithm: The state number of Markov chain N; The number of observations M for each state; The moment of state transition probability
When HMM is used to build the observation sequences model, three algorithms are usually used to solve three basic problems.
12
The forward-backward algorithm solves the evaluation problem, that is, given the observation sequence and probability model, the probability value of observation sequence
In this research, the observation matrix OB, which is composed of several statistical characteristics sensitive to the change of precision, is used as the observation value sequence, and four hidden states are set artificially, and then HMM model could be trained. Then the trained model is used for early diagnosis of precision degradation. When the HMM algorithm is used for state recognition in the process of early diagnosis, the normal precision state and the later changing precision state of test turntable are compared, and the matching degree between the precision in each precision state and that in normal state could be obtained, thus the health state index H of precision degradation of the test turntable can be established. It is different from the previous use of HMM algorithm for state recognition.
The particle filter (PF) algorithm
The core idea of particle filter (PF) algorithm is that the probability density function (PDF) is characterized by a large number of random particles

In the process of establishing the PF algorithm to predict the precision change of test turntable, the state space model equation should be first established. On the basis of the existing health indexes H, the Gaussian function is used to carry out nonlinear regression fitting to the health indexes H, and the fitted state space model can be obtained showed as follows. 14


Where,


The iterative formula of weight


Where,
PF algorithm is optimized by particle swarm optimization (PSO)
Although the PF algorithm can represent any form of the probability distribution, there are still a series of problems.
15
Before the PF algorithm predicts, the above three parameters
PSO can be described as: the velocity and position of a randomly initialized particle swarm in d-dimensional space are iterated. The historical optimal solution


Where,
The fitness function in this research is showed as follows.
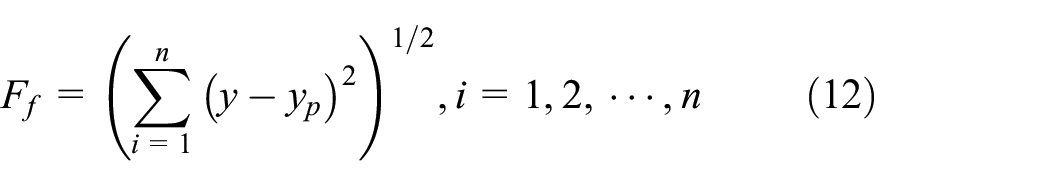
Where,
PSO optimized particle filter algorithm.

Prediction process of test turntable precision degradation
The prediction process of the test turntable precision degradation prediction is as following.
(1) Signal noise reduction and reconstruction. EEMD-PCA method is used to reduce the noise of the original data and reconstruct the signal.
17
The original vibration signal is decomposed into several groups of intrinsic mode function (IMF) components by using the EEMD method. The IMF components are analyzed by PCA method, thus selecting the IMF which contains the low-frequency effective information. The selected IMF components are reconstructed into a matrix
(2) Selecting statistical characteristic quantity to form characteristic observation matrix. The most possible HMM model is established based on the known observation sequence through Baum Welch algorithm. In this research, HMM model
The observation matrix composed of statistical characteristic quantities is showed as follows.
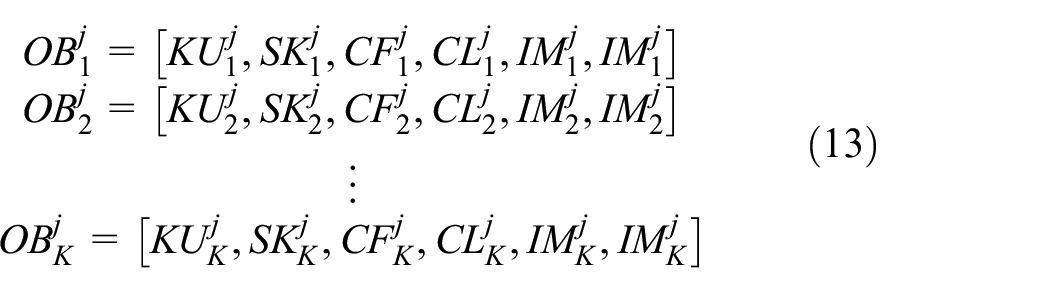
Where,
(3) Using the PF algorithm to predict precision trends. After the optimal starting point parameters
Where,

Standard particle filter algorithm.

The number of training particles is set to 2000, and
The model of precision degradation of the test turntable is shown in Figure 1.

The model of precision degradation of the test turntable.
Test turntable precision degradation experiments
Experiments
The object of the experiment is the inertial single axis test turntable produced by Beijing Aerospace Control Device Institute. The velocity range of the test turntable is
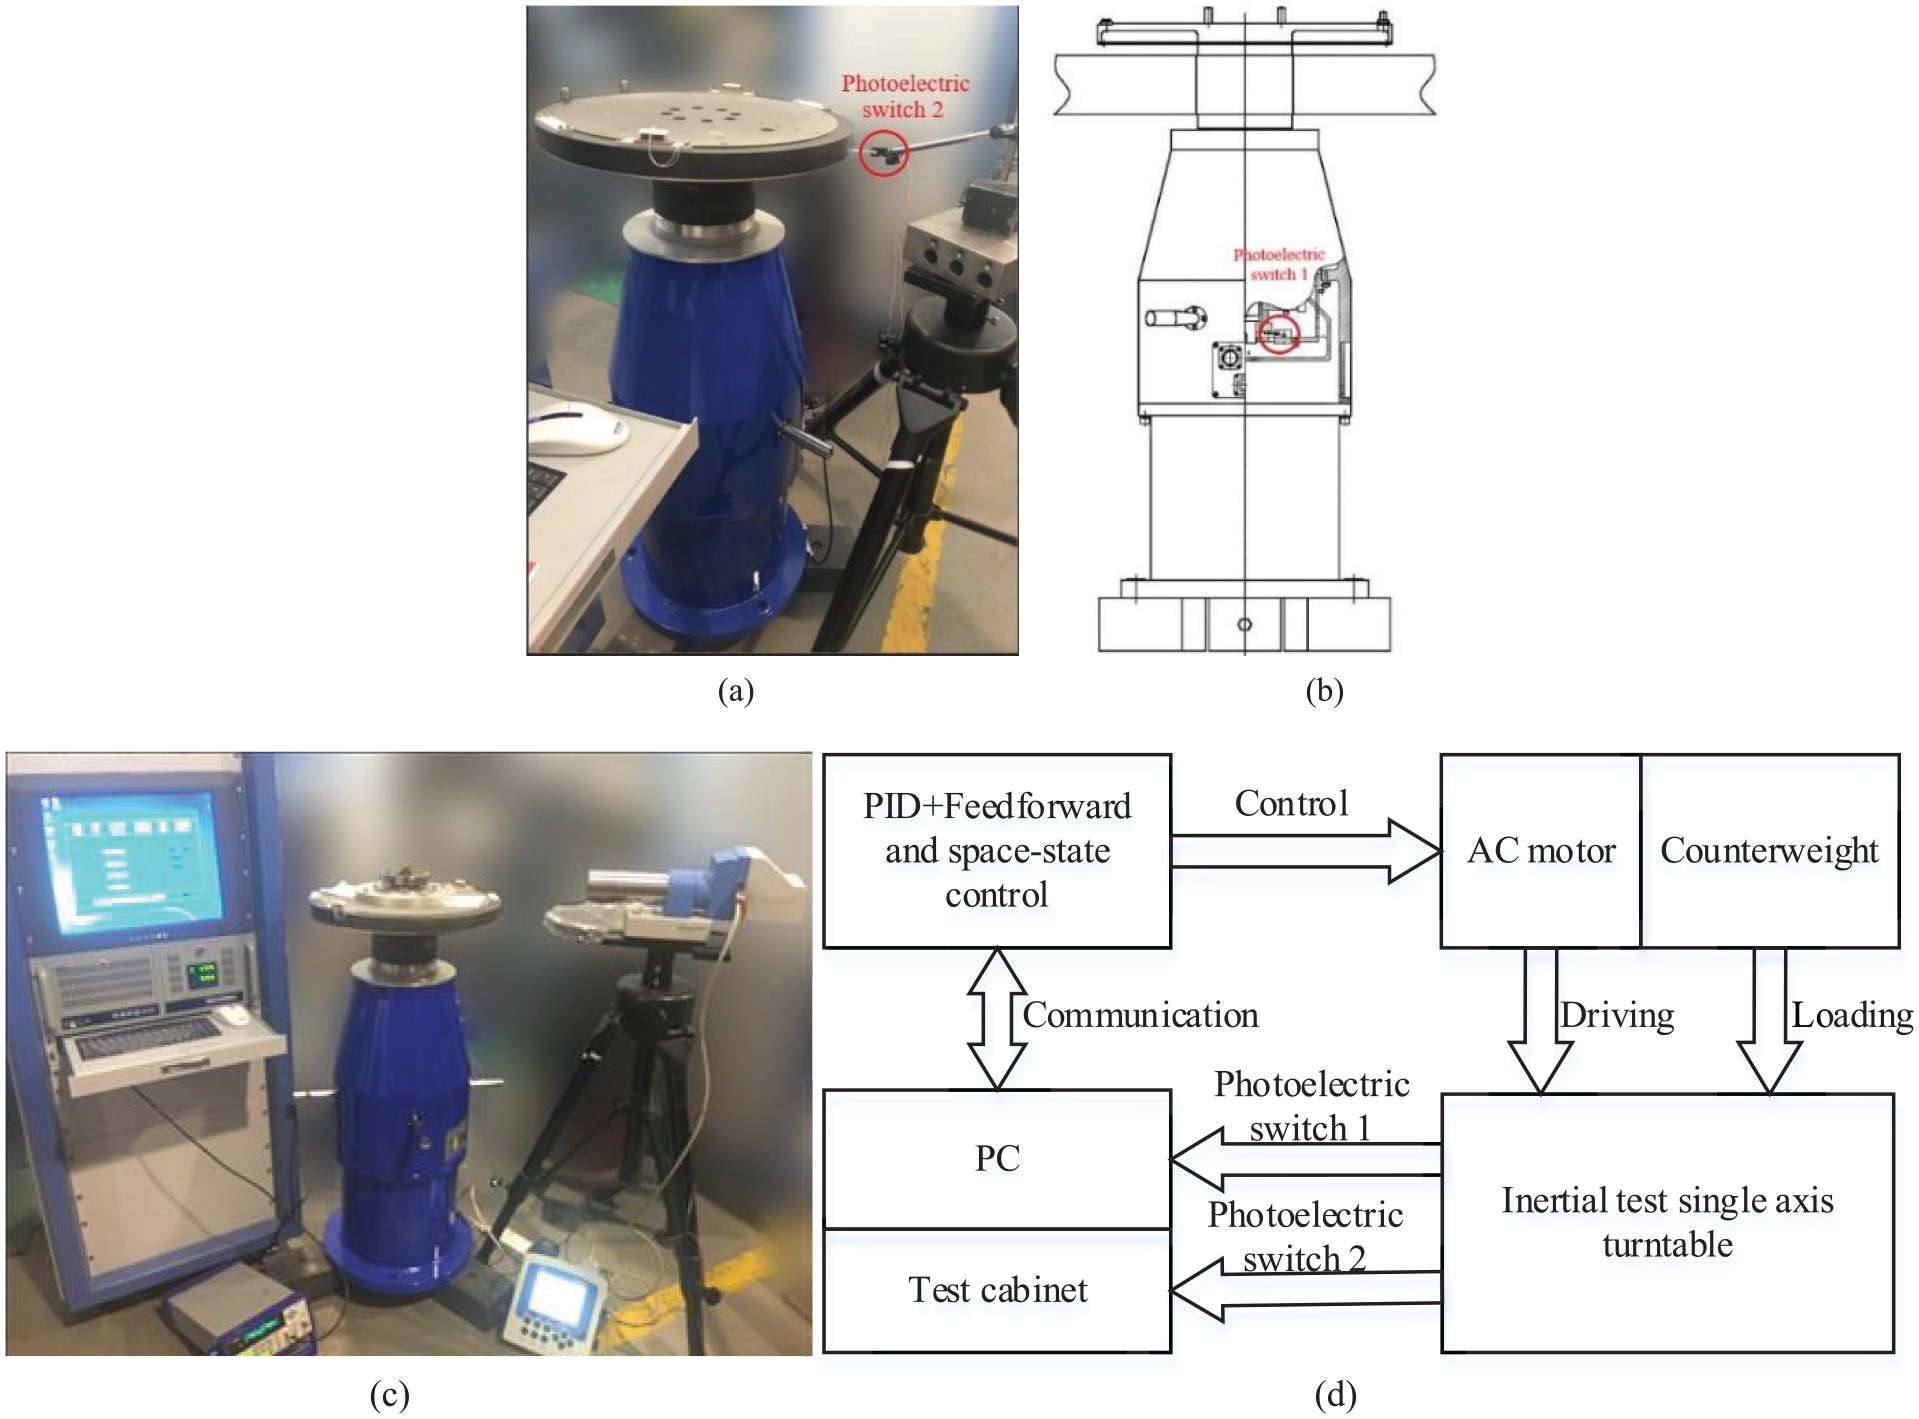
Velocity test system of the test turntable precision degradation.
In order to verify the validity of the model, the position accuracy of the test turntable can be measured regularly by the photoelectric autocollimator in the experiment. The experimental equipment is ELCOMAT photoelectric autocollimator, and the graduation accuracy of this equipment is
Analysis of experimental results
Through the comparative analysis of 87 groups original data collected in the experiment, the vibration of the 10th group to the 30th group is very stable, and the amplitude increases greatly and changes regularly from the 39th group of data. The 10th, 39th, and 50th groups are compared as shown in Figure 3. It can be seen that the amplitude of vibration signal has jumped three orders of magnitude in the whole cycle.

The 10th, 39th, and 50th groups original data.
The EEMD-PCA method is used to denoise the original data and reconstruct the signal after obtaining the data. The 50th group of data is taken as an example to show the data before and after reconstruction as shown in Figure 4. It can be seen that there are more obvious characteristics which can reflect the change of precision after the signal denoising and reconstruction. At the same time, the calculation result is shown in Figure 5 when the statistical characteristic values in Table 2 are substituted into the reconstructed signal. These characteristic values are sensitive to the change of the test turntable precision degradation, which verifies the rationality of Table 2.

The 50th groups data before and after reconstructed by EEMD-PCA method.

Calculation results of statistical characteristic values.
The test samples trained by the 10th group data are input into the HMM model, and a group of log-likelihood probability values could be calculated. The log-likelihood probability value reflects the matching degree between the test samples and the training samples as shown in Figure 6. There is a running-in process in the early stage of the test turntable operation, and the initial precision is not the best state of the test turntable operation. After comparing the data before and after, it is considered that the 10th group data can represent the normal precision state as the training sample. At the same time, the sampling frequency of this experiment is high, so the information of a group of data is large enough.

The health state index curve of the test turntable.
It can be seen from Figure 6 that there is a relatively large degradation in the matching degree in the 39th group of data. It can be judged that the precision of the test turntable has gradually decreased from this time. The probability value calculated from the 39th group is taken as the health status index H in this research. At the same time, comparing Figures 6 and 7, the precision of the test turntable exceeds the design precision error value

The measurement position precision by the photoelectric autocollimator.
It should be noted here the position precision as shown in Figure 7 is measured by using photoelectric autocollimator in the velocity test experimentation, which reflects the panorama of the whole precision degradation process. In the actual operation of the test turntable, only one or more precision points can be obtained by using photoelectric autocollimator. It is difficult to obtain a complete description of the entire operating cycle. It can only judge whether the precision has failed, and not reflect the current precision status of the test turntable. The historical data obtained from the monitoring during the actual operation of the test turntable was analyzed by the algorithm model proposed in this research. The trend of precision degradation could be obtained. The current precision state of the test turntable could be described. Taking a point with no failure of precision as the starting point, the change trend of the precision could be predicted, and the remaining useful life of the precision could be determined, so as to determine whether the test turntable needs to be adjusted.
The life prediction of the test turntable precision degradation is established based on the health state indexes. In this research, the data from the 39th group to the 87th group are selected and fitted by non-linear regression. The values of three parameters a = −147.5, b = 120.8, and c = 76.71 could be obtained respectively. The index parameters R-square and adjusted R-square of the matching degree are 0.9339 and 0.9311, respectively, which shows that the fitting results are reasonable. The three parameter values −147.5, 120.8, and 76.71 as the initial values are used to optimize a, b, and c by the PSO algorithm. The data from the 39th group to the 50th group are used as observation data. The optimal parameters in the 50th group

The prediction results of three algorithms: (a) the prediction results of PF algorithm after the initial parameters are optimized by PSO algorithm, (b) the optimization results of PF algorithm without optimization, and (c) the prediction results after using PSO algorithm to optimize the particle set of PF.
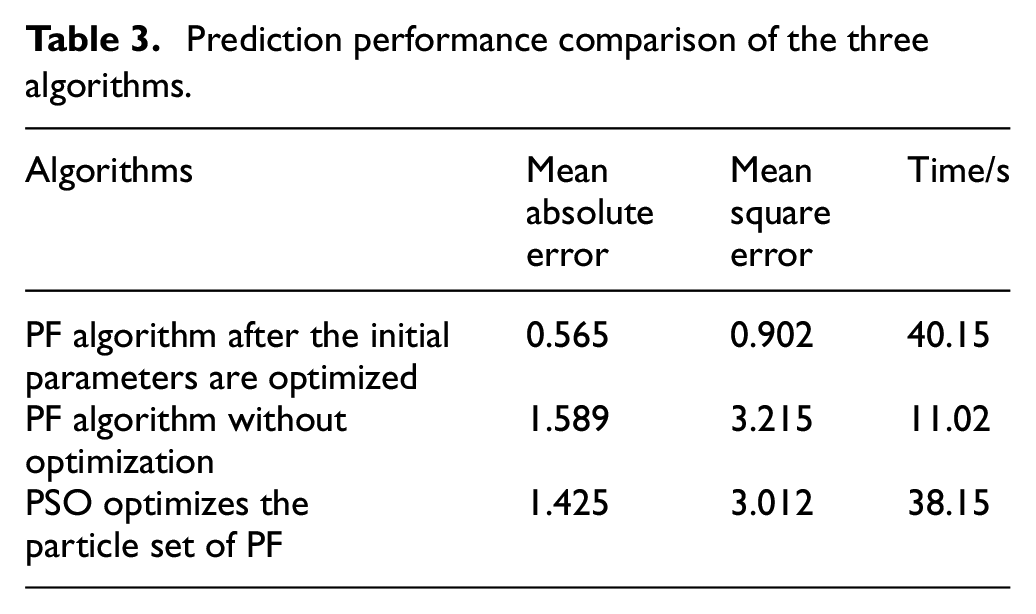
The mean absolute error and mean square error value of the three prediction results are list in Table 3. It can be seen that the prediction result of the PF after the initial parameters are optimized by PSO algorithm is more accurate. The execution time of the PSO optimization program is longer, but it can be seen that the uncertainty of PF at the prediction point after PSO optimization is small by comparing the PDF distribution curve at the prediction point. The uncertainty of the prediction results after using PSO algorithm to optimize the particle set of PF is smaller, and the calculation efficiency is higher, but it can be seen from Figure 8(c) that the prediction results are less consistent with the actual changes, and the overall prediction results are too small in the precision degradation prediction of the test turntable, and the ability to describe the precision degradation trend is not as good as the method proposed in this research.
Prediction performance comparison of the three algorithms.
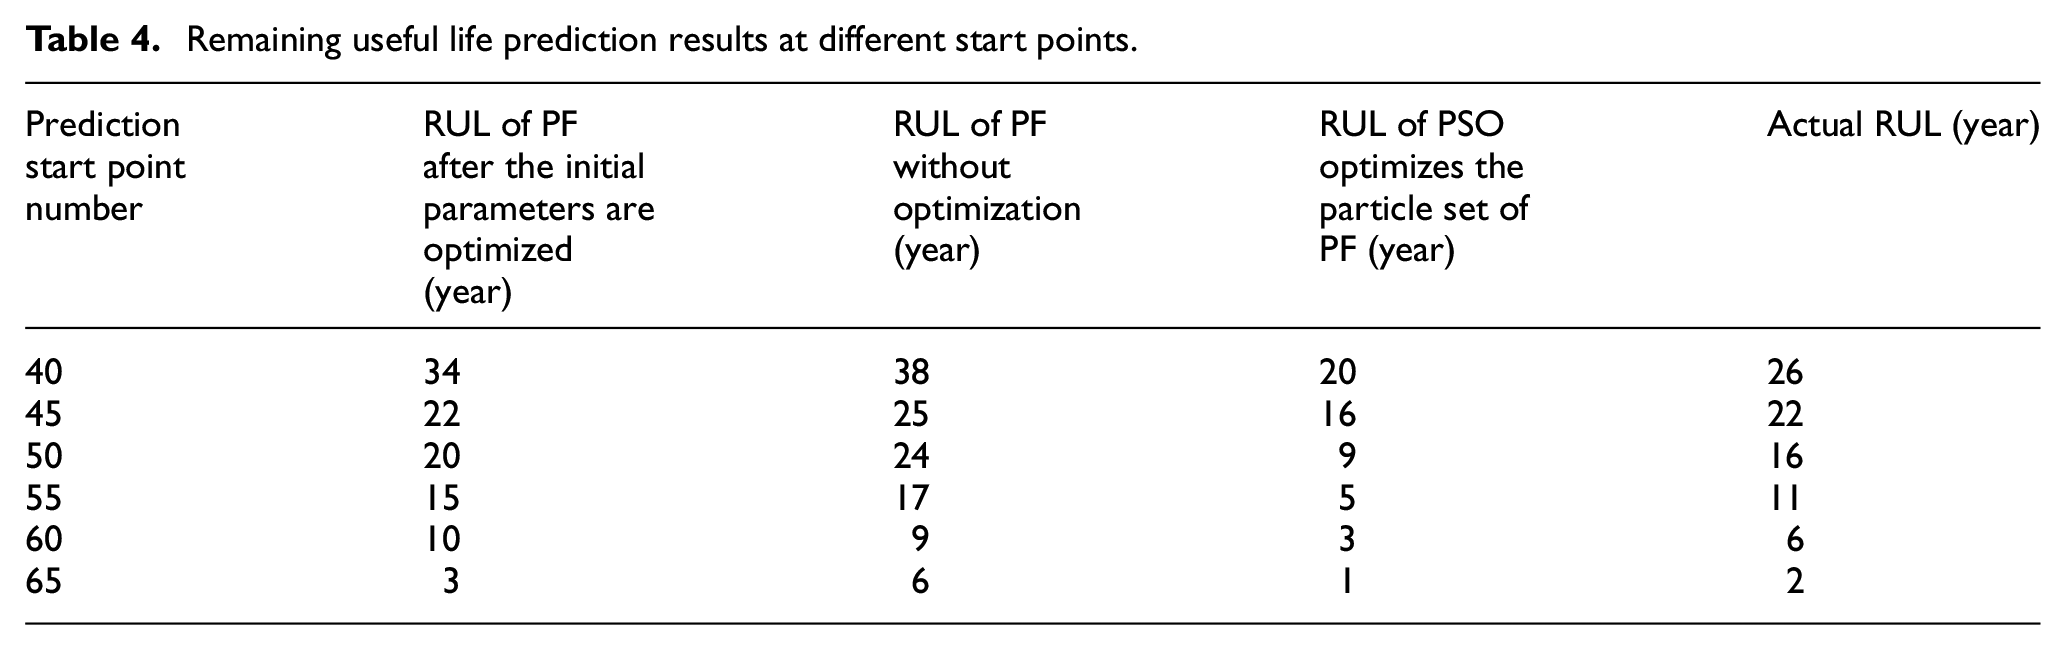
In the case of different signal groups as prediction starting points, the prediction results of the three algorithms are shown in Table 4. When the prediction starts from the 50th group data, it can be seen from Figure 8 that the prediction results are 71, 75, and 60 respectively when the uncertainty of the three algorithms is 50%. The RUL could be obtained, which are 21, 25, and 10 year, respectively. Using the photoelectric autocollimator to measure the change of position precision, the actual remaining useful life of position precision could be obtained, which is 17 year. The difference between the predicted values of the three algorithms and the actual value are 4, 8, and 7 year, respectively. By comprehensively comparing the prediction results of different prediction starting points, it is considered that the method proposed in this research is closer to the actual results. The PDF results of PF initial parameters optimized by PSO are shown in Figure 9. It can be seen from Figure 9 that the larger the starting point is, the more concentrated the distribution is, which indicates that the uncertainty is getting smaller and is consistent with the actual situation.
Remaining useful life prediction results at different start points.

PDF results of PF initial parameters optimized by PSO.
Conclusion
In order to solve the problem that there is no effective description method for the precision degradation of the test turntable, and the existing measuring instruments cannot realize state evaluation. In this paper, the data-driven method was introduced, a prediction model for the position precision degradation trend of inertial single axis test turntable was proposed based on HMM algorithm and PF algorithm. In the process of using PF algorithm, PSO algorithm was used to optimize the prediction point initial parameters of PF algorithm, and the optimal results could be found. When the 50th group is used as the prediction starting point, the predicted remaining useful life is 21 year, and the actual remaining useful life is 17 year. The difference between the two is 4 year, which indicates the prediction results has higher precision. At the same time, the prediction results were compared with the results of the PF algorithm without optimization and the method of PSO optimizes the particle set of PF. The results show that although the program calculation process of PF algorithm after the initial parameters were optimized by PSO takes longer, the prediction results were the closest to the actual result when the 50th group was used as the prediction starting point. The difference between the predicted values and the actual value is 4 year, and the difference between other two predicted values and the actual value are 8 and 7 year, respectively. When using other prediction starting points, the prediction results are the same.
In this paper, the proposed prediction model based on HMM algorithm and PF algorithm was applied to the inertial single axis test turntable. The proposed prediction model can be also applied to other test turntable, such as two-axis test turntable, thee-axis test turntable, and motion simulation turntable, such as five-axis simulation turntable, 6-dof motion platform and multi-objective motion simulator.
Footnotes
Handling Editor: James Baldwin
Declaration of conflicting interests
The author(s) declared no potential conflicts of interest with respect to the research, authorship, and/or publication of this article.
Funding
The author(s) disclosed receipt of the following financial support for the research, authorship, and/or publication of this article: This work has been supported by the National Key Research and Development Project (2017YFC0601604).