
Abstract
In the initial stage of low-carbon product design, design information is always uncertain and incomplete, as well as the coupling properties between design attributes, thus it requires retrospective coordination for design conflicts resulting from the inclusion of low-carbon requirements. Reusing the prior design knowledge can promote design efficiency, however, the acquisition of similar cases knowledge not only needs to consider the similarity of design problems, but also the adaptability of candidate cases. This study presents an effective similarity determination model to support low-carbon product design, and targets of the proposed model are (1) to reasonably determine design ranges of attribute values for product cases retrieval by representing the uncertain design attributes with fuzzy set theory; (2) to construct an efficient indexing structure to generate the index set of similar cases based on the improved discretized highest similarity method by proposing two effective strategies; and, (3) to establish similarity estimation models for different types of attributes, and it calculates the information content of each attribute to evaluate the adaptability of cases based on the Information Axiom. The applicability of the proposed model is demonstrated through a case study of similar cases retrieval for the vacuum pump low-carbon design.
Keywords
Introduction
In the 21st century, human society confronts with significant challenges from climate change. The IPCC’s fourth report of environmental assessment pointed out that climate change and global warming are mainly caused by the large amount of greenhouse gases generated by human activities, where the industrial production and manufacturing account for a large proportion. 1 The International Academy for Production Engineering (CIRP) established the low-carbon manufacturing working group (CWG) in Pairs, France, in January 2008, it aims to guide enterprises to take measures to reduce carbon emissions throughout product life cycle, including energy saving and emission reduction at manufacturing stage, green supply chain, services at use stage, and components recycling at the end of life stage. 2 The preliminary design stage of the product influences about 80% economic cost, environmental and social impacts in its whole life cycle. 3 Low-carbon product design takes account of the environmental indicators during product planning and conceptual design stages, and puts forward the strategies and ideas for the generation of new design schemes with the purpose of carbon emission reduction, and it has attracted a heated research in both academia and industry.4–6
The research of low-carbon product design mainly focuses on the carbon footprint estimation,7–9 low-carbon design theory and methodology,10,11 and low-carbon optimization.12–14 Carbon footprint, the sum of greenhouse gases emissions at each life cycle stage, is a wildly accepted quantitative metric to evaluate the environmental impact of the product. Song and Lee 15 estimated the life cycle carbon footprint of parts based on the design information obtained from the bill of material (BOM), and established the greenhouse gases-BOM (g-BOM) to identify parts with high carbon emissions, which indicates the direction for subsequent improvement and optimization of the parts. Devanathan et al. 16 combined the quality function deployment (QFD) and life cycle assessment (LCA) method to construct a function-environment impact matrix, which enables designers to evaluate the environmental impact of the product function at design stage. However, in the low-carbon product design, since the coupling properties of design quality characteristics, it will inevitably break the original design equilibrium system when low-carbon requirements are incorporated, which results in the complex design conflicting problems. For instance, modifying the component to reduce its carbon emission, but the economic cost is increased and the mechanical property is deteriorated. Therefore, it is necessary to employ the conflicting problem-solving method to coordinate the design contradictions and generate design strategies to make a trade-off between carbon footprint, cost and function performance. The common used contradictory problems solving methods include the theory of inventive problems solving (TRIZ, a Russian acronym),17,18 Extenics,19–21 constraint satisfaction problems (CSP), 22 the negotiation method.23,24
From the abovementioned studies in low-carbon product design, it indicates that whether it is the carbon footprint estimation, the generation of low-carbon design schemes through solving the contradictory problems, and the low-carbon optimization method, they are all dependent on the preceding design knowledge. That is, it is a reasoning innovation on the basis of the product case knowledge. Thus, integrating the case-based reasoning (CBR) technique and design conflicting problem-solving methods can promote the design efficiency, 25 and to accurately grasp the similar cases knowledge corresponding to the low-carbon requirements is the prerequisite for low-carbon design. In our research work, it presents an effective similarity determination model to obtain similar product cases in consideration of the similarity and adaptability for knowledge reuse and adaptation for the low-carbon product design.
The CBR method reuses the prior case knowledge to solve the similar design problems, it stores the product cases with the solution to problems previously solved in the case base, rather than extracting the complex rule knowledge, such as the rule-based method.26,27 Whereas CBR method requires less knowledge extraction in the knowledge acquisition task, it needs to collect a significant number of product cases to wildly cover the design problem and solution spaces in order to handle the new emergent design problems, which contributes to the retrieval utility problem of the case base. Retrieval utility problem refers to the opposite property between the accuracy and the efficiency, 28 that is, when the number of product cases reaches the saturation point, the retrieval accuracy is basically stable, and if it continually adds new cases, the retrieval efficiency decreases. On the other hand, it is unreasonable to select the candidate cases by the single metric, similarity. Because the most similar candidate case may be not the most appropriate for the adaptation purpose. Consequently, it requires additional knowledge to construct the similarity determination model for the candidate cases in consideration of the similarity and adaptability.29,30
The most commonly used cases retrieval method is the nearest neighbor algorithm and its various improved variants,31,32 nearest neighbor method is wildly adopted for the flat case base as its simplicity and practicability. However, it needs to calculate the distance between each case in the case base (memory) and the query case, and then makes the final decision, thus, it will consume extensive searching time when facing the large size case base. Compared with the flat case base, the structure tree indexing method is more suitable for the cases retrieval in a hierarchical structure case base; it hierarchically divides the case base into multiple subsets based on the attribute nodes, thus it only needs to search the subset, in which the attribute values of the cases falling within the value range of the node attributes. Hjaltason and Samet 33 summarized various structure tree indexing methods, and Stephane et al. 30 pointed out the complexity in case base maintenance caused by the structural expansion under dynamic cases addition, and revealed the limitation in processing the overlapping cases. In addition, some useful machine learning methods are applied to the case retrieval, such as the neural network classification method, 34 genetic algorithm, 35 the clustering method.36,37
Aiming at addressing the retrieval utility problem of the case base, the following three measures are generally adopted: 28 (1) construct the indexing structure for the case base, in this approach, the number of cases is not limited, and the constructed indexing structure can improve the retrieval efficiency without reducing the accuracy; however, it is not easy to construct an appropriate indexing structure according to the attribute properties of the cases; (2) formulate the principle of cases addition, that is, control the number of cases in the case base by assessing whether the new case satisfies the addition principle; (3) formulate the principle of cases deletion, namely, control the number of cases by evaluating whether the existing cases should be removed from the case base based on the deletion principle. The difficulty of the latter two measures lies in the formulation of evaluation criteria for the principles. In terms of the adaptability of the similar cases, Smyth and Keane 29 pointed out that it requires additional knowledge to select the candidate case in addition to the similarity, and they proposed the concept of adaptation-guided retrieval scheme. Leake et al. 38 further studied the relationship between the similarity and adaptability. Rousu and Aarts 39 incorporated the adaptation cost into the evaluation indicators of the similarity and adaptability. Roldan Reyes et al. 40 reported that the CSP and CBR depend on the general knowledge and contextual knowledge respectively, and they integrated these two methods to address adaptation problems in the process of engineering design. Qi et al. 41 incorporated the support vector machine (SVM) and adaptability-related knowledge to obtain adaptable cases, the knowledge of adaptability contains the adaptability characteristics of the old cases and the guideline to the construction of the adaptability-involving SVM adaptation model with respect to retrieved cases.
In addition, in the earlier low-carbon design stage for products, facing the fuzzy low-carbon requirements, the incomplete design information, and the potential complex design conflicting problems, even if the designers are experienced domain experts, they cannot grasp the deep knowledge to determine the precise values for the design attributes. But they roughly know the possible design ranges, such as the lower and upper boundaries of the attribute values to guarantee that the decision making for the design parameters is still satisfying the design targets. Giachetti et al. 42 revealed this uncertainty in the expression of the design information at each design stage, from the linguistic variables, fuzzy numbers, to the final real numbers. It also exactly demonstrates that the essence of product design is a complex backtracking process of clarifying the “ill-defined” target problems. 43 The rest of this article is organized as follows: in the next section, low-carbon requirements are detailed analyzed, and the fuzzy set theory is used to represent the uncertain design attributes; the discretized highest similarity indexing method is improved with two proposed strategies to construct the effective indexing structure for the low-carbon product case base; the comprehensive estimation model by integrating the similarity and adaptability is presented to evaluate the candidate cases; a case study about the similar cases retrieval for the vacuum pump low-carbon design is provided to demonstrate the effectiveness of our proposed method; discussion is given, and conclusion is finally drawn along with the recommendations for the further research.
Requirement analysis and representation for low-carbon product design
For low-carbon product design, it is essential to obtain similar cases from the case base according to the low-carbon requirements, and reuse the prior knowledge and conduct the adaptation to generate a new design scheme. Thus, it needs to extract the retrieval attributes from the requirement information. In addition, as the design information is incomplete and unascertained at earlier design stage, in this paper, different kinds of descriptions of the requirement information are converted into the standardized fuzzy numbers.
Low-carbon requirement analysis
Low-carbon requirement comprises the traditional customer preference, that is the appearance attributes of the product, the general quality performance, etc., which is named the voice of customers (VOC), and the low-carbon demand, such as less material usage, low energy consumption, less carbon emissions. Mausi et al. 44 summarized the customer requirements for the environment, defined as voice of environment (VOE), and the quality characteristics (QCs) for the product environmental conscious design (Eco-design), as listed in Table 1. Low-carbon design is a branch of the Eco-design, while the difference in VOC with different products, the VOE and corresponding QCs involved in the design requirements for different products are basically similar. Thus, this study incorporates those low-carbon related VOE and QCs into the design requirement analysis.
The customer requirements and quality characteristics for the environment. 44

In addition, QFD method is a useful design tool to collect vaguely described needs and deploy them to the actual design work. The relationship of low-carbon requirements and quality characteristics can be established based on the house of quality (HoQ), as shown in Figure 1. According to the deployment for the low-carbon requirements, designers can identify the important quality characteristics with high relative weight, and extract them as the retrieval attributes to search the similar cases knowledge for low-carbon design.

Mapping relationship of low-carbon requirements and QCs based on the HoQ.
Representation of the uncertain requirement information with fuzzy set theory
In the life cycle-oriented low-carbon design process, the requirement information not only comes from the product users, but also includes the feedback information from the workers who are in charge of the product manufacturing, assembly, sales, maintenance, and recycling. However, it should be noted that some of this requirement information can be quantitatively expressed, for instance, specify the numerical attribute value with a crisp number, or designate it in a required range; and some requirement information is quantitative immeasurable, it should be expressed with a linguistic term. For example, it adopts the linguistic term to describe the low-carbon and environmental impact (LCEI) of the product as “LCEI is poor”, “LCEI is fair”, “LCEI is good”.
Thus, the different types of descriptions of the requirement information, including the precise numerical value, a range of the numerical value, and the linguistic term, make it difficult to construct the evaluation criteria of the similarity and adaptability for the cases. Fortunately, the above requirement information can be quantitative measured based on the fuzzy set theory.45,46 The fuzzy set in a domain U is defined by a membership function μ, which has the values in range [0, 1]. μ(x) indicates the degree to which x is the possible value in a fuzzy subset. In this paper, the uncertain attribute values of the requirement information are transformed into the standardized triangular fuzzy number, named STFN (Triangle), or the standardized trapezoidal fuzzy number, named STFN (Trapezoid), as illustrated in Figure 2.

Membership functions for the standardized fuzzy number conversion: (a) membership function of STFN (Triangle) and (b) membership function of STFN (Trapezoid).
Here, it takes the STFN (Trapezoid) as an example to describe its transformation effect. Suppose the attribute value A, the transformation result of A based on the fuzzy set theory is represented as STFN (A) = (a l , a m , a n , a u ), a l ≤a m ≤a n ≤a u ≤u, as shown in Figure 2(b), where the domain U of the fuzzy set is U = [0, u], and the membership function is as equation (1).

When a l = a m = a n = a u , A is a numerical value and it is transformed into a STFN(Trapezoid); when a l = a m , a n = a u , A is a range value; and when a m = a n , the STFN (Trapezoid) is equal to the STFN (Triangle).
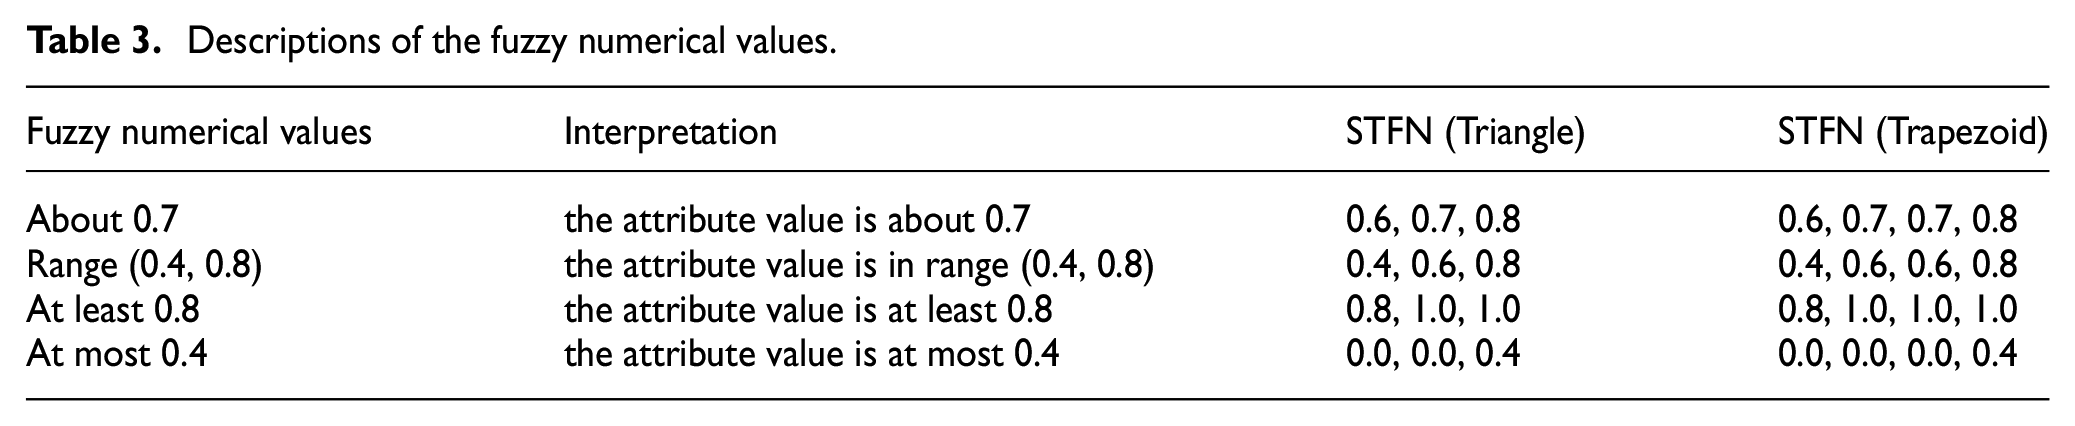
Set U = [0, 1], the linguistic term can be quantitatively expressed by STFN (Triangle) or STFN (Trapezoid) as described in Figure 2(a) and Table 2, and the fuzzy numerical value can also be converted into the STFN (Triangle) or STFN (Trapezoid) as expressed in Table 3.
Descriptions of the linguistic term (take the LCEI as the example).

Descriptions of the fuzzy numerical values.
The improved D-HS indexing method for the index set of similar cases
Indexing method is used to gather a group of similar cases for similarity calculation, and thus it can avoid the extensive searching for the whole memory. In this paper, an efficient indexing method named Discretized Highest Similarity (D-HS) 47 is introduced, however, this general approach presents its weakness in application, two effective strategies are proposed to construct the improved indexing structure of the case base for low-carbon design.
Principle of the D-HS indexing method
With the principle of D-HS method, it distributes the intervals of each attribute value of the product cases, and designates the spatial coordinates for the cases in the memory. Cases with the same coordinates as that of the query case constitute the similar group. The simple indexing structure of D-HS method facilitates the maintenance for the case base, and it can effectively address the utility problem.
Let C represent the low-carbon case base, it is composed of N product cases (c i ), and each case consists of M attributes (cj) in a vector, as expressed in equations (2) and (3).


where, it defines the expression cj(c i ) as the value of attribute cj of the c i .
Suppose the low-carbon query case q, that is the target case, which consists of M attributes qi, and thus the query case can be described as below.

where, it defines the expression qi(q) as the value of the attribute qi of the query case q.
Let S represent the index set of similar cases, generated by the indexing rule R based on the D-HS principle as expressed in equation (5).

Where, △δi denotes the interval width of the i-th attribute value; C i is the subset of cases, in which the attribute value of each case falls within the same interval as that of the query case for the i-th attribute.
Based on the principle, the indexing rule R can be described in detail as equation (6).

Where, Li denotes the number of intervals of the i-th attribute, li is the index number of Li.
In equation (6), each attribute is discretized by designating the intervals. The number of intervals of the nominal attributes equals to the number of discrete attribute values, while the number of intervals of the numerical attributes is predefined by the designer. Take the two dimensional indexing space as an example, M = 2, c = [c1, c2] = [cx, cy], define Lx = Ly = 4, then the discrete intervals of cx are described as: [0, 0.25], (0.25, 0.5], (0.5, 0.75], (0.75, 1]; the corresponding subsets of cases are

The indexing structure of D-HS method adapted from the literature 47: (a) the distribution of cases in two dimensional space and (b) the scaled up view of the index set S.
D-HS method makes the similarity evaluation limited to the cases in the index set S, thus it greatly promotes the retrieval efficiency. Besides, it is easy to keep the maintenance for the case base when new cases are added or removed. However, the indexing structure of D-HS in Figure 3 has the limitations in retrieval accuracy, which mainly come from two aspects: (1) while the interval width of each attribute is equally designated, the attribute values of cases cannot be evenly distributed. (2) when the location of the query case is close to the boundaries of intervals, the similar cases are easily neglected.
Strategies to improve the D-HS method
Strategy that keep approximately equal number of cases for attribute intervals division
From the equation (6), it can be seen that the widths of intervals of one certain attribute are equally divided, that is, each interval width of the i-th attribute is 1/Li. However, it cannot make sure the even distribution of the i-th attribute values of cases in each interval, which significantly impacts the retrieval result. For instance, the most cases fall within one certain interval, while few cases are sparsely distributed in other intervals. In this context, the index set S may gathers most of the cases, and thus it cannot achieve the effect of reducing the similarity calculation for searching the whole memory by the indexing approach. On the contrary, S may contain no one case.
Fayyad and Irani 48 proposed a multi-interval discretized method for continuous numerical attributes based on the information entropy, and constructed the MDLP interval division criteria. Galushka and Patterson 47 applied the above method to construct a new indexing structure, name D-HSE, and proposed a selection mechanism between the D-HSM and the D-HSE according to the distribution of the cases, the former has better retrieval efficiency, and the latter has higher accuracy. Based on the principle of D-HS method, this study proposes the strategy that keep the number of cases approximately equal in each attribute interval to make cases evenly distributed in a new indexing structure, the procedure is as below.
For the i-th attribute, cases are sorted by the attribute value from smallest to largest, and it defines the number of cases in each interval of the i-th attribute as Int(N/Li), where, Int() is the rounding function. Thus, the lower boundary of each interval is the minimum attribute value of cases falling within the interval, and the upper boundary of the interval is the maximum attribute value. The indexing rule is improved as equation (7).
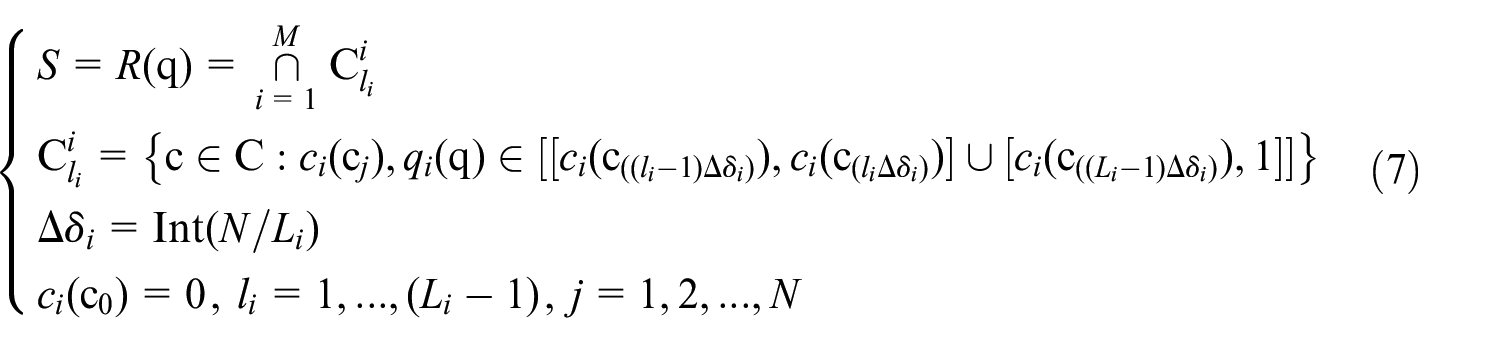
Where, N is the number of cases. Li is the predefined number of intervals of the i-th attribute;
However, the number of cases in each attribute interval is usually not equal as the overlapping attribute values of cases, and thus, it should adjust the number of cases in each attribute interval, and even redefine the number of attribute intervals. For this problem, the criterion to identify whether the attribute values of the cases are evenly distributed in one certain attribute intervals is constructed, as expressed in equation (8).

In equation (8), when

Where, nli denotes the number of cases falling within the interval with index li of the i-th attribute.
Strategy of similarity matching for attributes
When the query case q does not fall within the center of the intervals, as shown in Figure 3, the location of q is near to the boundaries of the intersection. In this scenario, cases c1, c3, c5, and c19 are not included in the index set S, however they are more closer to the query case q than some cases in S, which results in the retrieval inaccuracy.
Brodu 49 proposed a spherical indexing method for neighboring cases, such as the two dimensional attributes in Figure 3(b), it takes the location of query case q as the center to draw a circle, then cases in the circle constitute the index set S. However, this query sphere algorithm is not applicable to the hyper polyhedron in case that the lower and upper boundary values of one or more attribute intervals are asymmetric with respect to the recommended points. In this paper, a simple and effective strategy of similarity matching for attributes is proposed to obtain the similar edge candidate cases.
Suppose there are 10 cases in the case base with four dimensional attributes, and each attribute is designated four intervals. Set the attribute values of candidate cases and the query case: c1(0.30, 0.55, 0.40, 0.15), c2(0.30, 0.85, 0.20, 0.65), c3(0.15, 0.35, 0.30, 0.95), c4(0.20, 0.60, 0.35, 0.90), c5(0.80, 0.60, 0.65, 0.70), c6(0.40, 0.45, 0.65, 0.80), c7(0.80, 0.30, 0.35, 0.85), c8(0.20, 0.90, 0.70, 0.65), c9(0.80, 0.70, 0.20, 0.20), c10(0.80, 0.30, 0.40, 0.80), q = (0.20, 0.30, 0.30,0.80), which can be arranged in Table 4.
Attribute values matching between the candidate cases and query case.

In Table 4, each attribute value of case c3 is matched with that of the query case q; cases c4, c7, c10 all have three attribute values falling within the same intervals as that of the query case q, respectively; for case c6, two attribute values are matched, that is, the values of attributes A2 and A4; cases c1 and c8 only have single attribute value matched with that of the query case q. It concludes that cases having more matched attribute values may close to the query case q, such as the cases c3, c4, c7, and c10. Based on this principle, the strategy of similarity matching for attributes can be quantitatively modeled as equation (10).
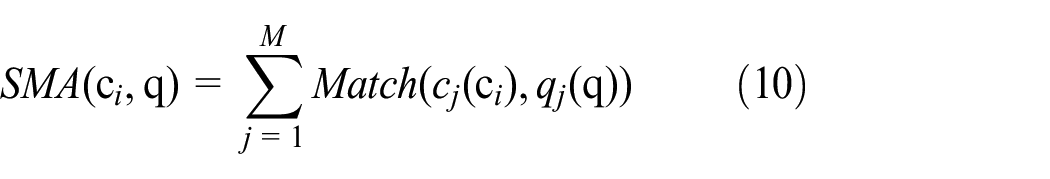
Where, SMA(ci, q) indicates the number of matched attributes between case c i and the query case q; Match() is a matching function, based on the strategy that keep approximately equal number of cases for attribute intervals division as expressed in equation (7), then the matching function is constructed as below.
If
then Match (cj(c i ), qj(q)) = 1;
If
then Match (cj(c i ), qj(q)) = 0.
Based on the strategy of similarity matching for attributes, a new index set of similar cases Sb is constructed as in equation (11), which is a supplement to the index set S obtained from equation (7), and it can effectively avoids the neglect of similar cases when the query case q locates near the boundaries of the intervals by setting the threshold Const of the number of matched attributes. In final, the index set of similar cases S0 in equation (12) is obtained.


Construction of the indexing structure for the low-carbon product case base
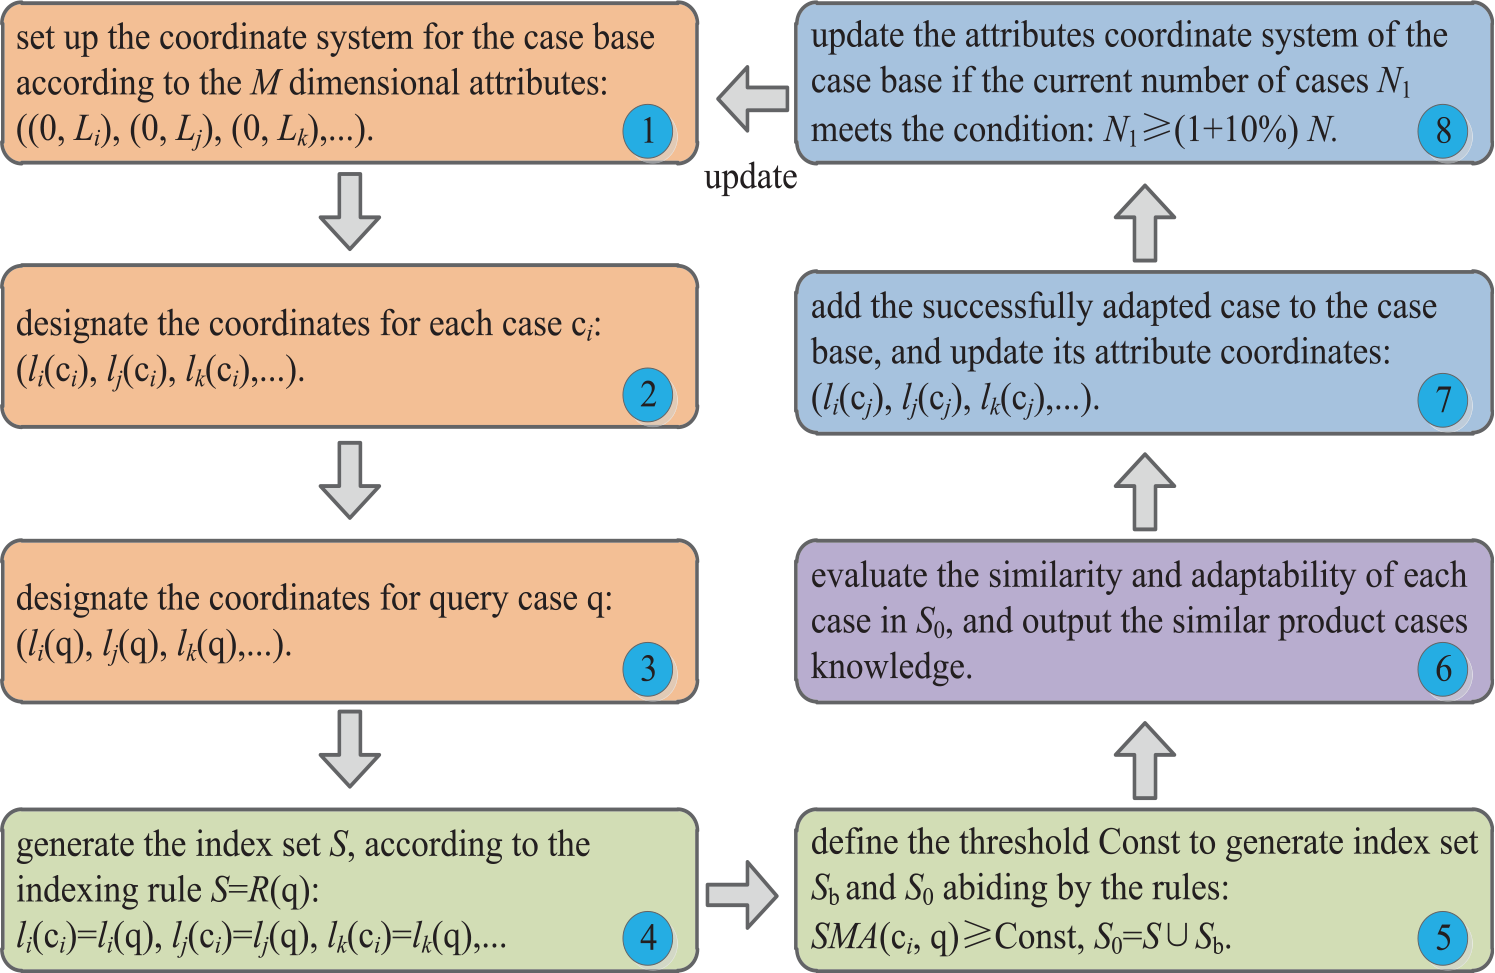
Based on the improved D-HS method, the indexing structure of the product case base for low-carbon design is established as illustrated in Figure 4.
Step 1: sequence the cases for M dimensional attributes, respectively; designate the number of intervals of each attribute; and set up the attributes coordinate system for the product case base, labeled as ((0, Li), (0, Lj), (0, Lk),…).
Step 2: designate the coordinates for each product case according to the values of M dimensional attributes, labeled as (li(c i ), lj(c i ), lk(c i ),…).
Step 3: Input the requirement information, namely the values of M dimensional attributes of the query case q, and designate the attribute coordinates for the query case, labeled as (li(q), lj(q), lk(q),…).
Step 4: generate the index set S, in which the coordinates of cases are same as that of the query case based on the indexing rule S = R(q).
Step 5: define the threshold Const and gather the cases which satisfy the condition SMA(c i , q)≥Const, these cases constitute the index set Sb, and it obtains the final index set S0 = S∪Sb.
Step 6: evaluate the similarity and adaptability of each product case in S0, and output the acceptable cases for knowledge reuse and adaptation. The evaluation models for the similarity and adaptability are described in the following sections.
Step 7: if the output case is successfully adapted to satisfy the design requirements, then it is considered as a new product case added to the case base with updated attribute coordinates.
Step 8: the total number of cases will increase when new adapted cases are continuously added into the case base, thus, if the current number of cases N1 satisfies the condition N1≥(1+10%) N, then the coordinate system of the case base should be updated.
The procedure of the construction of the indexing structure for the case base.
Similarity and adaptability evaluation models for cases retrieval
Similarity evaluation
In this section, it establishes the similarity evaluation models for different kinds of attributes in consideration of the fuzzy requirement information for the cases in the index set S0.
Similarity evaluation model for the precise numerical attribute
When the requirement information for one certain numerical attribute is ascertained, namely, the numerical attribute value of the query case q is a crisp number. For the precise numerical attribute, the classical distance measurement model is used to calculate the local similarity as expressed in equation (13).
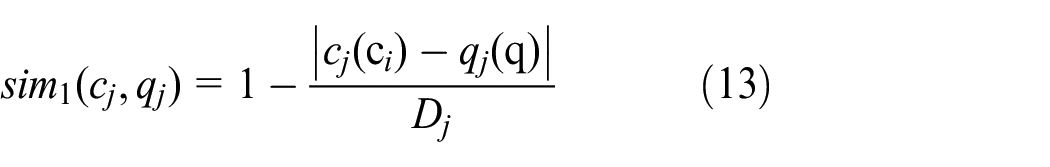
Where, Dj = maximum value –minimum value of the j-th attribute.
Similarity evaluation model for the fuzzy numerical attribute
When the requirement information for the numerical attribute is unascertained, that is, the numerical attribute value is a fuzzy number, and usually it is a range number. In this paper, it sets up the feasible interval and desired interval for each fuzzy numerical attribute to make the decision making of the parameters more flexible for the designer; and the dependent function presented in Extenics19,50 is adopted to establish the similarity evaluation model for fuzzy numerical attributes, as expressed in equation (14).
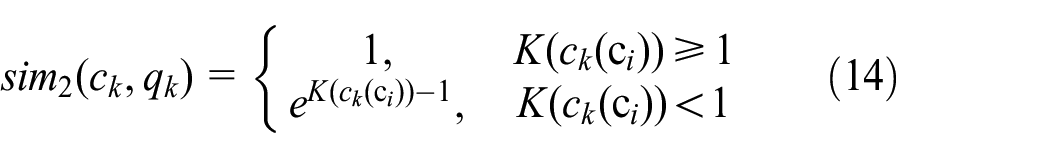
Where, K(ck(c i )) is the dependent function for the value of the k-th attribute of case c i .
Suppose the feasible interval X = [a, b], and the desired interval X0 = [c, d], satisfying X0⊆X; given the ideal point x0 of interval X0, then the dependent function of an arbitrary point x is calculated as in equation (15), here, x can be taken as the attribute value of case c i , namely x = ck(c i ).

Where, ρ(x, x0, X) is named extension distance, which describes the distance of the point x to interval X; and ρ(x, x0, X0) is the distance of the point x to interval X0, accordingly. However, the calculation of the extension distance depends on the location of the ideal point x0. Here, it takes the feasible interval X as the example, when x0 locates at the left side of the middle point of interval X, then it should calculate left side extension distance ρl(x, x0, X), otherwise, it should calculate the right side extension distance ρr(x, x0, X), as expressed in equation (16).

The dependent function of each attribute value of cases has the properties as below:
when x∈X0, then K(x)≥1, it reveals that the attribute value completely meets the requirement;
when x∈X-X0, then 0≤K(x)<1, it indicates that the attribute value is acceptable;
and when x∉X, then K(x)<0, it reveals that the attribute value cannot satisfy the requirement.
Similarity evaluation model for the nominal attribute
The l-th nominal attribute value of case c i and query case q are firstly transformed into the standardized triangular fuzzy number STFN(cl(c i )) and STFN(ql(q)), respectively; and then the local similarity of the l-th nominal attribute is estimated based on the ratio of area of the common range ACR to the area of design range ASTFN(DR), as expressed below.

Where, for the l-th nominal attribute, the area of STFN(DR) is equal to the area of STFN(ql(q)); ACR is the overlapping section between the area of STFN(cl(c i )) and the area of STFN(DR).
Therefore, the global similarity of case c i and query case q is calculated as in equation (18).
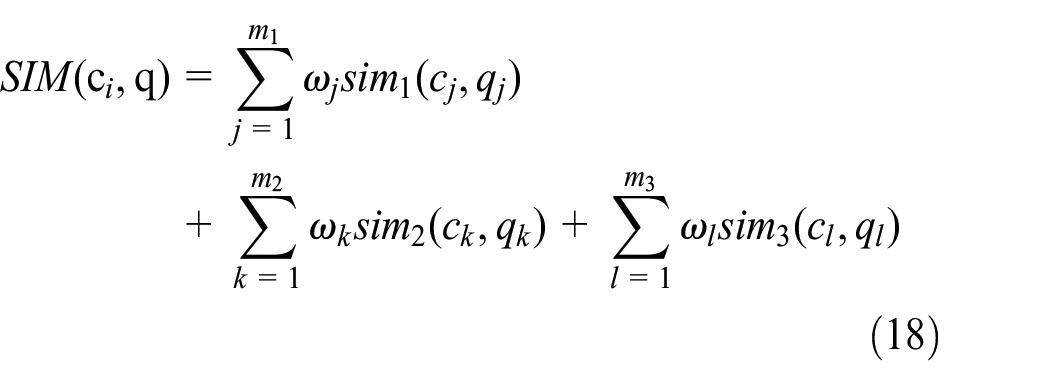
Where, m1 is the number of precise numerical attributes, m2 is the number of fuzzy numerical attributes, and m3 is the number of nominal attributes; ωj, ωk, ωl are the weight of the corresponding attributes, ∑ωj+∑ωk+∑ωl = 1. In addition, each local similarity should be normalized in order to avoid the distorted result because of the different amplitudes caused by the different similarity evaluation models.
Adaptability evaluation
In this paper, it construct a novel adaptability evaluation model based on the fuzzy axiomatic design (FAD).51,52 Axiomatic design (AD) 53 is wildly used for the product design and development as its two foundational axioms, the Independence Axiom and the Information Axiom. In Independence Axiom, it requires that each functional requirement (FR) should be independent in order to construct the stable product system with an uncoupled design environment. The information in Information Axiom is referred to the probability of satisfying FRs, which provides a theoretical support for the robust design, where the design system can accommodate the large variations in design attributes values and yet satisfy the FRs. Based on the Information Axiom, in this section, it construct the evaluation model for the adaptability of candidate cases in S0 by estimating the information content of each attribute, the smaller the information content of the case, the better the adaptability.
The concept of information content is defined to quantitatively estimate the information of the design system, suppose the information content Ik for the given FR k , then Ik is expressed as below.

Where, Pk is the probability of achieving the FR k ; and when there are more than one functional requirements, then the information content I of the design system is the sum of all probabilities. If one or more probabilities are zero, then I approaches to the infinity; in this scenario, the design system will not work although other design attributes are completely satisfied. Conversely, if all the probabilities are equal to one, then I approaches to zero, and this is an ideal design system.
In a design project, the probability of success for the design task is given by the tolerance specified by the designer, that is, the design range (DR), and the tolerance that the product system is capable of satisfying, that is, the system range (SR). Suppose the functional requirement FR k follows the uniform distribution, and the system probability density function (pdf) is clear, as shown in Figure 5, it illustrates that the intersection between the design range and system range is the region where the acceptable solution exists. Therefore, Pk can be expressed as equation (20).

Where, ACR, ASR are the area of common range and system range respectively; and LCR, LSR are the interval width of common range and system range; accordingly, the information content for the FR k is written as below.

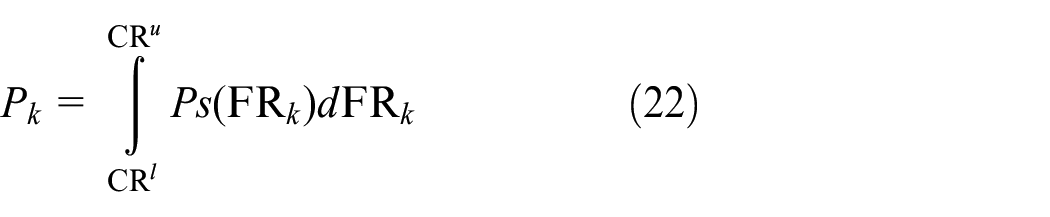
When FR k follows the random distribution, as shown in Figure 6, the probability of achieving the FR k in the common range (CR) is expressed as equation (22).
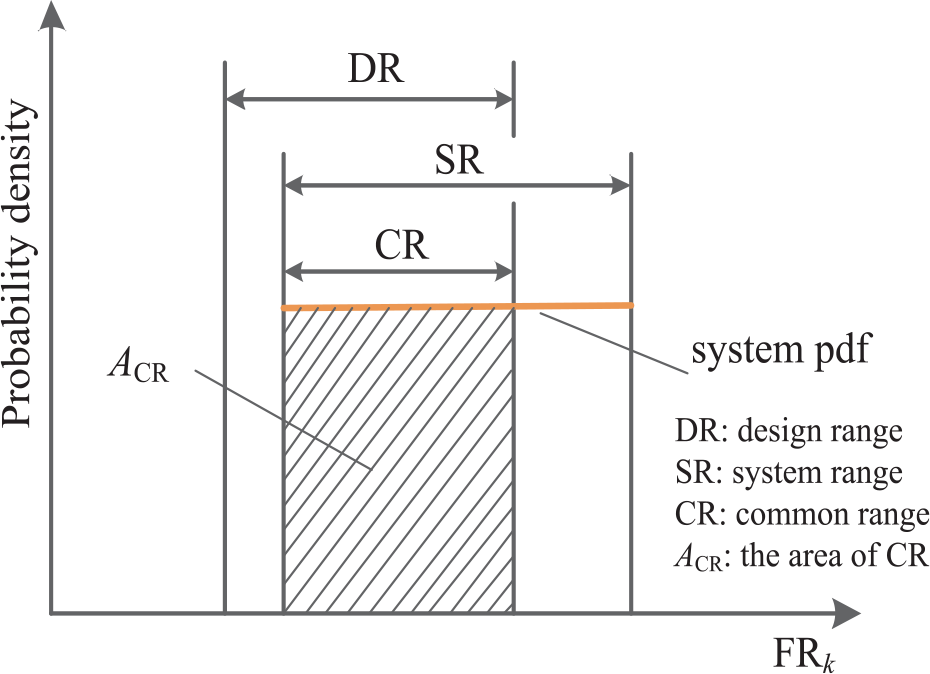
Identification for DR, SR, CR and ACR with the uniform distribution.

Identification for DR, SR, CR, and ACR with the random distribution.
Where, CR l , CR u are the lower boundary and upper boundary of CR, respectively; Ps denotes the system probability density function (pdf). In this context, the ASR is equal to one, thus, the information content Ik for FR k is calculated as in equation (23).

However, in the earlier design stage, the information of design system is always incomplete and unascertained, thus it is hard to obtain the precise probability density function of the design system. In this paper, we adopt the membership function to transform the DR and SR to the STFN(DR) and STFN(SR) with crisp numbers as illustrated in Figure 7, and thus, the information content Ik is expressed as in equation (24).

Where, ASTFN(SR) is the area of STFN(SR).

The standardized triangular fuzzy number transformation for the DR, SR.
According to the evaluation model, it is crucial to obtain the DR, SR, and ACR of each attribute for the information content calculation. Here, we also specify the rules for Benefit type and Cost type attributes to construct the design range.
For Benefit type attributes, that is, the attribute value is like “at least a”, or “more than a”, the design range can be constructed as in the Figure 8(a). where, a l = DR l , a m = a u = max(U(x)), μ(a l ) = 0, μ(a u ) = 1; DR l denotes the lower boundary of the design range, U(x) denotes the whole design domain.

The STFN (triangle) transformation for DR of benefit and Cost type attributes: (a) STFN(DR)of the Benefit type attribute and (b) STFN (DR) of the Cost type attribute.
For Cost type attributes, that is, the attribute value is like “at most a”, or “less than a”, then the design range can be constructed as in the Figure 8(b). where, a l = a m = min(U(x)), a u = DR u , μ(a l ) = 1, μ(a u ) = 0; DR u denotes the upper boundary of the design range.
In addition, when the system range of the design attribute is a crisp value, that is, xj = cj(c i ), in this scenario, the system range is constructed as in Figure 9, here, the Benefit type attribute is taken as the example; and the information content is calculated as in equation (25). 52


Construction of ACR for the crisp SR (the Benefit type attribute).
A case study
Low-carbon requirement analysis for the vacuum pump
The CNC cutting machine is widely used to automatically cut the leather and fabric materials, however, unlike the rigid material processing, the materials should be fixed to the working table by the adsorption force with the pressure difference. In the design task, it needs to configure a suitable vacuum pump for the working requirement of the cutting machine in consideration of low-carbon impact for the environment throughout the product life cycle as the demand of the government policy.
For the task, we concludes twelve design requirements for the vacuum pump after detailed discussion with the staff from the cutting machine industry, which include traditional performance needs and low-carbon demand, and related quality characteristics, as illustrated in Figure 10. Based on the HoQ for the requirements analysis, designers can clearly revels the important QCs and pay more attentions to these attributes during the redesign process, and this study takes the QCs with high relative weight as the retrieval attributes to obtain the similar cases knowledge.

The mapping analysis for low-carbon requirements and QCs based on the HoQ.
There are 151 product cases in the case base, to obtain the similar cases for knowledge reuse and adaptation, it extracts nine QCs as the retrieval attributes, the total sum of their relative weight are more than 80%. The nine QCs are labeled as A1-A9: rate of suction and exhaust (A1), ultimate pressure (A2), rated power (A3), noise (A4), cost (A5), low-carbon and environmental impact (A6), failure rate (A7), maintenance convenience (A8), and material recycling and reuse (A9); A1-A5 are numerical attributes, A6-A9 are nominal attributes, and each attribute value is provided with the feasible interval, desired interval, and the recommended value according to the fuzzy low-carbon requirements, as shown in Table 5.
Attribute values of the vacuum pump with fuzzy low-carbon requirements.

For example, the determination of the attribute value of the rate of suction and exhaust A1, during the cutting process, the air in the working chamber needs to be exhausted within 5–10 s, and thus the value of A1 can be derived from the equation (26). 54

Where, t is the time to exhaust the air from the working chamber, P0 is the initial pressure of the working chamber, and P is the final pressure, V is the working chamber volume, S is the value of A1, K is the coefficient. Based on the calculation result, the rate of the suction and exhaust varies in range [50, 250]L/s. However, for the practical situation, factors such as pumping efficiency, air leakage, cost, and the demand of energy saving need to be considered, thus, in addition to the feasible interval X = [50, 250]L/s, the desired interval is also set as X0 = [120, 180]L/s, and the recommended value is provided x = 150L/s.
The ultimate pressure (A2) is determined by the required pressure difference to produce the adsorption force to guarantee that the leather and fabric materials are stably fixed during the cutting process. Suggestion knowledge from the cutting machine customers is that when the pressure difference is more than 10,000 Pa, there is no relative motion between the cutting materials. Thus the working pressure of the vacuum pump is less than 90,000 Pa (set 1atm = 100 kPa); and according to the design principle that the ultimate pressure is one order of magnitude smaller than the working pressure, thus the required ultimate pressure should be less than 9000 Pa. It also should take account of the air leakage factor and the harmful friction in the cutting process caused by the excessive pressure difference; thus, in addition to the feasible interval X = [0, 9000]Pa, the desired interval is set as X0 = [3000, 7000]Pa, and the recommended value is provided x = 5000 Pa.
For the nominal attributes, the vacuum pump is required with a good low-carbon and environmental performance, low failure rate, good property in maintenance, and high rate of material recycling and reuse. These linguistic terms for the requirements are transformed into the standardized triangular fuzzy numbers, and according to the actual needs from the working situation of the cutting machine, the feasible and desired intervals for attributes can also be designated along with the recommended values.
Generation of the index set of similar cases
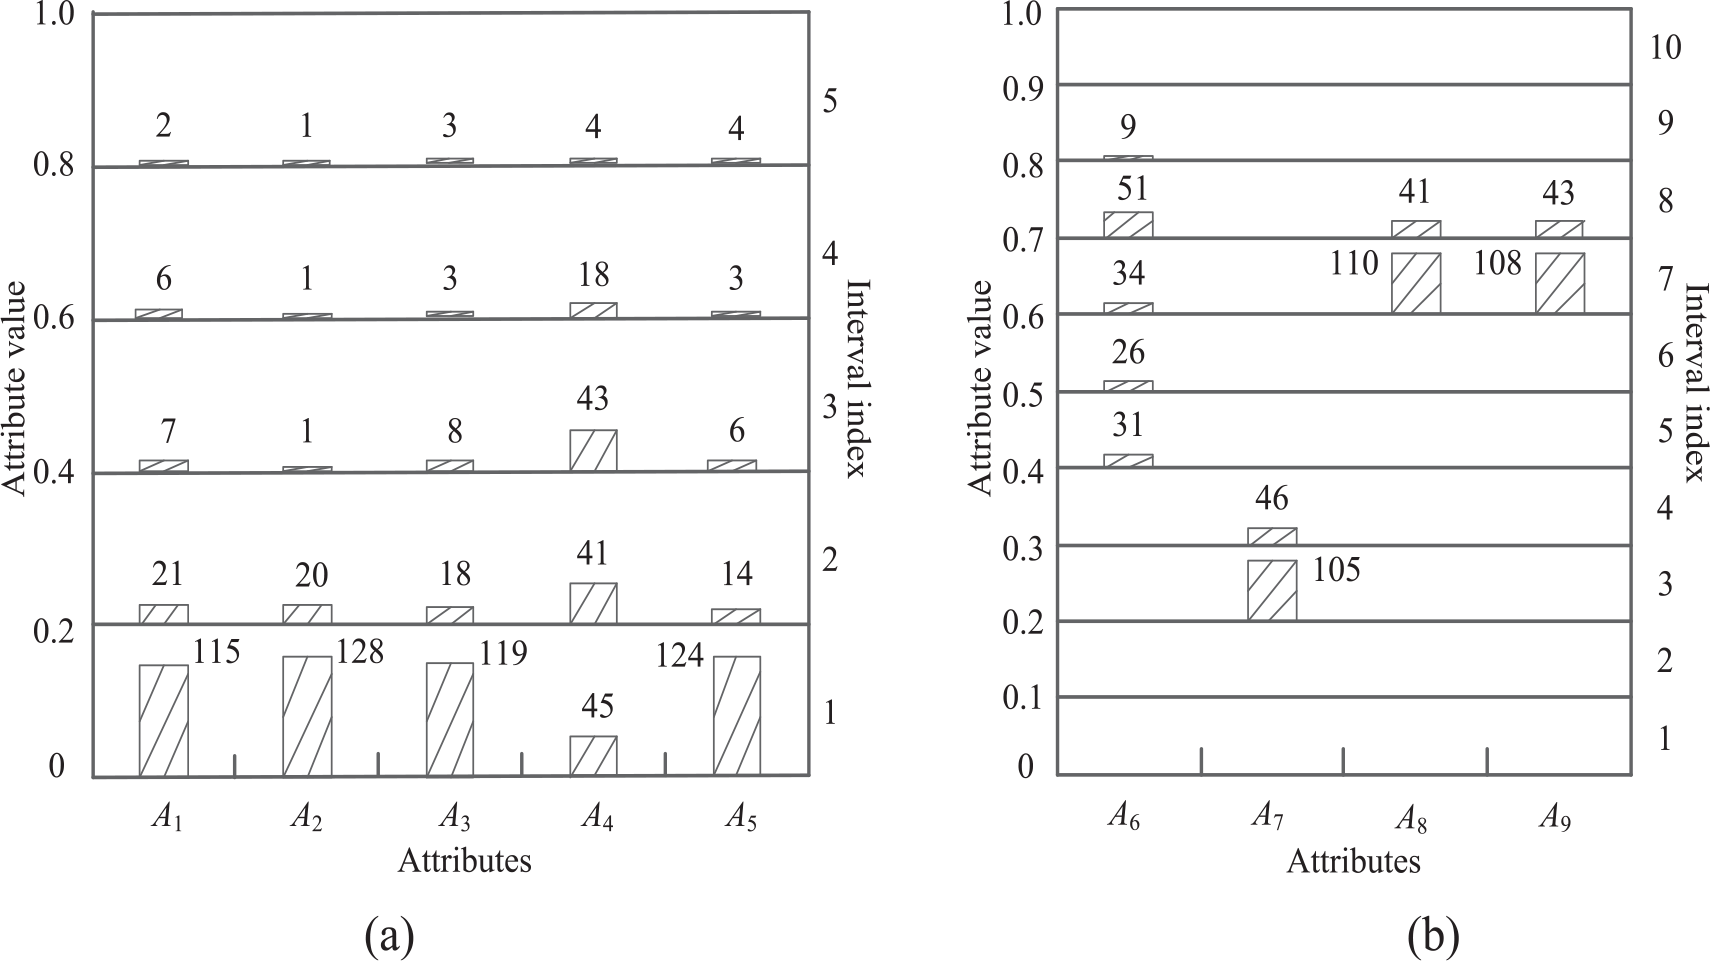
The indexing structure of the product case base is constructed based on the strategy that keep approximately equal number of cases for attribute intervals division. Values of each attribute are normalized and sequenced from smallest to largest, respectively. For attributes A1-A6, the number of intervals are predefined as 5, and for attributes A7-A9, the number of the intervals are predefined as 3, as illustrated in Figures 11 and 12.

The distribution of cases of attributes A1-A5 (ηi = σi/σ(max(i), σ*= 0.20).

The distribution of cases of attributes A6-A9 (ηi = σi/σ(max(i), σ*= 0.20).
Take A1 as an example, attribute A1 is split into five intervals, in the interval with index 1, there are 33 cases, the attribute value varies in a range (0, 0.019); in the interval with index 2, there are 30 cases, the attribute value varies in a range (0.019, 0.063); in the interval with index 3, there are 32 cases, the attribute value varies in a range (0.063, 0.125); in the interval with index 4, there are 30 cases, the attribute value varies in a range (0.125, 0.25); and in the interval with index 5, there are 26 cases, the attribute value varies in a range (0.25, 1). The distribution of cases for each attribute is estimated based on the criterion in equation (8). It indicates the ratio of σi to σmax(i) is smaller than the threshold σ* of each attribute, especially for A7-A9, although many attribute values are overlapping, the splitting result still make sure these attributes belong to the “good” attributes with basically uniform distribution.
In order to make a clear comparison with the original method for intervals division in the D-HS, that is each interval width is equal to 1/Li, Li is the interval number of the i-th attribute. The result of the cases distribution is illustrated in Figure 13, where the interval number of each numerical attribute A1-A5 is predefined as 5, and the interval number of each nominal attribute A6-A9 is predefined as 10. It indicates that most of cases are falling within the interval with index 1 for A1-A5, and the uniformity of cases distribution of attributes A6-A9 is also not ideal, which will badly impact the accuracy of the similar cases retrieval.
The distribution of cases by the original attribute intervals division method: (a) distribution of cases of A1-A5 and (b) distribution of cases of A6-A9.
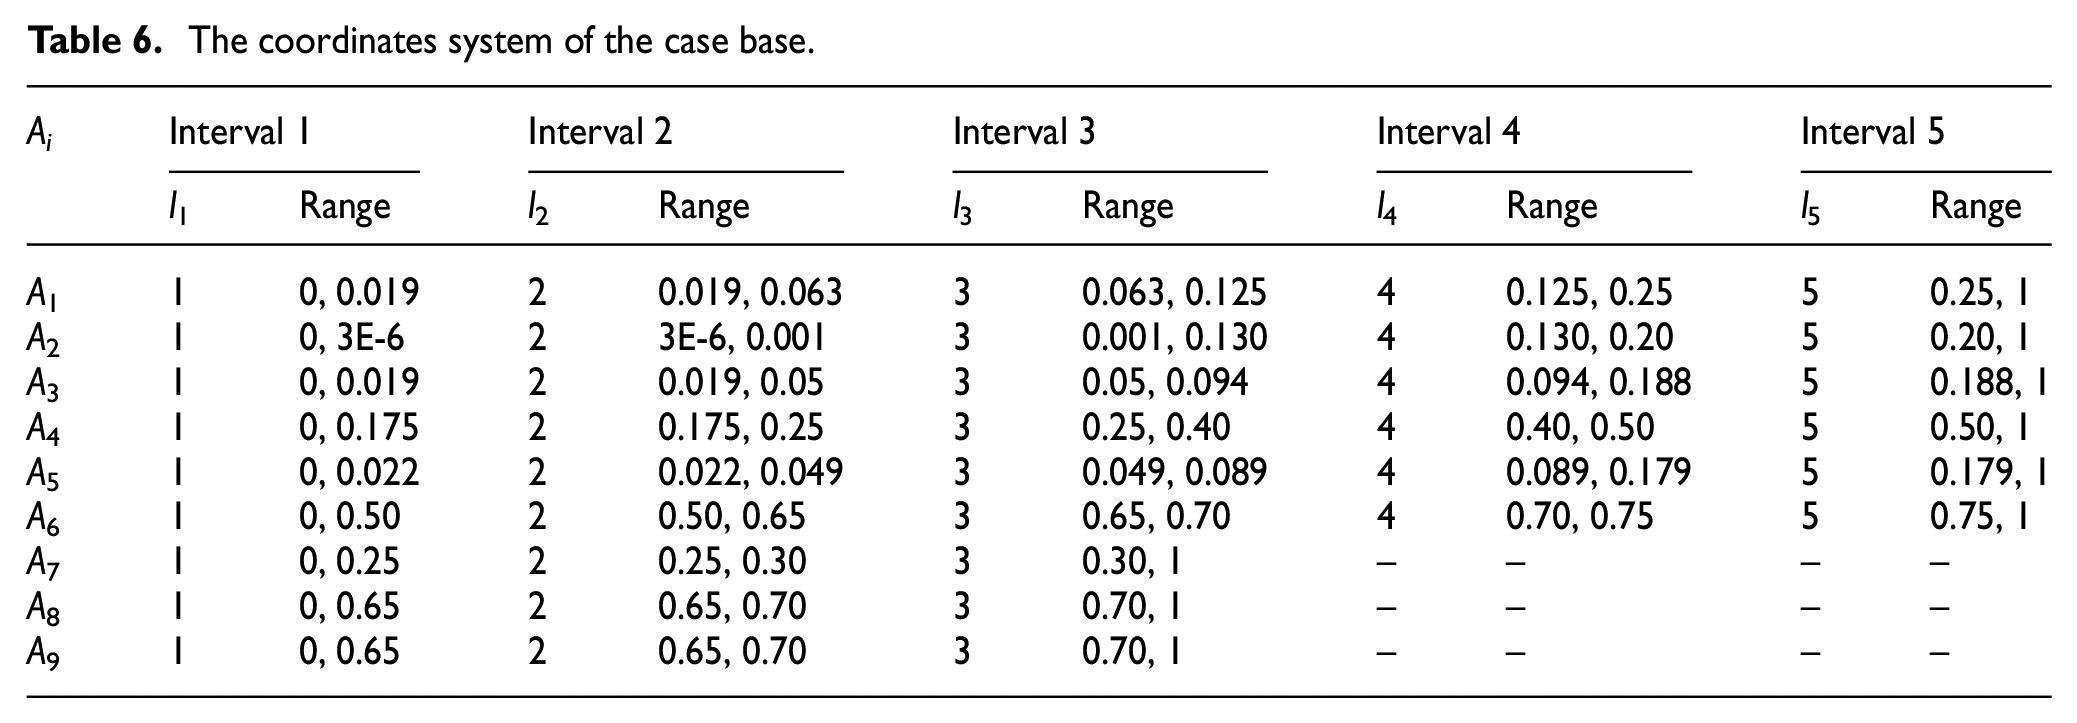
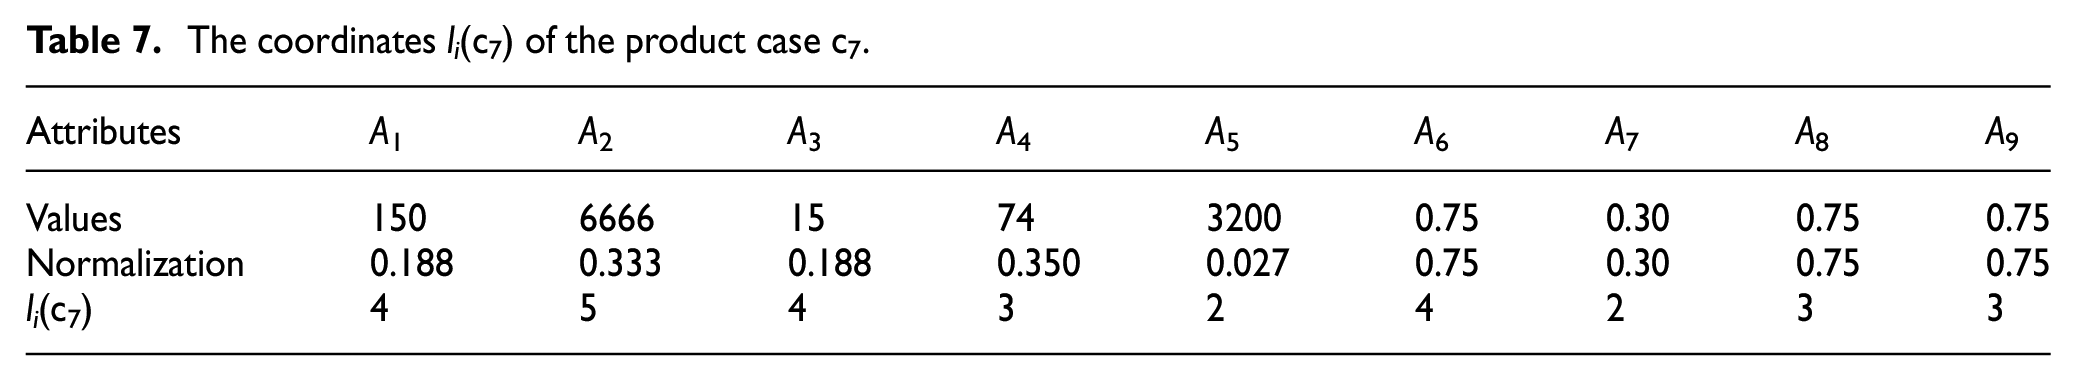
The distribution of cases in Figures 11 and 12 demonstrates that the predefined interval number of each attribute is acceptable, and accordingly, the coordinates system of the case base can be established as shown in Table 6; and then the coordinates of each case should be designated according to the attribute values. Take the product case c7 as the example, the coordinates are given as described in Table 7.
The coordinates system of the case base.
The coordinates li(c7) of the product case c7.
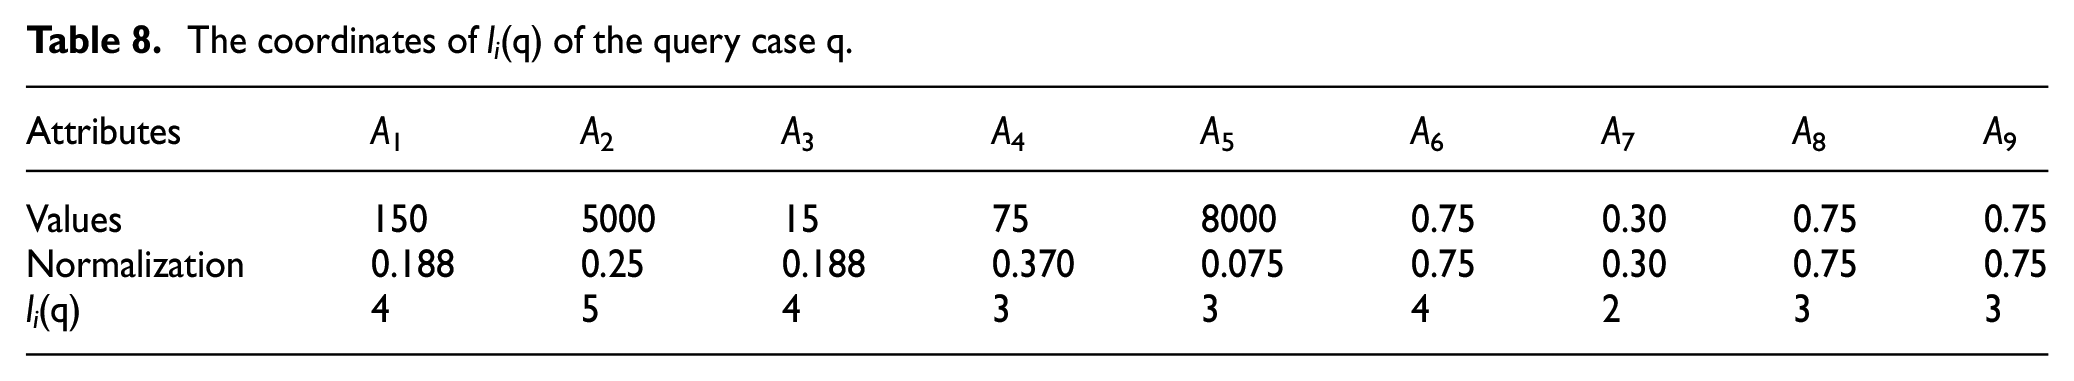
Query case is the target case in the retrieval algorithm, the coordinates of query case are also designated as shown in Table 8 based on the recommended value of each attribute provided in Table 5.
The coordinates of li(q) of the query case q.
The cases labeled with the same coordinates as the query case are extracted to constitute the index set S, and the number of attributes which are matched with the query case q for each case c i , SMA(c i , q) is estimated, as shown in Table 9. From Table 9, it indicates that there is no one case can completely match with the query case in each attribute, that is, the index set S is an empty set. In this situation, the threshold Const is set, Const = 4, and to obtain the index set Sb = {c i : SMA(c i , q)≥4}; thus the index set S0 = {c i : c i ∈SUSb} = Sb; there are 25 cases in S0, the attributes of which are listed in Table 10.
The result of SMA(c i , q) between the product case and query case.

Cases in the index set S0.

Note: 0.25* = (0.1, 0.25, 0.4); 0.3* = (0.2, 0.3, 0.4); 0.35* = (0.2, 0.35, 0.5); 0.5* = (0.4, 0.5, 0.6); 0.65* = (0.5, 0.65, 0.8); 0.7* = (0.6, 0.7, 0.8); 0.75* = (0.65, 0.75, 0.85); 0.85* = (0.75, 0.85, 0.95).
Estimation of the similarity and adaptability
When the index set S0 is generated, cases in the S0 still need to be estimated from two perspectives, the similarity and adaptability according to the low-carbon requirements. For the estimation of similarity, A1-A5 belong to fuzzy numerical attributes, thus it adopts the dependent function to calculate the local similarity of each attribute; and for the nominal attributes A6-A9, the estimation model based on the membership function as constructed in equation (17) is used to calculate the local similarity of each attribute. The result of the similarity estimation for each case is listed in Table 11.
The result of similarity estimation for cases in S0.
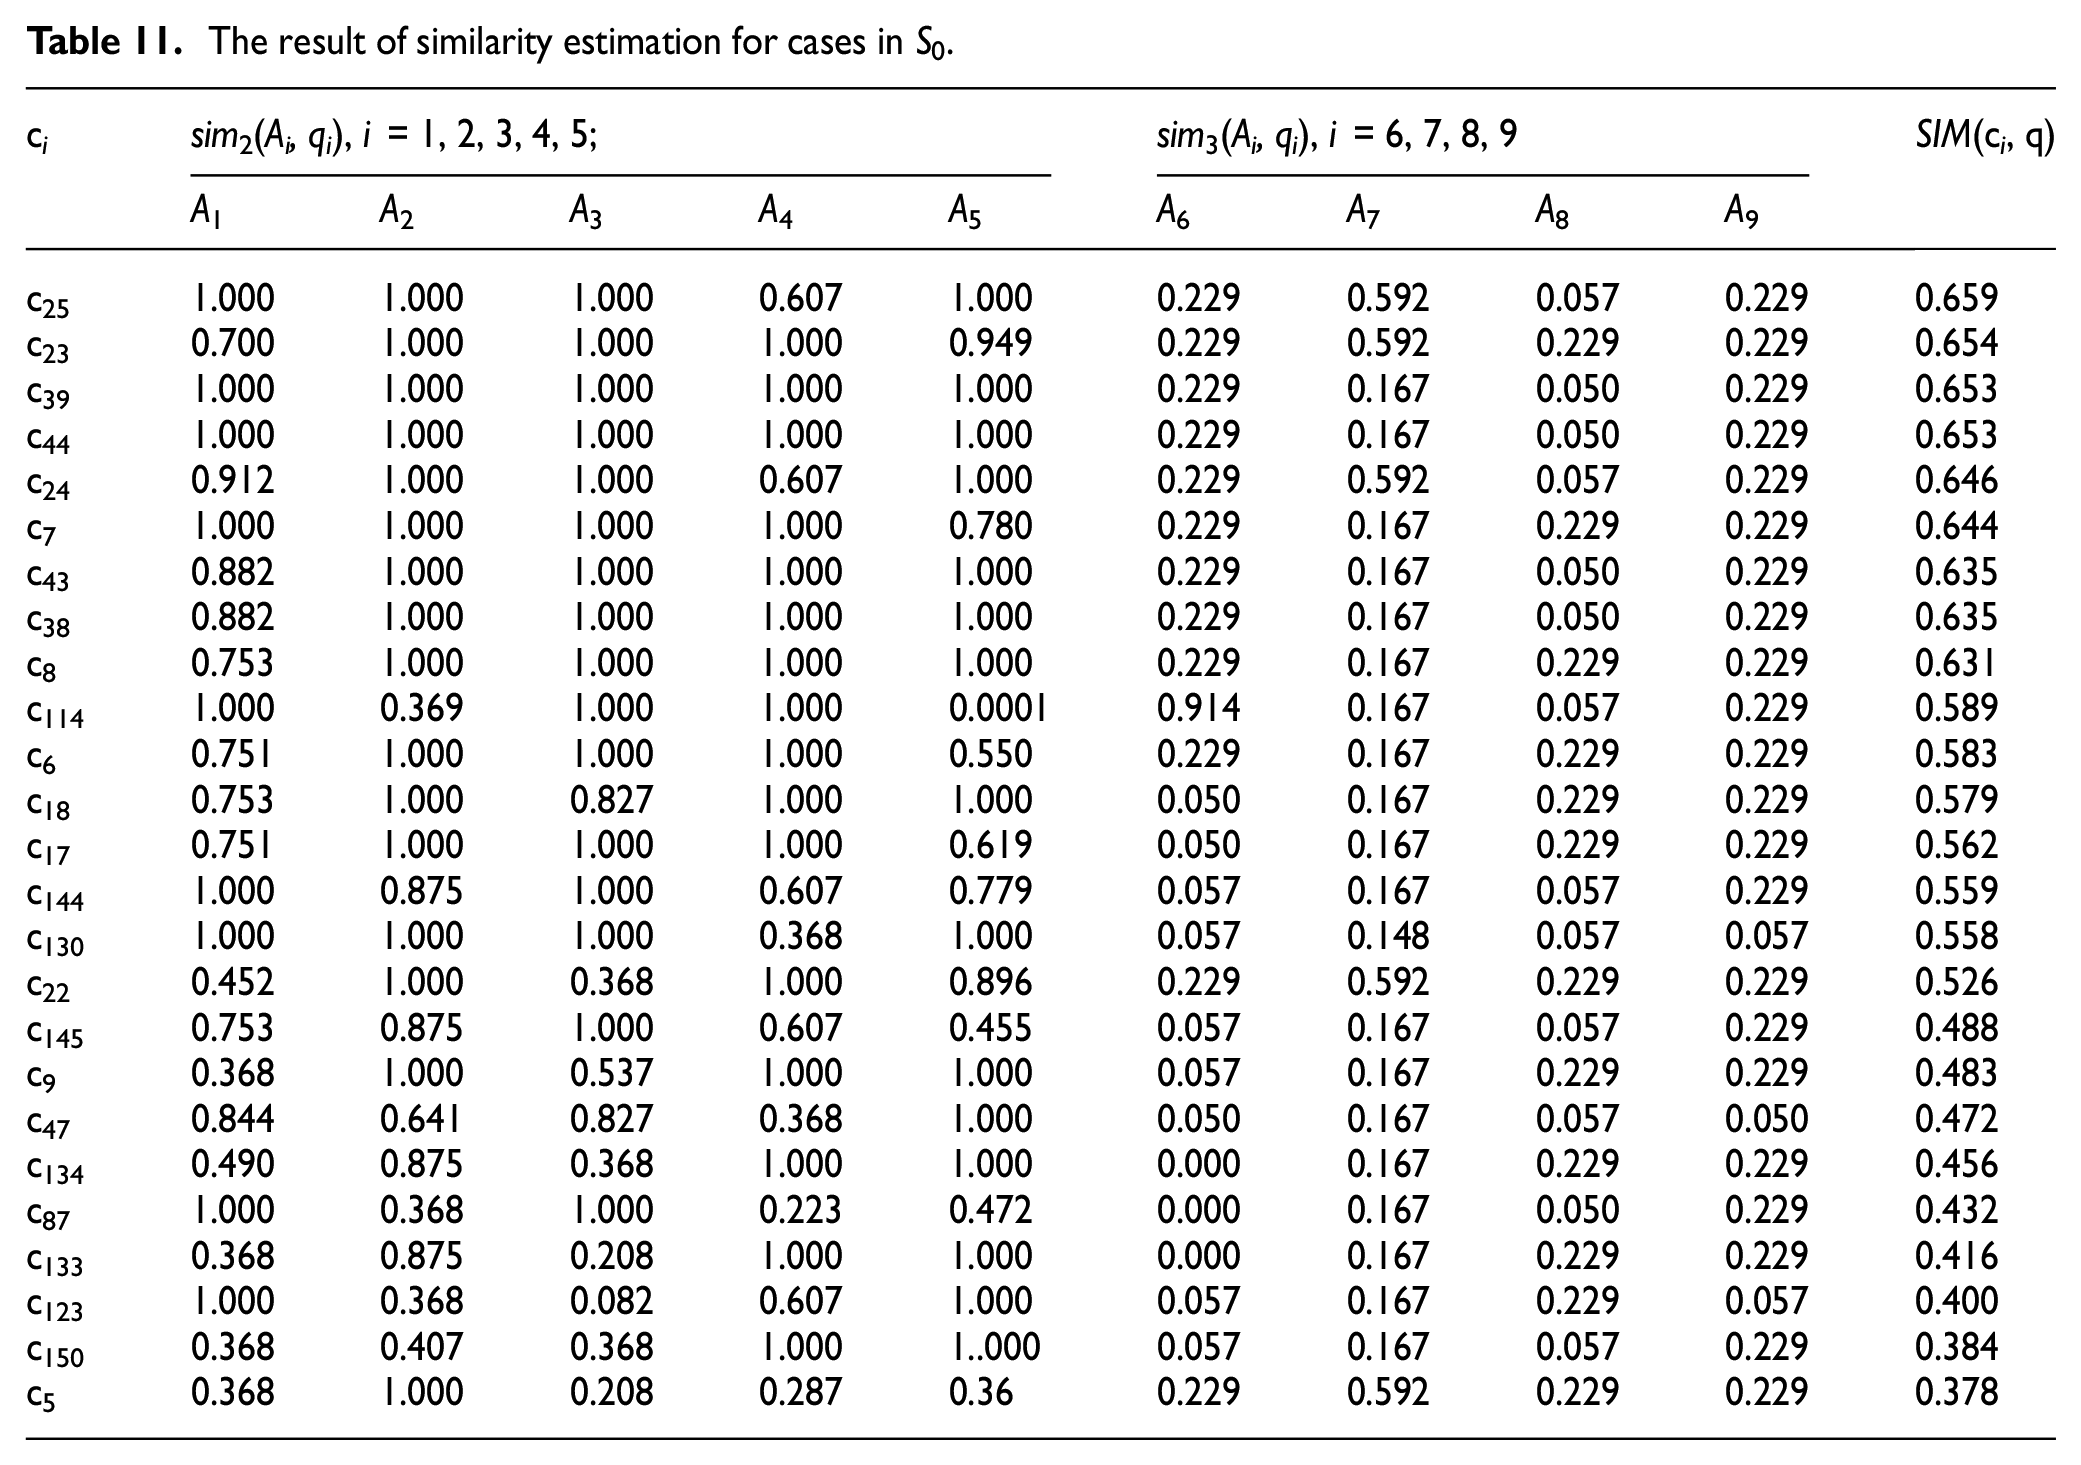
Make a comparison between Tables 9 and 11, it indicates that the cases with high number of matched attributes cannot guarantee high similarity. For instance, case c7 has the highest number of matched attributes, but the similarity of c7 is not the best. This situation is same to the cases c6, c8. Conversely, cases c25, c23, and c24 have relative high similarity although the number of matched attributes of which are not very high. Therefore, the strategy of similarity matching for attributes can effectively prevent similar cases with high similarity from being missed.
Estimation of the adaptability for cases is based on the information content of each attribute, which is determined by the design range and system range. The design range of each attribute is obtained from the requirement analysis, as explained in Table 5, and the range values of numerical attributes need to be transformed into the standardized triangular fuzzy number. The system range of each attribute reveals the maximum range for adaptation of the series product cases under the existing technical conditions. For example, the ultimate pressure of the SK series vacuum pump is generally at the range 6000–8000 Pa, but it can reach 3000 Pa or lower by installing a fore-stage nozzle. Here, it takes case c25 as the example to describe the estimation of the adaptability for each attribute.
In Table 12, the normalized attribute values of design range and system range of the case c25 are provided. For attributes A1(rate of suction and exhaust), A2(ultimate pressure), A3(rated power), they follow the fuzzy triangular distribution; A2 belongs to the Cost type attribute, and the system range is a crisp value, thus the system area of A2 is constructed based on the principle in Figure 9, here with the Cost type attribute. In Figure 14, the calculation models of information content IAi with respect to A1, A2, A3 of case c25 are illustrated, respectively.
IA 1 = log2(1/ (ACR /ASTFN(SR) )) = log2(1/0.28) = 1.836;
IA 2 = log2(1/ (ACR /ASTFN(SR) )) = log2(1/0.747) = 0.421;
IA 3 = log2(1/ (ACR /ASTFN(SR) )) = log2(1/0.679) = 0.558.
Design range of the requirements and system range of c25.


Information content estimation for attributes A1-A3: (a) information content IA1, (b) information content IA2, and (c) Information content IA3.
For attributes A4(noise), A5(cost), they follow the uniform distribution, the calculation models of the information content for A4 and A5 are illustrated in Figure 15.
IA 4 = log2(1/ (LCR/LSR )) = log2(1/0.20) = 2.322;
IA 5 = log2(1/ (LCR/LSR )) = log2(1/0.727) = 0.460.

Information content estimation for attributes A4 and A5: (a) information content IA4, and (b) information content IA5.
For nominal attributes A6-A9, the linguistic term of each attribute value is transformed into the standardized triangular fuzzy number, and the calculation models of the information content for A6-A9 are illustrated in Figure 16.
IA 6 = log2(1/ (ACR/ASTFN(SR) )) = log2(1/0.143) = 2.806;
IA 7 = log2(1/ (ACR/ASTFN(SR) )) = log2(1/0.296) = 1.756;
IA 8 = log2(1/ (ACR /ASTFN(SR) )) = log2(1/0.036) = 4.796;
IA 9 = log2(1/ (ACR/ASTFN(SR) )) = log2(1/0.143) = 2.806.

Information content estimation for attributes A6-A9: (a) information content IA6, (b) information content IA7, (c) information content IA8, and (d) information content IA9.
Then the information content of case c25 is obtained:
The information content of the remaining cases in S0 also can be calculated with the same method, the result is shown in Table 13. In addition, in order to consider the comprehensive influence of similarity and adaptability of the product cases, the comparison analysis histogram of the similarity and information content of each case in the index set S0 is generated, as illustrated in Figure 17.
The result of information content estimation for cases in S0.

Note: α denotes that the corresponding information content approaches infinity.
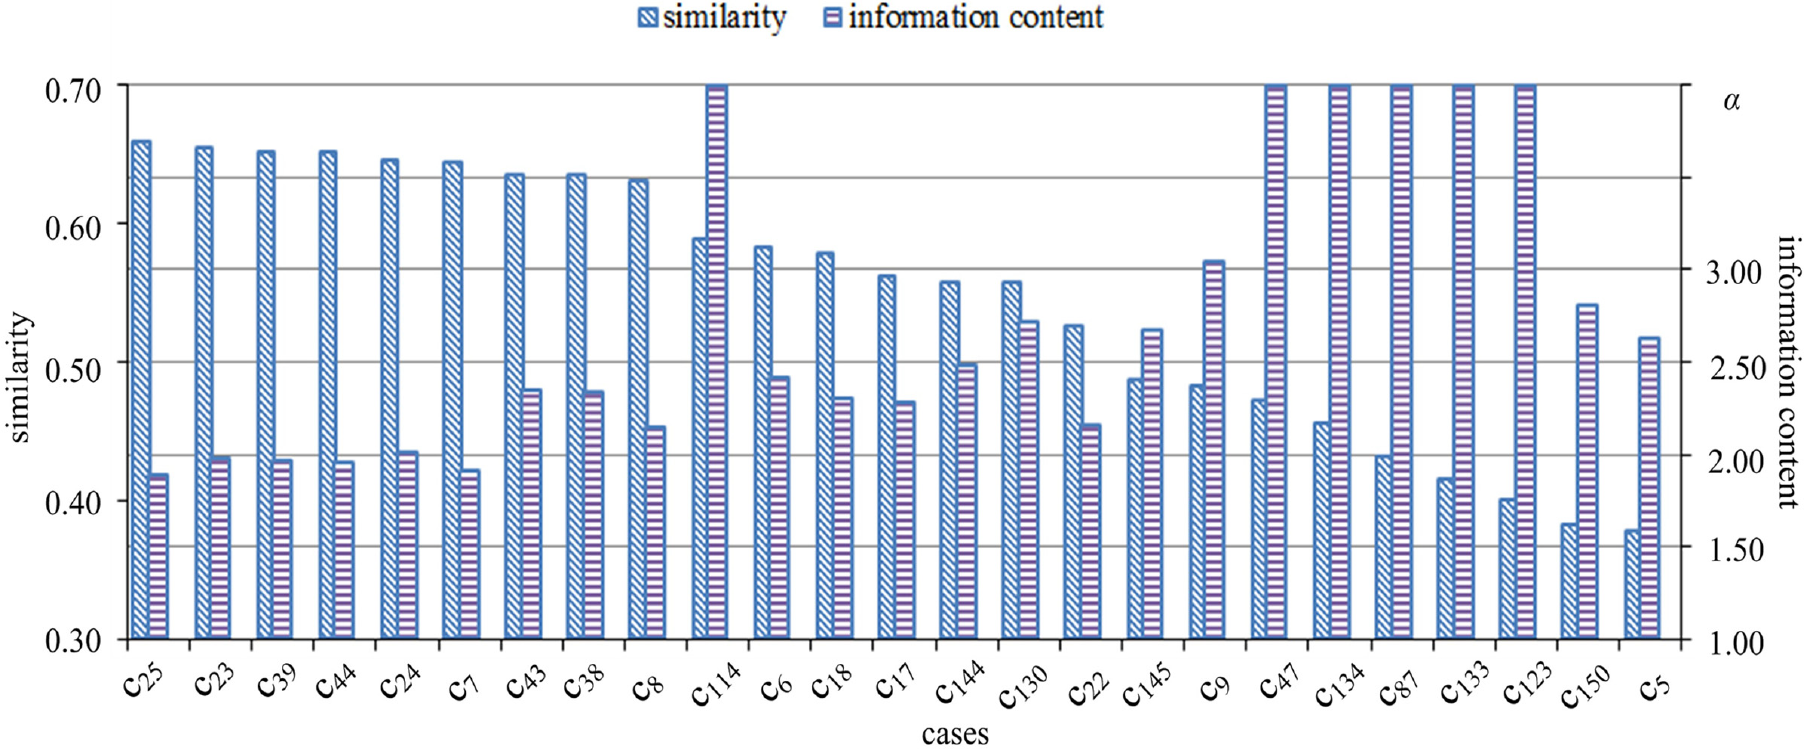
Comparison analysis of the similarity and information content for cases in S0.
In Figure 17, it indicates that cases c25, c23, c39, and c44 have high similarity and small information content; and for the case c7, although the similarity is not high, the information content is small; therefore, these cases are considered as the similar cases knowledge for reuse. For cases c43, c38, c8, although the similarity is not low, the information content is relative large; however, the information content of cases c114, c47, c134, c87, c133, c123 are all approaching infinity, it indicates that there are one or more requirement attributes cannot be satisfied by adaptation under the current technical conditions.
Meanwhile, the local attribute similarity and information content can guide the designer to make targeted improvement for the candidate cases, and it also could indicate the direction of technology updates to some extent. For instance, the attributes A4 (noise) and A8 (maintenance convenience) of c25 cannot be completely satisfied, and the related information content of A4 and A8 are relative high. The designer maybe adopt new scheme to enhance the local similarity rather than make adaption on the original structure, such as install the noise reduction device, and replace the mechanical sealing component with a simple and effective packing sealing component to reduce the failure rate and facilitate the maintenance. Case c114 is a screw vacuum pump, which has good environmental performance and high work efficiency, but its cost is far beyond the scope of the cost constraint; and thus reducing the cost with new technologies is a key issue. The information content of attribute A6 (low-carbon and environmental impact) of cases c87, c133, c134 are all approaching infinity, it reveals that the traditional technology can no longer meet the customer’s low-carbon and environmental needs, and it is urgent to implement the green manufacturing technologies to update the product cases to meet the market demand and the government environmental regulations.
Discussion
In this paper, an effective similarity determination model which integrates the representation of fuzzy requirement information, the efficient indexing approach, and the evaluation method for the similarity and adaptability into a holistic similar cases retrieval methodology is proposed to support low-carbon product design. A case study concerning the similar cases retrieval for the vacuum pump low-carbon design is conducted to verify the applicability of the proposed methodology; and the theoretical and practical implications of our research work are discussed below.
In the earlier design stage, designers can basically specify the accurate values for the very familiar requirement attributes. However, when taking account of the low-carbon requirements, it requires the reconfiguration for corresponding quality characteristics, which possibly contributes to complex design conflicting problems as the coupling property between the quality characteristics, namely, one design factor about the low-carbon requirements is improved, while the related factor is deteriorated. Consequently, even if there are experienced domain experts for the design task, sometimes they cannot grasp deep knowledge and precisely address the complex low-carbon design problems with incomplete design information, but they can roughly know the possible range of design attribute values, and the tolerable differences between the query case attribute values and that of the candidate cases to ensure the designated parameter ranges are still satisfying the design purpose. Therefore, for the fuzzy requirement attributes, this study adopts the fuzzy set theory to represent the incomplete and uncertain design information, and it defines the feasible interval and desired interval to make flexible for the designers in decision-making to the design parameters.
For the improved D-HS method, it adopts the recommended attribute values to assign the indexing coordinates for the query case rather than uses the design range of each attribute to construct the index set mainly due to the following considerations: if it uses design ranges of attributes to search the similar cases, then it must identify all cases in the memory whether they are falling within the index set every time with a new requirement, and thus it loses the meaning of the intervals division. Conversely, with the recommended values, the coordinates of the query case can be designated, and cases having the same coordinates with that of the query case are extracted to build the index set; in addition, when the coordinates of the current query case are same as that of the previous one, similar cases in the index set saved in the database can be immediately reused.
In our study, we propose the strategy that the number of cases is approximately equal for each interval of attributes to make sure the cases can be evenly distributed. In case study, it predefine the interval number of the i-th attribute Li, however, the determination of Li is actually an iterative process to satisfy the criteria in equation (8). Besides, for two neighboring cluster cases, if the average values of the i-th attribute of the two clusters are quite different, then it is necessary to construct the attribute interval for two clusters separately, and re-designate the Li, even though only the sum of the number of cases of two clusters can satisfy the condition of uniform distribution of the cases. The strategy of similarity matching for attributes proposed in the paper provides a supplementary index set Sb by defining the required number of matched attributes, namely the threshold Const, which effectively avoids the omission of the similar cases. For example, in the case study, cases c25,c24,c23 are included in the initial index set S0, the number of the matched attributes of these three cases are not high, they can be seen as the edge cases as illustrated in Figure 3(b); although they do not fall within the same intervals with the query case, they have the high similarity, and luckily, they are not neglected.
The effective estimation models of the similarity and adaptability of the cases are respectively established in our study. For the similarity calculation of precise numerical attributes, it adopts the traditional distance measurement to calculate the local similarity; for the fuzzy numerical attributes, it uses the dependent function to construct the local similarity evaluation model, as it can better distinguish the degree to which the attribute values of the candidate case meet the design requirements. That is, when the value of dependent function of the attribute is equal or more than one, it indicates the attribute value is completely meet the demand; when the value of dependent function is between zero and one, then the attribute value is acceptable; while when the value of dependent function is less than zero, the attribute value cannot be satisfied. For the nominal attributes, the traditional method is to use the binary estimation model, 0 and 1. For instance, the linguistic term of the attribute low-carbon and environmental impact (A6) of the query case is required “good”, when the linguistic term of A6 of the candidate case is “good”, then the similarity is equal to 1, otherwise is 0; however, when the linguistic term of A6 of the candidate case is “very good”, “fair”, “poor”, or “very poor”, it cannot clearly distinguish the similarity of these values. In our study, the linguistic terms of the nominal attribute are transformed into the standardized fuzzy triangular numbers, and the similarity estimation model is constructed based on the ratio of area of the common range to the area of the design range.
The estimation model of the adaptability of the candidate case is proposed based on the information content presented in the Information Axiom. For one certain attribute of the case, the smaller the information content, the better the adaptability performance, because the system range of this attribute has a high degree of overlap with the design range, which indicates it has a high probability to meet the design requirements through modification; and the information content of the case is the sum of the information content of each attribute. To estimate the information content of each attribute, it is important to identify its system range that is based on the existing manufacturing technologies, design specification, related laws and regulations, etc. Thus it is hard to delineate a clear system range of the attribute with the incomplete design information. In this study, for the numerical attribute, the upper and lower boundary values that the attribute can reach under the current technical conditions of the series product cases are defined as the system range. For example, the rate of suction and exhaust of the SK series vacuum pump can be promoted by enhancing the rated power or increasing the number of impellers, and thus to obtain the maximum and minimum value of the rate of suction and exhaust to construct the system range. For the nominal attribute, the system range is defined by evaluating the corresponding sub-factors. For instance, to define the system range of the attribute A6, it needs to evaluate its sub-factors, such as the life cycle carbon footprint of the product, assemble and disassemble for the components reuse, the material recycling and disposal methods; the linguistic term of the attribute is final obtained by scoring the each sub-factor, and then the system range of the attribute is specified by comparing series product cases.
Conclusion and further research
In low-carbon product design, it takes account of the low-carbon requirements at preliminary design stage in consideration of the reduction of the carbon emissions throughout the product life cycle. However, as the coupling properties between the quality characteristics, it inevitably causes the design conflicting problems when incorporating the low-carbon indicators, which needs to go through multiple backtracking design processes to coordinate the contradictions. Thus, it is a good strategy for exploiting the prior design knowledge and experience to solve the similar design problems. In our study, we propose an effective similarity determination method to obtain acceptable cases knowledge for reuse, similarity here is not only referred to the similarity between the attribute values of the query case and that of the candidate case, but the similarity of the system range of the candidate case and the design range of the query case.
The incomplete and uncertain requirements information is represented based on the fuzzy set theory. The efficient D-HS indexing approach is improved with two valid strategies, the strategy that keep approximately equal number of the cases for intervals division, and the strategy of similarity matching for attributes; the improved D-HS method can effectively guarantee the basically even distribution of cases in each attribute interval, and avoid the omission of the similar cases when the location of the query case is close to the boundaries of the design ranges. In terms of the similarity estimation, it adopts the classical distance measurement and dependent function to calculate the local similarity for the precise numerical attribute and the fuzzy numerical attribute; and for the fuzzy nominal attribute, the similarity is based on the ratio of area of the common range to the area of the design range. For the adaptability estimation, it adopts the information content presented in the Information Axiom to construct the evaluation model for the adaptability of each attribute, the smaller the total information content, the better the adaptability of the candidate case. Thus, the cases having high similarity and small information content can be considered as the acceptable cases for knowledge reuse and adaptation.
In our proposed methodology, the information content of each attribute depends on the corresponding design range and system range, in the further research, it is necessary to use the sensitivity analysis and Monte Carlo analysis methods to more reasonably determine the boundaries of the design range and system range of each attribute, as well as the distribution of its fuzzy membership function. In addition, it is essential to adopt the contradictory problems solving methods, such as the TRIZ, Extenics, to address the design conflicts during the adaptation for the similar cases, which facilitate the generation of the low-carbon innovative design schemes.
Footnotes
Handling Editor: James Baldwin
Declaration of conflicting interests
The author(s) declared no potential conflicts of interest with respect to the research, authorship, and/or publication of this article.
Funding
The author(s) disclosed receipt of the following financial support for the research, authorship, and/or publication of this article: this research work was supported by the National Natural Science Foundation of China (Grant No. 51875524 and No. 61873240) and the Zhejiang Province Postdoctoral Research Foundation (Grant No. zj2019130).